
Crack the Code of Data Mastery for SMEs
Data mastery is rapidly becoming a critical asset in today’s business landscape, especially for small and medium-sized enterprises (SMEs) seeking
Supercharge Your Finances with Smarter Modelling
Understanding the Basics of Financial Modelling Financial modelling is an essential practice for businesses and individuals aiming to make informed

Revamping Your Reporting with PowerBI
Revamp Your Reporting with PowerBI: Unleashing the Potential of Data Visualization PowerBI has transformed the way businesses approach data reporting,
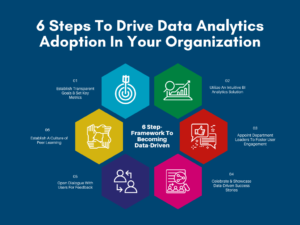
Small Business Secrets: Unlocking Power with Business Intelligence Tools
How Small Business can use implement BI tools to their advantage: 🟦 Embrace the BI Wave: A Blueprint for Small

Welcome to Vizule – Data and Business Intelligence Solutions
Welcome to Vizule, we help you to connect the dots within your data. Solving all your data visualisation needs and
AI Capabilities in Power BI: Unlocking AI-Driven Insights and Driving Business Growth
To better understand how the integration of Artificial Intelligence (AI) with Power BI is revolutionizing business analytics and driving growth,