

Here are the key features and benefits of Business Intelligence use-cases in the real estate industry:
- Business Intelligence Use-Case in Real Estate:
- 📊Diverse Data Integration
- 📈Enhanced Property Valuation with BI
- ↗ Predictive Analysis for Future Investments
- 🚀Streamlined Operations and Management
- ⚡Marketing Optimisation
- 👨👨👧👦In-depth Demographic Analysis
- 🌍Geospatial Analysis for Visual Insights
- 🕥Real-time Market Analysis for Agile Decision Making
- 💻Training and Skill Development with BI
- ✔Regulatory Compliance Simplified
- 📊Datasets Driving BI in Real Estate
- 📈Outputs Dictating Decision Making
- The Future of The Real Estate Industry
- Here is a full bullet-pointed breakdown of the power of BI (excuse the pun) in Real Estate:
- Getting Started with Business Intelligence for Real Estate
The real estate industry, traditionally driven by intuition and experience, is undergoing a seismic shift with the advent of Business Intelligence (BI) tools like Power BI and Tableau. These tools are not just enhancing operational efficiency but are reshaping decision-making processes. Let’s explore the multifaceted impact of BI on the real estate landscape.
Business Intelligence Use-Case in Real Estate:
📊Diverse Data Integration
The Power of Comprehensive Data: BI tools can integrate a plethora of datasets, from local property sales and rental yields to demographic data and urban development plans. This comprehensive data integration offers a holistic view of the property market, ensuring decisions are based on a blend of historical data and predictive analytics.
📈Enhanced Property Valuation with BI
Beyond Traditional Metrics: With BI tools, property valuation transcends basic comparative market analyses. Agents can factor in diverse metrics, such as proximity to local amenities, future infrastructure projects, and even local school ratings, ensuring valuations are both accurate and reflective of future potential.
↗ Predictive Analysis for Future Investments
Spotting the Next Hotspot: BI tools like PowerBI and Tableau offer robust predictive analytics capabilities. By analysing patterns in historical data, these tools can forecast emerging property hotspots, ensuring investors stay ahead of the curve.
🚀Streamlined Operations and Management
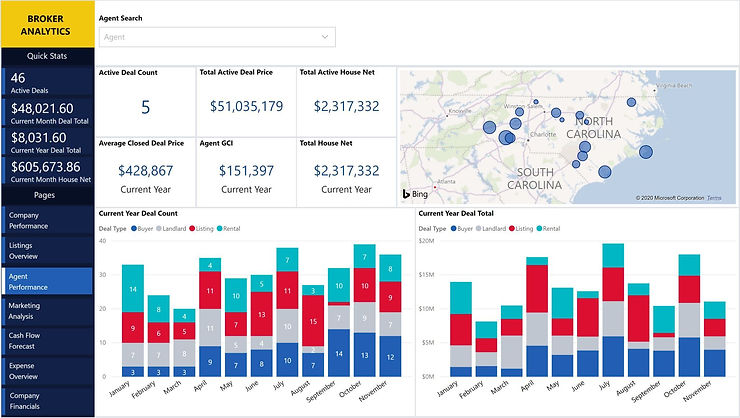
Unified Dashboards: Property management is a multifaceted operation. BI tools offer customisable dashboards, providing property managers with real-time insights, from tenant feedback to maintenance schedules, ensuring timely interventions and operational efficiency.
⚡Marketing Optimisation
Tailored Campaigns for Target Audiences: BI tools dissect marketing data, allowing agents to tailor campaigns for specific demographics. Whether it’s young professionals or families, agents can ensure their marketing resonates with the target audience, optimising lead generation.
👨👨👧👦In-depth Demographic Analysis
Understanding Local Dynamics: BI tools offer granular demographic insights. Agents can analyse factors like average age, family size, income levels, and more, tailoring property offerings to meet local demands.
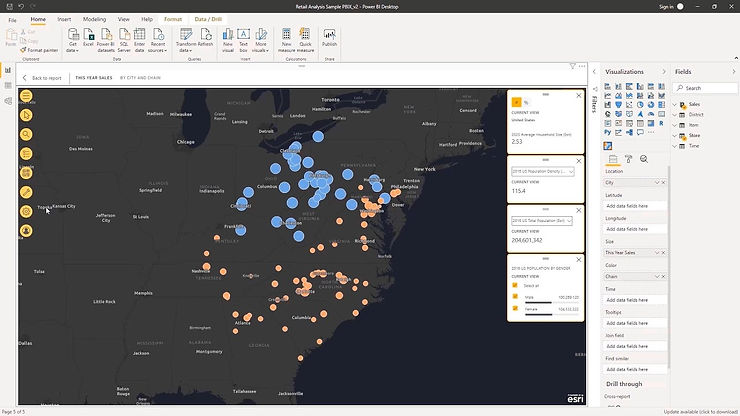
🌍Geospatial Analysis for Visual Insights
Mapping the Property Landscape: Tools like Tableau excel in geospatial analysis, transforming data into visual insights. Agents can overlay property data on interactive maps, offering clients a comprehensive view of local amenities, transport links, and more.
🕥Real-time Market Analysis for Agile Decision Making
Staying Responsive: The dynamic nature of the property market necessitates agility. With real-time data analysis, BI tools ensure agents can respond promptly to market shifts, from adjusting property prices to launching new marketing campaigns.
💻Training and Skill Development with BI
Equipping the Modern Agent: As BI becomes integral to real estate, there’s a growing need for training. Agencies can leverage BI tools to identify skill gaps, ensuring their teams are always at the forefront of industry advancements.
✔Regulatory Compliance Simplified
Streamlined Reporting: The real estate sector is bound by numerous regulations. BI tools offer customised reporting capabilities, simplifying regulatory compliance and ensuring agencies can focus on their core operations.
📊Datasets Driving BI in Real Estate
The Backbone of BI: Several datasets drive BI insights in real estate. These include property sales data, rental market trends, local infrastructure developments, demographic data, and even consumer sentiment analyses. By integrating these datasets, BI tools offer a 360-degree view of the property landscape.
📈Outputs Dictating Decision Making
From Data to Decisions: BI tools transform raw data into actionable insights. Whether it’s visual dashboards highlighting market trends or predictive models forecasting rental yields, these outputs play a pivotal role in dictating decision-making processes, ensuring agents and investors make informed, data-driven decisions.
Other alternatives to Power BI and Tableau include, Astrato, Looker, Qlik Sense etc. At Vizule we specialise in all, so contact us to speak to an expert!
The Future of The Real Estate Industry
The integration of BI tools like Power BI and Tableau into the real estate sector marks a paradigm shift. As the industry transitions to a more analytical, data-driven approach, embracing BI will be the differentiator. The future of real estate is here, and it’s powered by Business Intelligence.
Here is a full bullet-pointed breakdown of the power of BI (excuse the pun) in Real Estate:
1. Property Valuation:
- Analyse historical sales data.
- Factor in local amenities, infrastructure, and future development plans.
- Predict future property values based on market trends.
2. Investment Analysis:
- Identify emerging property hotspots.
- Forecast rental yields and property appreciation.
- Analyse risk factors for property investments.
3. Tenant Management:
- Track tenant demographics and preferences.
- Monitor rental payment histories.
- Predict tenant turnover rates and vacancies.
4. Property Maintenance:
- Schedule and track regular maintenance tasks.
- Predict future maintenance needs based on historical data.
- Analyse costs and efficiency of maintenance activities.
5. Marketing and Sales:
- Track effectiveness of marketing campaigns.
- Identify best channels for property listings.
- Analyse customer feedback and inquiries.
6. Demographic Analysis:
- Study local population age, income, and family size.
- Analyse preferences and needs of different demographic groups.
- Predict future demographic shifts and their impact on the property market.
7. Geospatial Analysis:
- Visualise property data on interactive maps.
- Analyse proximity to amenities, transport links, and schools.
- Identify areas with high demand or potential for development.
8. Financial Analysis:
- Monitor cash flows, expenses, and profits.
- Forecast future financial trends and challenges.
- Analyse the profitability of different properties or investments.
9. Regulatory Compliance:
- Track and ensure adherence to local property regulations.
- Generate compliance reports.
- Predict potential regulatory changes and their impact.
10. Market Trends:
- Analyse historical and current market data.
- Identify patterns and trends in property sales and rentals.
- Forecast future market movements.
11. Customer Relationship Management (CRM):
- Track interactions with clients and potential buyers/tenants.
- Analyse client feedback and satisfaction.
- Predict future client needs and preferences.
12. Supply Chain Management:
- For property developers, track construction materials, costs, and suppliers.
- Monitor timelines and efficiency of construction projects.
- Predict potential supply chain disruptions.
13. Competitive Analysis:
- Monitor and analyse activities of competitors.
- Identify market gaps and opportunities.
- Strategies based on competitive strengths and weaknesses.
14. Sustainability and Environmental Impact:
- Track energy efficiency of properties.
- Monitor and analyse water usage, waste management, and other sustainability metrics.
- Predict future sustainability challenges and opportunities.
15. Virtual Tours and Digital Interactions:
- Analyse user engagement with virtual property tours.
- Track and improve the digital customer journey.
- Predict future digital trends in property showcasing.
Conclusion:
BI tools offer a plethora of functionalities that can significantly enhance various aspects of the real estate industry. By leveraging these tools, real estate professionals can make more informed decisions, optimise operations, and stay ahead in a competitive market.
Getting Started with Business Intelligence for Real Estate
If you want to learn more on how we at Vizule can help you on your Business Intelligence journey and exponentially grow your reporting, modelling and analysis within the Real Estate market. Then please contact us and one of our experts will be at your service.
Find out more about Vizule and what we offer by clicking this link.