


Are you a founder or operator spending hours wrestling with disconnected spreadsheets, only to get outdated reports you can’t trust? You’re not alone. This daily struggle with ‘Excel chaos’ is a major roadblock for growing SMBs, preventing you from seeing the full picture of your business performance. The solution isn’t another spreadsheet; it’s transforming that siloed data into a dynamic, automated reporting engine. This article showcases 7 powerful business intelligence dashboard examples to inspire your transition from manual reporting to insight-led decision-making.
We’ll move beyond generic templates and provide a strategic breakdown of what makes each dashboard effective for its specific industry, from finance and sales to operations and marketing. For each example, you will find:
- Strategic Analysis: A look at the design rationale and how it solves a core business problem for founders and operators.
- Key Metrics: An explanation of the most important KPIs and why they matter for an SMB.
- Actionable Takeaways: Replicable methods you can apply to your own reporting stack, moving from Excel to Power BI.
Each entry includes screenshots and direct links to see the dashboards in action. Our goal is to give you a clear roadmap for creating a BI system that provides the real-time visibility needed to align finance and operations, scale smartly, and finally unlock the story your data is trying to tell.
1. Vizule.io Business Intelligence
For founders and operators aiming to move beyond fragmented spreadsheets and establish a truly cohesive data strategy, Vizule.io offers a standout, end-to-end business intelligence service. It serves as a powerful example not just of a dashboard, but of a comprehensive BI ecosystem meticulously designed to transform raw data into a strategic asset. Vizule’s core strength lies in its consultative, bespoke approach, making it an invaluable partner for SMBs ready to embed data-driven processes from the ground up.
Their methodology goes far beyond simply delivering a visually appealing dashboard. They address the foundational challenges that plague many businesses, such as data silos and manual reporting inefficiencies. By consolidating disparate data sources like your CRM, accounting software, and operational platforms into a unified single source of truth, Vizule empowers you with reliable, real-time insights, eliminating the manual drudgery of data reconciliation and enabling a shift toward high-value analysis.
Strategic Analysis: Beyond the Dashboard
Vizule’s approach is a prime illustration of how a BI solution should function as a strategic capability, not just a reporting tool. Their unique “Map, Model, Mobilise” framework is engineered for rapid, tangible results, delivering a fully-functional forecasting model and actionable insights within 30 days. This accelerated timeline is a significant advantage for SMBs and growth-stage companies that need to pivot quickly based on reliable data.
Key Strategic Insight: The true value of Vizule’s service is its ability to build a sustainable data culture. By combining advanced Power BI development with immersive team training and continuous iteration, they ensure the BI solution is not only adopted but becomes central to your company’s operational rhythm.
This focus on adoption is critical. Many BI projects fail because the end-users are not equipped to leverage the tools effectively. Vizule mitigates this risk by making training and empowerment a core part of its offering, ensuring teams can confidently explore data, ask new questions, and make informed decisions independently. This emphasis on building internal capability is a key differentiator from vendors who simply provide a software license and documentation.
Actionable Takeaways & Implementation
For businesses considering a similar path, Vizule’s model provides a clear blueprint for success.
- Prioritize Strategy Before Tools: Begin with a comprehensive data strategy consultation to map your key business questions, data sources (e.g., Xero, HubSpot, Excel), and desired outcomes. This foundational step ensures the final dashboard directly addresses your most critical needs.
- Embrace Automation: Identify the most time-consuming manual reporting tasks—like building a cash flow report—and target them for automation first. This delivers immediate time savings and builds momentum for the project.
- Invest in Advanced Analytics: Go beyond descriptive metrics. Leverage capabilities like causal analysis and driver-based forecasting models to uncover the underlying drivers of performance, enabling more accurate strategic planning.
By focusing on a holistic, end-to-end solution that combines technology with strategy and training, Vizule provides one of the most robust business intelligence dashboard examples available. Their approach demonstrates how to create a system that not only reports on the past but also illuminates the path forward, a critical capability for any modern organization. To delve deeper into this philosophy, you can learn more about their approach to data-driven decision-making.
If you’re ready to transform your scattered data into your most powerful asset, book your free BI consultation with Vizule today.
2. Coupler.io Blog
For teams looking to accelerate their BI journey without starting from a blank canvas, the Coupler.io Blog is an invaluable resource. It’s less a single dashboard and more a strategic library of pre-built, functional Power BI templates. This platform excels by providing a launchpad for businesses, particularly SMBs, that need sophisticated reporting capabilities without lengthy development cycles.
The primary value proposition is speed and accessibility. Coupler.io offers a diverse collection of dashboard templates covering critical business functions like marketing, e-commerce, finance, and web analytics. These aren’t just static images; they are fully functional Power BI files designed to be connected to your live data sources via the Coupler.io data integration platform. This model is especially powerful for businesses already overwhelmed by manual reporting in Excel.
Strategic Analysis
The genius of Coupler.io’s approach is its integration-first model. A visually appealing dashboard is useless without clean, reliable, and automated data feeding into it. By bundling templates with their data automation service, they solve two problems at once: data connection and visualization.
Key Insight: The true barrier to effective BI is often not dashboard design but the underlying data plumbing. Coupler.io addresses the entire workflow from data source to visualization, making it one of the more practical business intelligence dashboard examples for operators who need results quickly without deep technical skills.
The platform effectively democratizes advanced analytics, allowing non-technical users to deploy a sales performance dashboard or a financial summary report that would typically require significant developer resources.
Actionable Takeaways
- Access: The blog and its template examples are free to browse. Using the templates with live data requires a Coupler.io subscription.
- Best For: SME owners and managers who want to move beyond spreadsheets and implement a dynamic reporting solution with minimal technical overhead.
- Pro Tip: Use the templates as a starting point. While they are comprehensive, the real power comes from customizing them to your specific KPIs and business logic. Identify the core metrics in a template that align with your goals and prune the rest to avoid information overload.
Want to automate your reporting and finally trust your data? Vizule can help you implement and customize powerful Power BI dashboards tailored to your unique business needs. Book your free BI consultation today and let’s transform your Excel chaos into clarity.
3. Sunflower Lab
For organizations where procurement and supply chain are central to profitability, Sunflower Lab offers a specialized suite of Power BI dashboards. They move beyond generic templates to provide a focused, in-depth analytical tool for purchase and vendor management. This platform is ideal for businesses aiming to transform their procurement data from a simple record of transactions into a strategic asset for cost control and operational efficiency.
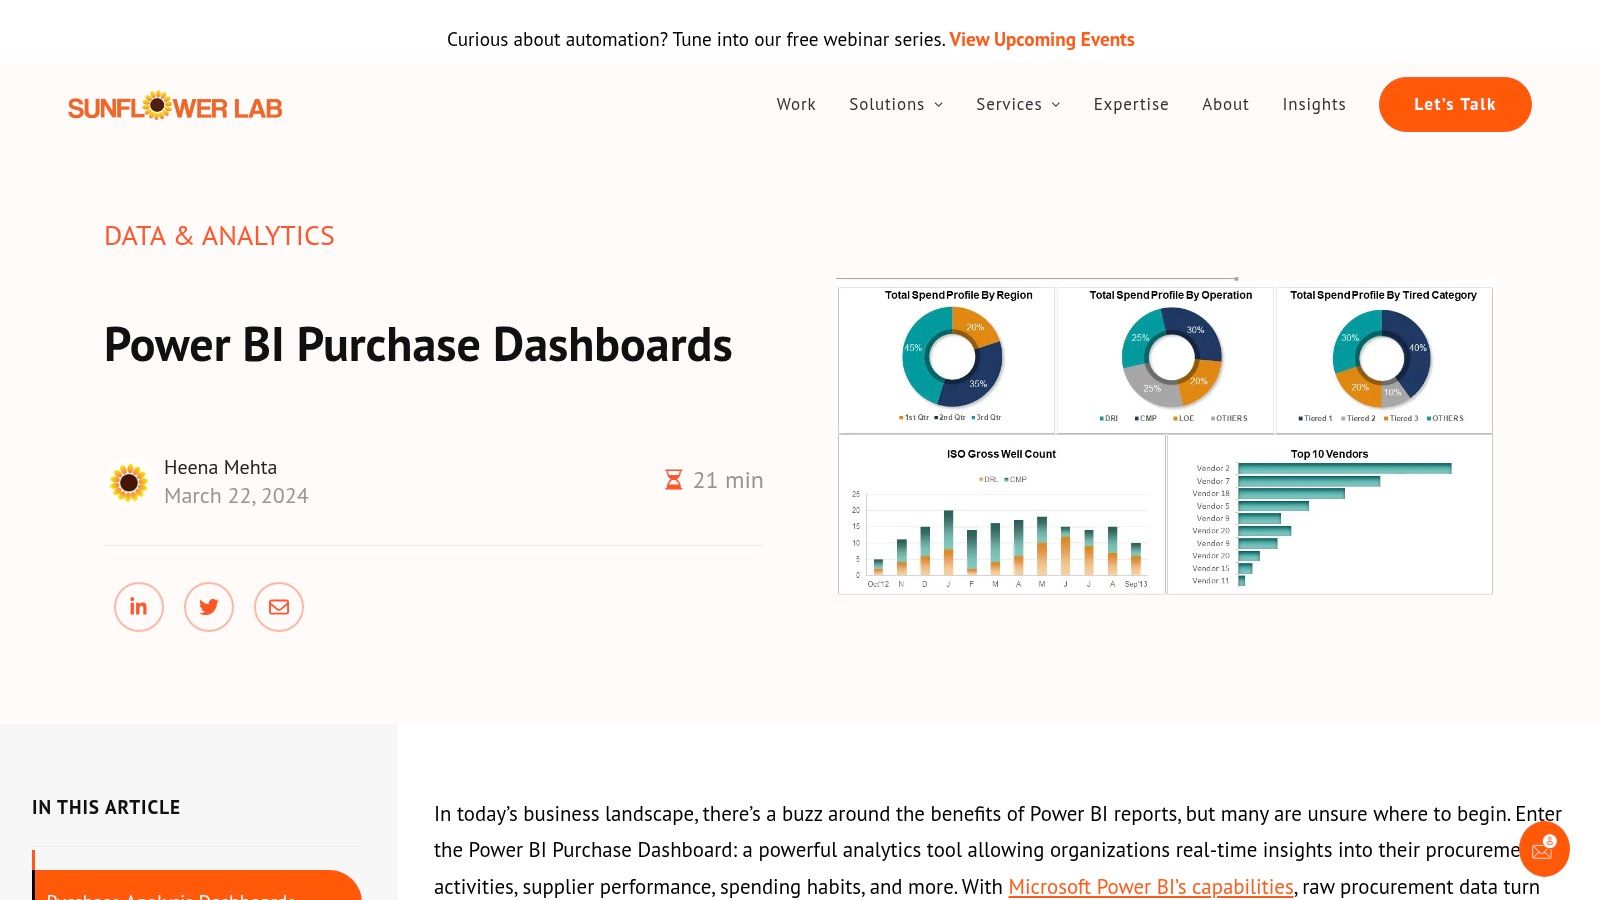
Sunflower Lab’s core value is its deep specialization in procurement analytics. Their dashboards are designed to integrate directly with enterprise resource planning (ERP) systems, offering real-time visualizations of critical metrics like company spending, vendor performance, and inventory levels. This sharp focus allows for a level of detail and relevance that broader, all-in-one BI solutions often miss, making it a powerful choice for supply chain managers and CFOs.
Strategic Analysis
The strength of Sunflower Lab’s approach lies in its vertical expertise. By concentrating solely on procurement, they deliver dashboards that answer the highly specific questions finance and operations leaders have about their supply chain. This includes analyzing purchase price variance, identifying maverick spending, and evaluating vendor reliability—metrics that are vital for cost savings and risk management.
Key Insight: Optimizing procurement is a high-leverage activity for improving margins. By providing a dedicated tool for this function, Sunflower Lab creates one of the most targeted business intelligence dashboard examples available, turning complex ERP data into clear, actionable financial and operational insights.
Their dashboards empower teams to move from reactive purchasing to strategic sourcing, backed by data on every vendor and transaction. This is crucial for businesses looking to build more resilient and cost-effective supply chains.
Actionable Takeaways
- Access: Sunflower Lab offers custom dashboard development services. Access requires engaging them for a project, scoped and priced based on specific business needs.
- Best For: CFOs, procurement managers, and operations directors in manufacturing, retail, or any industry with a significant procurement function.
- Pro Tip: Before engaging, map out your entire procure-to-pay process. Identify your top 5 most critical procurement KPIs, such as cost per invoice, supplier lead time, or on-time delivery rate. This will help you articulate your needs clearly and ensure the final custom dashboard directly addresses your biggest pain points.
4. Senturus Dashboard Gallery
For decision-makers weighing their options between different BI platforms, the Senturus Dashboard Gallery serves as an essential comparative tool. It’s not a single dashboard but an interactive, multi-platform showcase, allowing users to explore and contrast live examples built in Power BI, Tableau, and Cognos. This unique approach helps businesses understand the nuances of each tool before committing significant resources.
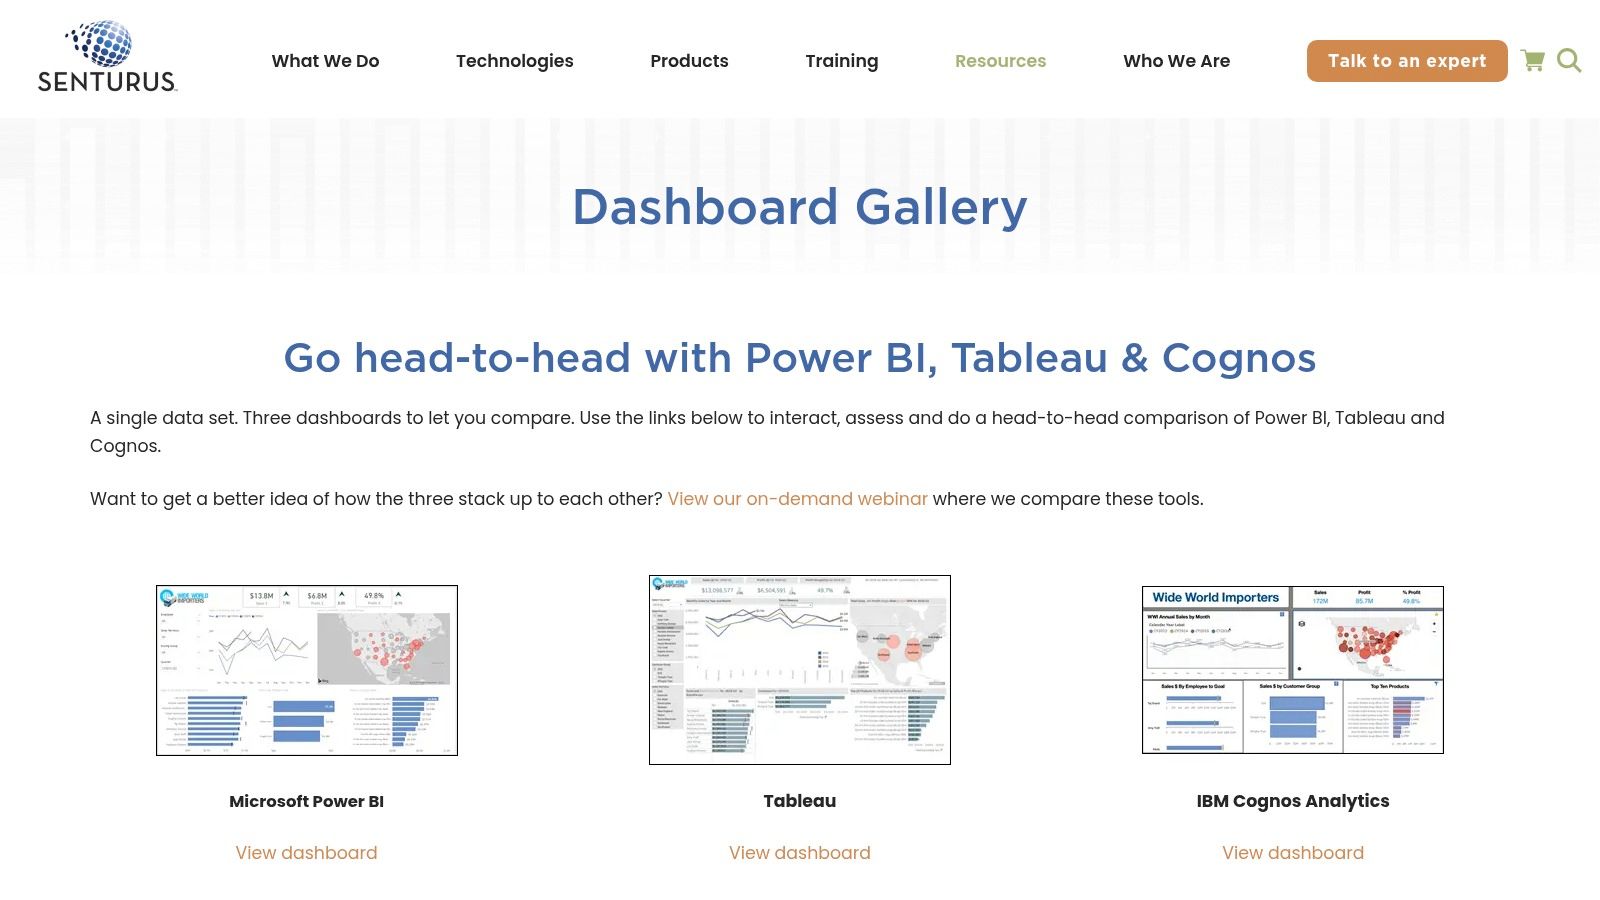
The gallery’s core value lies in its “try before you buy” philosophy for BI platforms. Instead of relying on marketing materials, leaders can interact with real-world dashboards for finance, sales, and operations. This hands-on experience demystifies the capabilities of each platform, showing how the same data can be visualized and analyzed differently, which is critical for choosing the right tool for your company’s specific needs and non-technical team members.
Strategic Analysis
Senturus’s strategy is to educate the market by providing a neutral ground for tool evaluation. By presenting dashboards side-by-side, they empower users to make informed decisions based on functionality, user interface, and analytical depth rather than just brand reputation. This is particularly valuable for organizations looking to standardize their analytics stack or migrate from one platform to another.
Key Insight: The choice of a BI tool has long-term implications for user adoption, training, and development costs. The Senturus gallery provides one of the best business intelligence dashboard examples of a comparative showcase, highlighting that the “best” tool is often subjective and depends entirely on a business’s specific use case and technical expertise.
This resource moves beyond static screenshots, offering a tangible feel for the interactive elements that define modern business intelligence, from drill-down filters to dynamic charts. For more tips on this topic, explore these guides on dashboard creation.
Actionable Takeaways
- Access: The gallery is completely free to access and interact with via the Senturus website. No registration or software installation is required.
- Best For: Business leaders, founders, and IT managers tasked with selecting a BI platform. It’s also a great resource for analysts seeking design inspiration across different technologies.
- Pro Tip: Use the gallery to test specific user stories. For example, have a non-technical sales manager try to find a key metric in the Tableau sales dashboard versus the Power BI version. Their feedback on ease of use can be more valuable than any feature list.
See how Vizule can help automate your reporting stack. We can help you implement and customize powerful Power BI dashboards tailored to your unique business needs. Book your free BI consultation today and let’s automate your reporting.
5. BI4Dynamics
For businesses operating within the Microsoft Dynamics ecosystem, BI4Dynamics offers a powerful, out-of-the-box analytics solution. It is less a single dashboard and more a comprehensive suite of over 150 pre-built, industry-standard dashboards and reports tailored specifically for Dynamics 365, AX, and NAV users. This platform is designed to dramatically accelerate BI implementation by eliminating the need for extensive custom development.
The core value of BI4Dynamics lies in its deep integration and domain expertise. Their Purchase Dashboard, for example, provides procurement teams with immediate, real-time visibility into the entire purchasing lifecycle. It visualizes critical data points like vendor performance, purchase order status, and stock levels, allowing for rapid analysis and decision-making directly from your ERP data.
Strategic Analysis
The specialization of BI4Dynamics is its key strategic advantage. By focusing exclusively on Microsoft Dynamics, they provide a solution that is not just compatible but natively fluent in the language of Dynamics data structures. This bypasses the complex and time-consuming data modeling phase that often stalls BI projects, delivering immediate value to finance, sales, and purchasing departments.
Key Insight: For many companies, the biggest BI challenge isn’t creating charts; it’s building a reliable data model from a complex ERP system. BI4Dynamics provides a pre-built data warehouse and Power BI analytics, making it one of the most effective business intelligence dashboard examples for organizations seeking a turn-key solution for their Dynamics data.
This targeted approach transforms a daunting BI initiative into a more manageable, plug-and-play implementation, allowing teams to focus on analysis rather than infrastructure.
Actionable Takeaways
- Access: The dashboards are available through BI4Dynamics licensing. They offer different tiers based on the scope of the implementation.
- Best For: Companies of any size that use Microsoft Dynamics as their central ERP and need to deploy a robust BI solution without a lengthy and expensive custom build.
- Pro Tip: While the pre-built dashboards are comprehensive, leverage them as a foundation. Work with your departmental heads to identify the most critical KPIs from the available reports and consolidate them into a high-level executive dashboard for at-a-glance performance tracking. You can learn more about revamping your reporting with Power BI to make the most of these powerful tools.
Connect with us to design your financial dashboard in Power BI. Vizule can help you implement and customize powerful Power BI dashboards tailored to your unique business needs. Book your free BI consultation today and let’s automate your reporting.
6. DataCamp
For those who want to move beyond simply viewing dashboards and learn how to build them, DataCamp offers a unique, education-first approach. It provides a curated gallery of Power BI dashboard examples across sales, finance, and marketing, but its true value lies in its pedagogical framework. DataCamp positions these examples not just as inspiration but as case studies within a broader learning path.
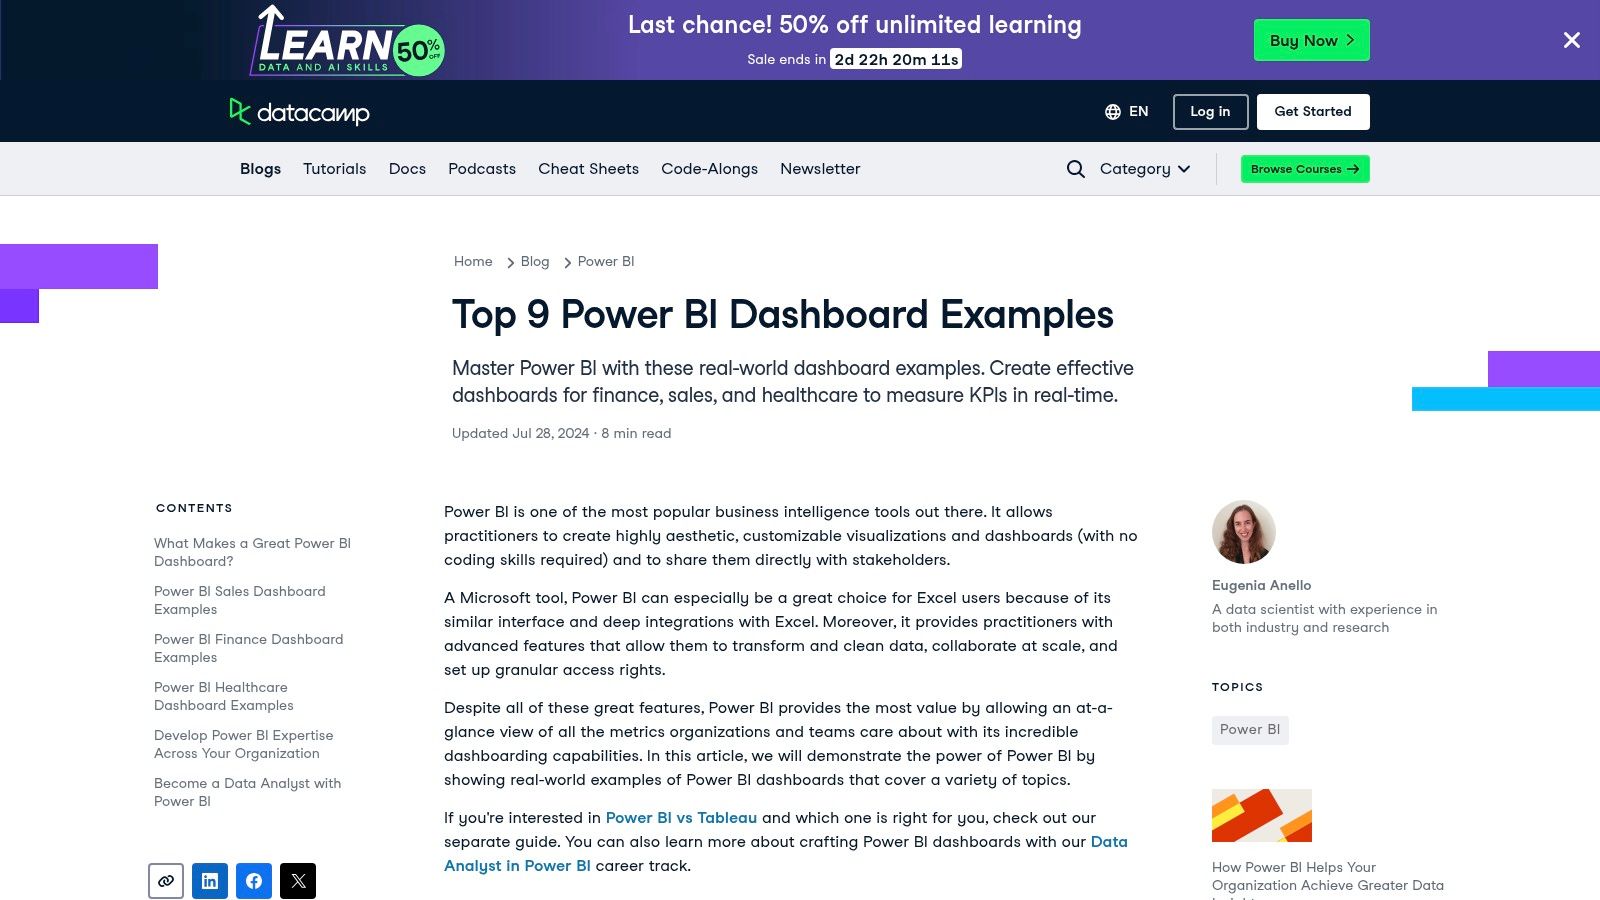
The platform bridges the gap between seeing a great dashboard and understanding the skills needed to create one. Each example is accompanied by detailed explanations of its components, design choices, and the specific Power BI functionalities used. This approach transforms a gallery into an interactive textbook, making it an ideal resource for aspiring data analysts, finance professionals, and business owners looking to upskill their teams.
Strategic Analysis
DataCamp’s strategy is to use compelling business intelligence dashboard examples as a gateway to its core educational products. By showcasing what’s possible in Power BI and then immediately providing the “how-to” through linked courses and tutorials, it creates a powerful user journey from inspiration to skill acquisition. This is fundamentally different from platforms that only provide templates.
Key Insight: The ability to replicate and customize a dashboard is more valuable than the template itself. DataCamp’s model empowers users with the underlying knowledge, ensuring they can adapt, troubleshoot, and create new reports long after they’ve used an initial example. This fosters true data literacy within an organization.
This educational layer is crucial for SMBs that lack dedicated BI teams. It enables existing employees in finance or marketing to become self-sufficient Power BI developers, building a sustainable, in-house analytics capability.
Actionable Takeaways
- Access: The blog post featuring the dashboard examples and their explanations is free. To dive deeper into the creation process, a DataCamp subscription is required.
- Best For: Individuals and teams who are not just looking for a quick fix but are committed to building long-term data skills. It’s perfect for finance managers, analysts, and business operators who want to learn how to build effective dashboards themselves.
- Pro Tip: Choose an example that closely mirrors a real business problem you’re facing. Follow the breakdown on the page, then attempt to recreate a simplified version of that dashboard using your own sample data. This hands-on practice is the fastest way to internalize the concepts and build practical Power BI skills.
Want to automate your reporting and finally trust your data? Vizule can help you implement and customize powerful Power BI dashboards tailored to your unique business needs. Book your free BI consultation today and let’s transform your Excel chaos into clarity.
7. InetSoft Technology
For organizations seeking inspiration from a broad, multi-industry perspective, InetSoft Technology’s gallery is a goldmine. It serves as a comprehensive showcase of what’s possible in the world of BI, featuring a diverse collection of interactive dashboard examples across sectors like finance, healthcare, government, and retail. This resource is designed to spark ideas and demonstrate the advanced capabilities of a dedicated BI platform.
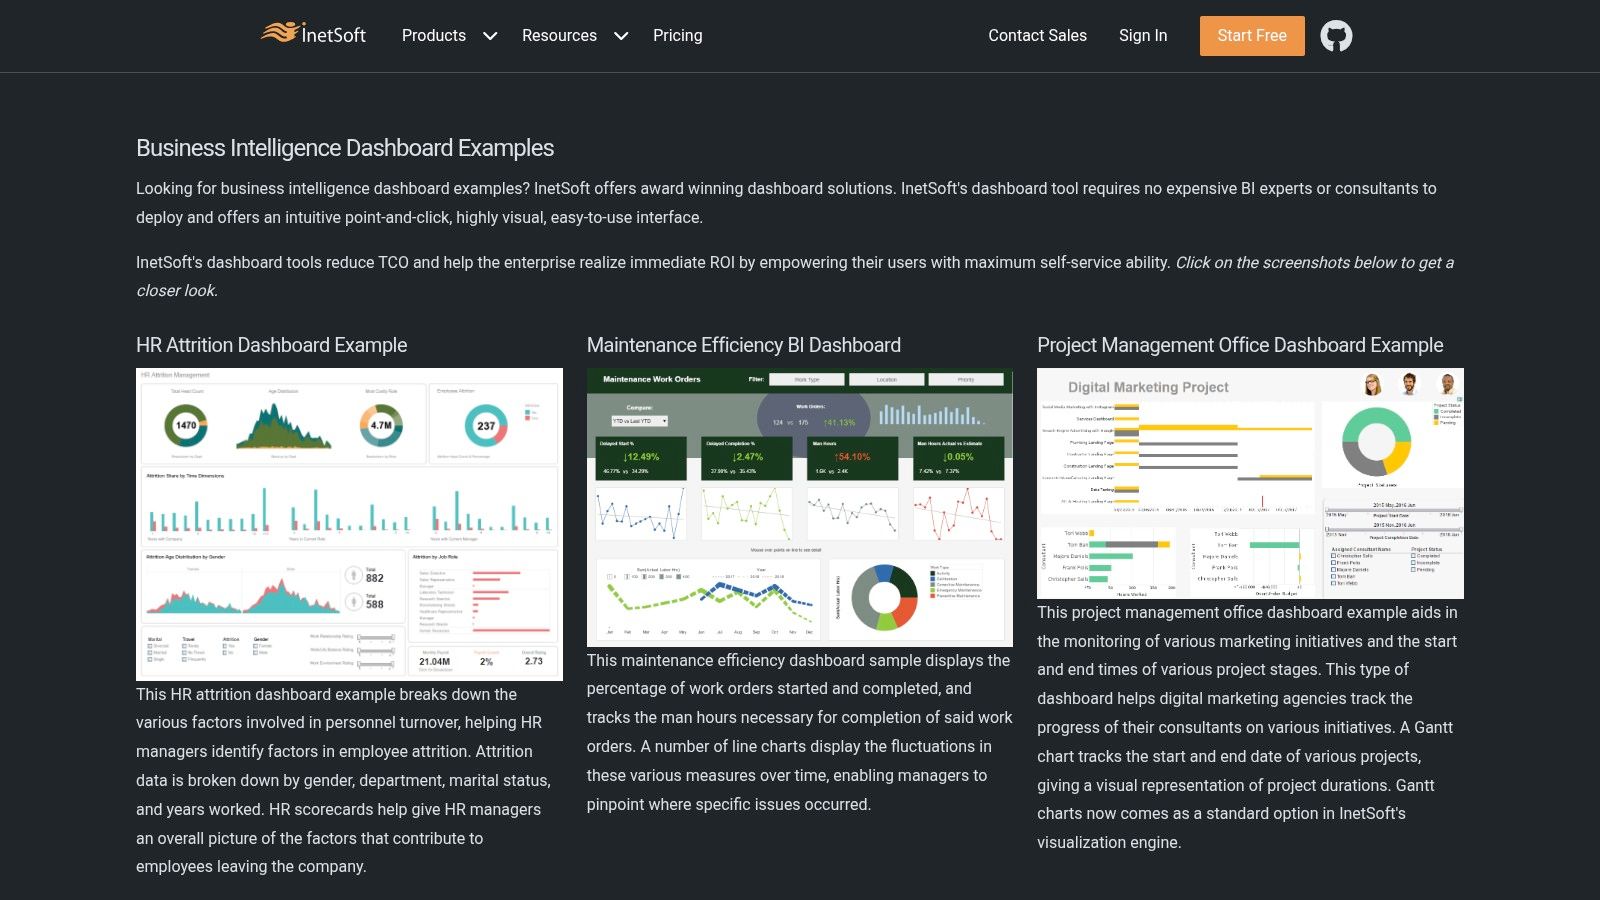
Unlike resources offering downloadable templates, InetSoft’s value lies in its role as a strategic lookbook. The dashboards are live, interactive demos built on their proprietary platform, allowing users to click, filter, and drill down into the data. This hands-on experience helps stakeholders visualize how complex datasets can be transformed into clear, navigable reports, making it an excellent educational tool before committing to a specific design or BI tool.
Strategic Analysis
InetSoft’s strategy is to lead with functionality and breadth, showcasing its platform’s power to serve virtually any industry. By presenting highly specific, polished examples—such as a “Claims and Policies Dashboard” for insurance or a “Physician Performance Dashboard” for healthcare—they appeal directly to the unique pain points of niche verticals. This approach positions them as industry experts, not just software providers.
Key Insight: Vertical-specific design is crucial. A generic sales dashboard won’t resonate with a hospital administrator. InetSoft proves that the most effective business intelligence dashboard examples are those tailored to the specific language, metrics, and workflows of their intended industry.
This gallery is a powerful tool for internal champions who need to build a business case for BI investment. They can present a tangible, interactive vision of the end-state to C-suite executives, making the abstract concept of “data-driven decisions” concrete.
Actionable Takeaways
- Access: The entire dashboard gallery on the InetSoft website is free to view and interact with. No registration is required.
- Best For: BI managers, department heads, and C-suite operators in specialized industries looking for design inspiration and a clear vision of what a sophisticated, tailored BI solution can look like.
- Pro Tip: Use the gallery for requirements gathering. Before building your own dashboard, have your team explore the relevant InetSoft example. Ask them what works, what doesn’t, and which KPIs from the demo are most critical for your own operations. This will significantly accelerate your design and development process.
See how Vizule can help automate your reporting stack. We can help you implement and customize powerful Power BI dashboards tailored to your unique business needs. Book your free BI consultation today and let’s automate your reporting.
Business Intelligence Dashboard Examples Comparison
| Solution | Implementation Complexity 🔄 | Resource Requirements ⚡ | Expected Outcomes 📊 | Ideal Use Cases 💡 | Key Advantages ⭐ |
|---|---|---|---|---|---|
| Business Intelligence | High – custom solutions needing alignment | Medium to High – strategy, training | Unified data, automated reporting, ML insights | Data-driven finance and analytics teams | End-to-end BI, rapid 30-day implementation |
| Coupler.io Blog | Low – plug-and-play templates | Low – uses automation tools | Quick BI dashboards | Rapid BI deployment with minimal expertise | Ready-to-use templates, ease of use |
| Sunflower Lab | Medium – customizable dashboards | Medium – requires development time | Real-time procurement insights | Procurement analytics and operations | Tailored procurement dashboards, ERP integration |
| Senturus Dashboard Gallery | Low – viewing and evaluation only | Low – no deployment needed | Tool comparison and design inspiration | BI tool selection, dashboard design ideas | Multi-platform examples, free access |
| BI4Dynamics | Low to Medium – pre-built but ERP-specific | Medium – requires Microsoft Dynamics | Real-time procurement and purchasing insights | Microsoft Dynamics ERP users | Extensive pre-built dashboards, quick deployment |
| DataCamp | Low – learning and exploration resource | Low – no implementation required | Educational insights and dashboard examples | Power BI learners and educators | Learning focus, detailed explanations |
| InetSoft Technology | Low – example browsing | Low – platform-specific showcase | Inspiration across industries | BI dashboard inspiration across industries | Industry-specific examples, advanced BI features |
Ready to Build Your Single Source of Truth?
Throughout this article, we’ve explored a diverse range of business intelligence dashboard examples, moving from practical templates to sophisticated, industry-specific showcases. Each example serves a critical purpose: to demonstrate that modern BI is not about creating prettier charts. It’s about building a dynamic, unified system that answers your most urgent business questions with clarity and speed.
The common thread weaving through these powerful dashboards is the principle of a ‘single source of truth.’ For small-to-medium businesses, founders, and operators, this concept is transformative. It marks the end of wrestling with conflicting Excel files, chasing down data from different departments, and making critical decisions based on outdated or incomplete information. With a single source of truth, you gain a real-time, holistic view of your company’s health by connecting finance and operations.
Key Takeaways for Your BI Strategy
As you move from inspiration to implementation, remember these core principles distilled from the examples we’ve analyzed:
- Start with Questions, Not Just Data: The most effective dashboards are designed to answer specific strategic questions. Before you build anything, define what you need to know: “What are our most profitable customer segments?” or “Which operational bottlenecks are impacting our cash flow?”
- Context is King: A metric without context is just a number. The best business intelligence dashboard examples provide context through trends, targets, and comparative analysis. This is what transforms data from your data warehouse into actionable insight, enabling you to understand the why behind the what.
- Design for Action, Not Just for Viewing: Your dashboard should be a command center, not a passive report. Use clear visual cues, interactive filters, and drill-down capabilities to empower users to explore data and uncover root causes on their own.
Your Next Steps: From Examples to Execution
Seeing these dashboards is one thing; building a system that delivers this level of insight for your own business is another. The journey from disconnected data silos to an automated, reliable BI engine requires a deliberate, strategic approach. It involves identifying the right key performance indicators (KPIs), transforming data from Excel to Power BI, and designing dashboards that align finance, operations, and sales.
This is where a strategic partner becomes invaluable. The challenge for most SMBs isn’t a lack of ambition; it’s a lack of time and specialised expertise to connect the dots. You need more than just software; you need a blueprint and an experienced guide to help you transition from the ‘Excel chaos’ holding you back.
By focusing on a well-designed BI system, you are not just automating reports. You are building a scalable foundation for a data-driven forecasting model, driver-based financial modelling, and confident, proactive decision-making that will fuel your company’s growth. The power of these business intelligence dashboard examples is within your reach.
Ready to stop managing spreadsheets and start driving your business with real-time insights? The experts at Vizule specialize in building end-to-end Power BI solutions that transform your scattered data into a single source of truth. Book your free, no-obligation BI consultation today and let’s design the financial and operational dashboards that will unlock your company’s full potential.
