


Are you tired of wrestling with clunky spreadsheets to understand your business performance? Financial analytics is the leap from static, manual reports to dynamic, automated dashboards that turn raw numbers from tools like QuickBooks and Stripe into genuine strategic insights. For small and medium-sized business owners, this isn’t just an upgrade—it’s a game-changer. It means swapping guesswork for confident, data-backed decisions that actually drive growth.
Why Your SMB Needs to Move Beyond Excel
If you’re a founder or operator, “financial reporting” probably brings one tool to mind: Excel. It’s the familiar workhorse, but let’s be honest, it often becomes a massive bottleneck. You’re stuck chasing down numbers from siloed spreadsheets, manually copy-pasting data, and constantly worrying that one broken formula could derail your entire month-end close.

This manual grind isn’t just a time sink; it’s a strategic liability. While you’re busy trying to reconcile data, your competitors are making faster, smarter moves. The real issue is that Excel was built for calculation, not for creating a “single source of truth” from all your disconnected systems.
To get a clearer picture of this shift, let’s compare the old way versus the new way.
Traditional Excel Reporting vs. Modern Financial Analytics
| Aspect | Traditional Excel Reporting (The Old Way) | Modern Financial Analytics (The Vizule Way) |
|---|---|---|
| Data Sources | Manual data entry from separate, siloed systems. | Automated connections to all your tools (QuickBooks, CRM, etc.). |
| Reporting Process | Time-consuming copy-pasting; highly prone to human error. | Fully automated, real-time dashboards and reports. |
| Data Integrity | Fragile. One broken formula can corrupt the entire sheet. | A “single source of truth” ensures everyone works with the same data. |
| Focus | Backward-looking; answers “what happened?” | Forward-looking; answers “what will happen?” and “why?” |
| Time Investment | 80% building reports, 20% analyzing them. | 20% building reports (once), 80% acting on insights. |
| Decision-Making | Based on outdated, historical data. | Proactive decisions based on live, up-to-the-minute information. |
This table highlights the core difference: moving from a reactive, manual chore to a proactive, strategic asset.
Shifting from Reactive to Proactive
The good news is that modern analytics in the finance industry provides a clear path forward. Business intelligence (BI) isn’t some overly complex tool reserved for massive corporations anymore. It’s a practical, accessible solution for SMBs looking to gain clarity and control over their financial and operational performance.
By connecting your scattered data sources into an automated system, you transform reporting from a painful chore into a powerful asset. Instead of just looking at what happened last month, you can start asking the questions that truly move the needle:
- Which of our customers are actually the most profitable when you factor in acquisition and support costs?
- How will a change in marketing spend impact our cash runway in three months?
- Where are the hidden operational inefficiencies quietly draining our budget?
Key Takeaway: The goal is to spend less time building reports and more time acting on the insights they provide. True financial analytics empowers you to steer your business with data, not just measure where it’s been.
This shift toward insight-led decision-making is catching on in a big way. The global demand for real-time financial insights has pushed the financial analytics market to an estimated USD 12.57 billion in 2024, and it’s projected to hit nearly USD 29.65 billion by 2033. You can read more about the financial analytics market growth and what’s driving it.
At Vizule, we specialize in helping founders make this exact transition. We help you move from the chaos of manual spreadsheets to a clear, automated reporting stack you can finally trust.
Want to automate your reporting and finally have confidence in your data? See how Vizule can help automate your reporting stack.
Getting to Grips With Your Financial Analytics System
Let’s pull back the curtain on what a financial analytics system is, without the dense, technical jargon. Think of it like building a custom home for your business data—a place where everything has a logical spot and all the parts work together seamlessly.
Many founders hear terms like “data warehouse” or “ETL” and feel out of their depth, but the concepts are surprisingly simple. The main goal is to get away from a messy pile of disconnected data points scattered across different apps and move toward one unified system that gives you straight answers.
This diagram breaks down the three core stages: pulling in raw data, cleaning it up so it’s usable, and then turning it into insights that help you make better decisions.
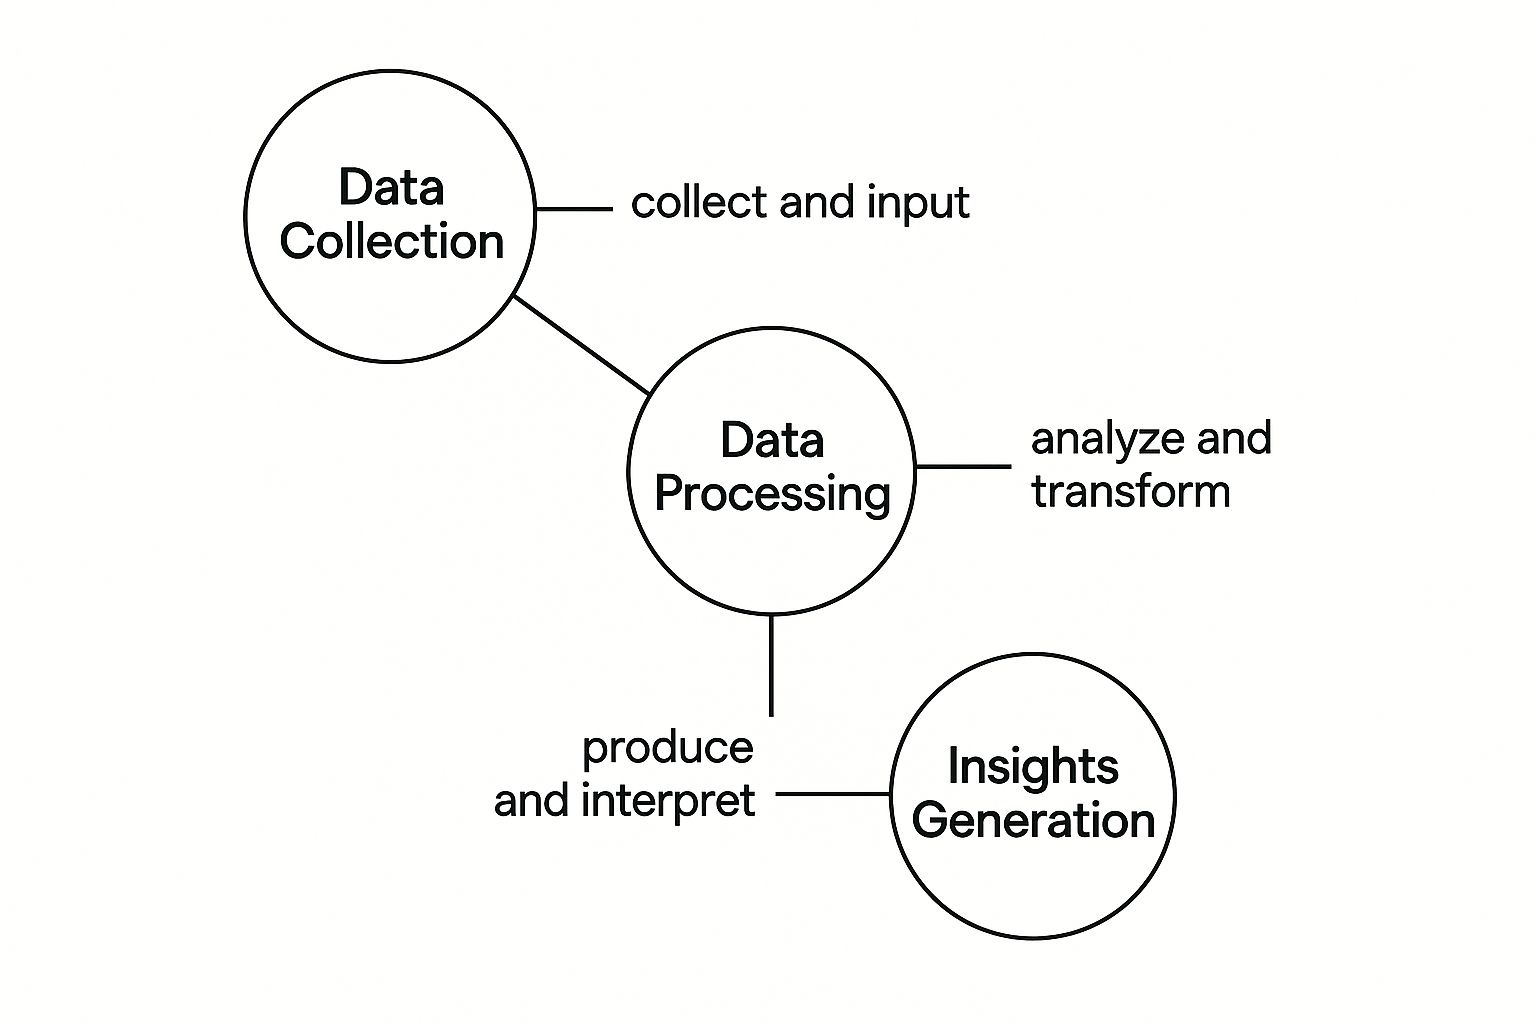
This flow shows that getting real value from your data is a process. It all starts with bringing your raw information together in one place.
The Foundation: Your Data Sources
Every solid house starts with a strong foundation. In analytics, your foundation is your collection of data sources. These are just the everyday applications where your business activity is recorded.
For most small to medium-sized businesses, this usually includes:
- Accounting Software: Tools like QuickBooks or Xero are the bedrock, holding all your core financial records from the P&L to the balance sheet.
- Customer Relationship Management (CRM): Systems like HubSpot or Salesforce track your sales pipeline, customer interactions, and potential revenue.
- Payment Processors: Services like Stripe or PayPal contain a goldmine of transaction-level data, detailing how and when money is coming in.
Right now, these probably feel like separate islands of information. The first step is building bridges to connect them.
The Framework: A Data Warehouse
With the foundation poured, you need a framework. This is what a data warehouse does. Think of it as a central hub designed specifically to store all the data from your different sources in a clean, organized way.
Instead of having one blueprint for your plumbing (QuickBooks) and another for your electrical (your CRM), the data warehouse creates a single master plan. This is how you start to see how sales activities directly impact revenue—a connection that’s almost impossible to spot when you’re wrestling with separate spreadsheets. This ability to blend financial and operational data is central to using analytics in the finance industry effectively.
The Wiring and Plumbing: The ETL Process
Now you need the systems that make everything work. This is where the ETL process comes in. It stands for Extract, Transform, and Load, and it’s the plumbing and wiring of your data house.
It’s an automated process that handles three crucial jobs:
- Extract: It pulls raw data from your sources (QuickBooks, CRM, etc.).
- Transform: It cleans, formats, and standardizes that data. This is where it fixes messy date formats, removes duplicates, or ensures customer names are consistent across systems.
- Load: Finally, it delivers this clean, ready-to-use data into your data warehouse.
That “transform” step is where the magic happens. It turns chaotic, inconsistent data into a reliable asset you can trust for your reports.
The Finished Rooms: Business Intelligence Tools
The final piece is the finished rooms where you can live and work with your data. Business intelligence (BI) tools like Power BI or Tableau are those rooms. They plug into your data warehouse and turn structured data into interactive dashboards, reports, and financial models you can actually use.
Instead of staring at a static spreadsheet, you get a dynamic view of your business that updates automatically. This allows you to spot trends and opportunities as they happen, not weeks later. If you’re looking to pick the right tools, a comprehensive business intelligence software comparison guide can be a huge help.
How Financial Analytics Actually Drives Profitability
Understanding the pieces is one thing, but seeing how they directly grow your bottom line is another. This is where theory hits the road. Modern analytics isn’t about tracking what happened last quarter; it’s about turning your financial data from a rearview mirror into a GPS for the future.

This isn’t an academic exercise. It’s about getting fast, accurate answers to the big questions that are nearly impossible to solve when you’re buried in spreadsheet chaos.
Move From Guesswork to Accurate Cash Flow Forecasting
For any business owner, cash is king. It’s the lifeblood of your operation. Yet, so many businesses still try to predict their cash flow by plugging numbers into a clunky spreadsheet. It’s stressful, time-consuming, and almost always wrong.
Financial analytics changes this game. By connecting your accounting software to your CRM and payment systems, you can build a living, breathing cash flow forecasting model.
This model automatically factors in:
- Projected Sales: It looks at your actual sales pipeline in the CRM to predict incoming revenue with far greater accuracy.
- Payment Timelines: It analyzes past invoice data to learn when customers actually pay, not just when the bill is due.
- Recurring Expenses: It keeps a running tab on all your fixed and variable costs, giving you a complete picture of your cash outflow.
Suddenly, anxious guesswork is replaced by a clear, data-backed projection of your runway. This empowers you to make critical decisions—like when to hire or secure a line of credit—from a position of strength, not panic.
Key Insight: Accurate forecasting doesn’t just reduce anxiety; it gives you the confidence to invest in growth, knowing you have the runway to support it. It turns cash management from a defensive chore into an offensive strategy.
Uncover True Customer and Product Profitability
A classic trap for growing businesses is focusing only on top-line revenue. That big-name client might pay a lot, but are they actually profitable? Once you add up the cost of sales, account management hours, and support tickets, the picture often looks radically different.
This is exactly the kind of problem analytics in the finance industry was built to solve. By blending financial data with operational data, you can see beyond surface-level metrics and calculate true profitability.
Imagine a founder who discovers their largest client, while paying a hefty subscription, is also generating 60% of their customer support tickets. A proper analytics dashboard would light this up, revealing that their mid-market clients are wildly more profitable. That single insight lets them refocus sales and marketing on the right segment, directly boosting margins.
Pinpoint and Eliminate Operational Inefficiencies
Every business has hidden cost leaks—small, seemingly minor expenses that add up over time and quietly drain your profit margins. Trying to find these by manually combing through spreadsheets is like looking for a needle in a haystack.
An automated analytics system connects the dots for you. It can link operational data—like project hours or software licenses—directly to your financial statements.
For example, a marketing agency might notice one type of project consistently goes over budget. A dashboard could visualize this by tracking estimated vs. actual hours logged for each project, making the problem impossible to ignore. That visibility allows managers to fix their quoting process, plugging a leak that was previously invisible. The financial analytics market is blowing up because businesses demand these kinds of predictive insights. To see how these ideas are put into action, review practical data analytics case studies.
Designing Dashboards People Will Actually Use
Getting a powerful analytics system running is only half the job. If the result is a cluttered, confusing dashboard that makes your team’s eyes glaze over, you’ve just swapped one problem for another. A dashboard is useless if nobody looks at it—or worse if it doesn’t inspire action.
Too many businesses fall into the “data dump” trap, creating a wall of charts and numbers that looks impressive but offers zero clarity. At Vizule, our philosophy is simple: the best dashboards prioritize insights, not just metrics. The goal isn’t to show numbers; it’s to tell a story about your business performance.
The real magic of analytics in the finance industry happens when you turn raw data into a clear narrative that shows you exactly what to do next. Take this example of a well-structured Power BI dashboard.
This visual immediately calls out crucial performance indicators like gross margin and EBITDA. It’s designed for a leader to get a quick pulse on the company’s financial health in seconds. Quick consumption and immediate understanding—that’s the mark of an effective dashboard.
Create the CEO’s Five-Minute View
Founders and operators are stretched thin. You don’t have time to wade through dozens of reports to figure out what matters. That’s where the “CEO’s Five-Minute View” comes in—a high-level summary designed to give you the most critical information at a glance.
This top-level view needs to answer three questions instantly:
- Are we winning or losing? Key performance indicators (KPIs) like Gross Margin or Net Profit should be displayed clearly against targets.
- How do we know? This layer provides context, showing trends over time or comparing performance to the budget.
- What should we do about it? The dashboard should make the next question obvious, pointing you toward areas that need attention.
Think of this summary as your command center. It gives you the big picture in moments and acts as a gateway for digging deeper.
The ultimate test of a great dashboard is simple: Can a leader look at it for less than five minutes and walk away knowing where the business stands and which questions to ask their team? It should be a conversation starter, not a data puzzle.
Drill Down into Departmental KPIs
A great dashboard never stops at the summary. It’s built to be interactive, letting users move seamlessly from the big picture to the nitty-gritty details. If the CEO’s view shows that Gross Margin is down, the next logical step is to find out why.
This is where the ability to click into departmental KPIs becomes invaluable. From the main dashboard, your Head of Sales should be able to click on “Revenue” and immediately see a breakdown by salesperson. Likewise, your Head of Operations should be able to explore the cost of goods sold (COGS) to see if a particular product line is driving up expenses.
This layered approach is powerful for two reasons:
- Empowerment: It gives departmental leaders the data they need to own their numbers and make smart decisions without requesting another report from finance.
- Accountability: It creates a crystal-clear line of sight from top-line company goals down to the individual team metrics that drive them.
When reports are designed this way, you create a single source of truth that serves everyone from the C-suite to team leads, ensuring everyone is pulling in the same direction.
Ready to stop building reports that get ignored? Connect with us to design your financial dashboard in Power BI and create a tool your team will actually want to use.
Overcoming Common Financial Analytics Hurdles
Embarking on a data journey is exciting, but it’s not always a smooth ride. For many founders, implementing a new system brings up some real concerns. The good news? These hurdles are well-known and completely solvable with the right game plan.

This isn’t about pretending difficulties don’t exist. It’s about having a guide in your corner to help you anticipate and solve problems before they slow you down.
Wrestling with Messy Data
The single most common fear we hear is, “Our data is a complete mess.” Trust us, you are not alone. Years of inconsistent data entry, duplicate records, and information scattered across a dozen platforms can make your data feel totally unreliable. This is what the industry calls ‘dirty data,’ and it’s the number one killer of trustworthy reporting.
The solution isn’t to throw your hands up; it’s to implement a rock-solid data transformation process. This is the crucial “T” in the ETL (Extract, Transform, Load) process. Think of it as a set of automated rules that cleans and standardizes your raw information before it ever hits a dashboard.
- Standardising Categories: Making sure “USA,” “U.S.A.,” and “United States” are all treated as the same country.
- Fixing Formats: Correcting date entries so
01/05/2024andMay 1, 2024are understood as the same day. - Removing Duplicates: Getting rid of redundant customer entries that throw your analytics off.
This process brings order to the chaos and builds a reliable foundation for all your analytics in the finance industry. For a deeper dive, check out our guide on financial modeling best practices.
Managing Team Resistance and Adoption
Introducing a new reporting tool can sometimes be met with resistance. Your team is comfortable with their existing workflows, and change can feel disruptive. “The old way works fine,” is a common refrain, even if that “old way” involves hours of manual work.
The key to getting past this isn’t a top-down mandate; it’s a strategic, phased rollout. Start with a single, high-impact project that solves a very specific, annoying pain point for one team.
Our Approach: We often kick things off by automating the most time-consuming report—like a weekly sales summary. When the team sees a task that used to take them five hours now takes five seconds, you don’t just get buy-in. You get enthusiastic advocates who pull the rest of the organization along with them.
Concerns About Cost and ROI
Finally, let’s talk about the investment. For any SMB, every penny counts. The cost of implementing a full business intelligence system can seem daunting, with the big fear being a large upfront investment and a slow, uncertain return.
This is why a phased, iterative approach is so critical. You don’t need to build the entire system at once. Instead, we map out a roadmap that delivers tangible value at every stage.
The journey starts with a small, defined project that delivers a clear win and a measurable ROI. That initial success then funds the next phase. This method de-risks the entire investment, turning it into a manageable operational expense rather than a massive capital outlay.
Your Roadmap to a Data-Driven Finance Function
Transforming your financial reporting from a manual chore into a strategic asset can feel daunting. But it doesn’t have to be a massive, multi-year project. With the right game plan, you can move from the chaos of spreadsheets to real clarity in a structured and manageable way. Our approach is built to get you quick wins, making the first step feel both easy and powerful.
Step 1: The Discovery Call
It all starts with a simple conversation. Think of the discovery call as a no-strings-attached meeting where we listen. We want to understand your unique business pains and what you’re trying to achieve. We’ll dig into where your data lives, pinpoint which manual reports are eating up your team’s time, and figure out the critical business questions you can’t seem to answer right now.
Step 2: Strategy and Design
Next, we roll up our sleeves. This is where we map out all your data sources—from QuickBooks to your CRM—and design a custom reporting solution that fits you like a glove. We’ll architect a single source of truth and create mockups of the dashboards you’ll be using day-to-day. For a deeper dive into this crucial planning stage, check out our guide on building a successful data analytics strategy.
Step 3: Implementation and Empowerment
Finally, we build it and make sure your team knows exactly how to use it. This phase involves setting up the data pipelines, building the interactive Power BI dashboards, and providing hands-on training so everyone feels confident. Our goal isn’t just to hand over a tool; it’s to ensure it gets fully adopted and becomes a core part of your decision-making rhythm.
For more perspectives on building a data-driven finance function, the Fundpilot Blog is an excellent resource.
It’s time to stop guessing and start leading with insight.
Ready to start your journey? Book your free BI consultation to see how Vizule can help automate your reporting stack.
A Few Lingering Questions on Financial Analytics
Diving into the world of analytics in the finance industry usually brings up a few last-minute questions. It’s a big step for any company, and it’s smart to get clarity before jumping in. Here are straightforward answers to the questions we hear most often from founders and operators.
Is Power BI Too Complex for My Small Business?
This is a common concern. Power BI is an incredibly powerful tool, which can make it seem intimidating. But the secret isn’t mastering every feature—it’s about building a solution that’s right-sized for your business.
Our approach at Vizule is to create simple, focused dashboards that are intuitive for people who aren’t data scientists. We concentrate on surfacing the exact insights you need to make decisions, not on overwhelming you with complex features you’ll never touch. Think of it as getting a custom-built race car engine versus a generic one with a thousand confusing dials.
Our Philosophy: A dashboard’s success is measured by its adoption. If your team can’t use it easily, it has failed. We design for clarity and action, ensuring your reports are tools for decision-making, not data puzzles.
How Long Does It Take to See Results?
Many business owners worry that a financial analytics project will be a long, drawn-out process. Thankfully, that’s not how modern BI projects work anymore. You do not have to wait months or years to see real value.
We believe in a phased approach that delivers quick wins. Our process starts by identifying and automating your most painful, high-impact reports first. This means you can often have a live, automated dashboard—like a weekly sales tracker or cash flow summary—up and running in just a few weeks. This provides immediate relief and tangible insights while we build out the more comprehensive solution.
What Is the Difference Between a BI Consultant and a Data Analyst?
This is an important distinction. While both roles work with data, they serve very different functions:
- A Data Analyst is typically an employee who runs reports, cleans data, and answers specific questions from inside the business. While valuable, this can create a “key person dependency,” where your entire reporting function relies on one individual.
- A BI Consultant acts as a strategic partner. We bring a breadth of experience from hundreds of projects to design and implement a complete, sustainable, and automated system. Our job is to build a robust data infrastructure that empowers your whole team, eliminating bottlenecks and creating a lasting asset for the business.
Essentially, a consultant builds the system; an analyst works within it. For SMBs looking to scale, building the right system first is the key to long-term success.
Tired of chasing numbers and ready for a single source of truth? The team at Vizule Ltd is here to help you connect the dots in your data and build an automated reporting engine that drives growth.
Book your free BI consultation today and see how we can transform your financial reporting from a chore into a strategic advantage.


