


A data analysis strategy isn't just about fancy dashboards or endless reports. For small-to-medium business (SMB) owners, it’s the game plan for how your business will collect, manage, and actually use its data to answer your most important questions. Think of it as a blueprint that turns a messy pile of spreadsheets and disconnected software into a clear path for growth.
Moving From Data Chaos to Strategic Clarity
Are you running your business on gut feelings and a patchwork of Excel files? For many founders and operators, this feeling of "data chaos" is frustratingly normal—and it’s a huge roadblock to scaling. It’s like trying to build a complex piece of furniture with blurry instructions; you waste time, get frustrated, and the final product is never quite right.
If you're constantly battling manual reports, getting conflicting numbers from different teams, and dealing with siloed information, that's a sure sign you've outgrown your current setup. A formal data analysis strategy isn't some luxury reserved for massive corporations; it's the essential framework you need to scale smartly and align your finance and operations teams.

Why a Unified Data Layer Is Your Map to Growth
At the heart of any great strategy is a unified data layer. Imagine this as the ultimate map for your business, connecting all the separate islands—your CRM, accounting software, and operational platforms—into one reliable, cohesive picture. This instantly solves that nagging problem where the sales team and the finance team pull completely different numbers for the exact same metric.
Instead of your team wasting hours every week exporting CSVs and fighting with VLOOKUP formulas, a unified system automates the whole process. This is the foundation for creating what we call a single source of truth for your data. It’s a simple but powerful concept: everyone, from finance to marketing to operations, is working from the same trusted set of numbers.
This shift takes you from the daily grind of manual reporting to a future of clear, automated insights. We know the frustration is real, but the path forward is achievable. A crucial first step in this journey is learning how to improve data quality right from the start.
A well-defined data strategy does more than just clean up spreadsheets. It empowers you to answer forward-looking questions like, "Which customer segments are most profitable?" or "What's our true cash flow forecast for the next quarter?"
With a clear strategy, you can finally stop just reporting on what happened and start making confident, data-backed decisions about what to do next. If that's the kind of clarity you're looking for, Vizule can help you build that map.
Ready to automate your reporting and finally trust your data? Book your free BI consultation and let's discuss your path from chaos to clarity.
What a Data Analysis Strategy Actually Looks Like
Let's cut through the jargon. What is a "data analysis strategy," really? For a founder or SMB operator, it’s a repeatable plan for turning raw information into your most valuable asset. It has less to do with complex algorithms and more to do with creating a reliable system for answering your most critical business questions.
Think of it like a diagnostic system for your business's health. A doctor uses specific tools and tests to check a patient's vitals, right? Your strategy is the framework that does the same thing, connecting data from your CRM, accounting software, and operational tools to diagnose performance, spot hidden opportunities, and accurately forecast what’s coming next.
This isn't just a "nice-to-have" exercise; it's a direct response to a massive shift in how business is done. The global data analytics market is on a tear, projected to explode from USD 64.75 billion in 2025 to a staggering USD 785.62 billion by 2035. That kind of growth signals one thing: businesses are aggressively using data to win. You can see the full breakdown in this market analysis from Precedence Research.
The Core Components of a Practical Strategy
A strong data analysis strategy for an SMB isn't some hundred-page document destined to collect dust. It’s a simple, clear blueprint built on a few essential pillars. These components work together to solve real-world problems, like finally ending the debate when finance and sales pull conflicting revenue numbers.
A well-built plan nails these four areas:
-
Identifying the Right Data Sources: This is about being surgical. Where do the answers to your most pressing questions live? Instead of trying to boil the ocean, you focus on the vital few. That usually means your accounting software (think Xero or QuickBooks), your CRM (like HubSpot or Salesforce), and any key operational platforms you rely on.
-
Establishing Simple Data Governance: "Governance" sounds corporate and stuffy, but for you, it just means setting a few ground rules so everyone trusts the numbers. It’s about ensuring that when one person pulls a sales report, it perfectly matches the one pulled by someone else. This creates a single source of truth.
-
Choosing Smart Automation and Tooling: This is your ticket out of spreadsheet chaos. Tools like Microsoft Power BI aren't just for making pretty charts; they are powerful engines that can automate the entire grind of collecting, cleaning, and reporting on data. We’re talking about saving your team dozens of hours every single month.
-
Defining KPIs That Actually Matter: Your strategy must lock in the key performance indicators (KPIs) that truly measure the health and progress of your business. This is about moving past vanity metrics and focusing laser-like on what drives revenue, profitability, and operational efficiency.
A classic mistake is getting bogged down trying to build a complex data warehouse from day one. A much smarter move is to start small with a high-impact goal—like building a reliable cash flow forecasting model—and designing your initial strategy around that single objective.
When you connect these pieces, you create a system that doesn't just report on what happened last month. It actively guides your future decisions. That's the real difference between just having data and having a strategy.
To go a level deeper on these foundational ideas, check out our guide on what a data strategy is and how it sets your business up for success. A clear plan ensures your efforts are focused, your insights are solid, and your decisions are genuinely data-driven.
The Four Pillars of a Winning Data Strategy
A solid data analysis strategy isn’t some abstract idea; it’s a hands-on framework built on four real-world pillars. For business owners tired of wrestling with conflicting reports and soul-crushing manual data pulls, getting these pillars right is the key to finally achieving clarity and driving growth.
Think of it like building a house. Get these four supports right, and everything you build on top will be stable, reliable, and ready for whatever comes next.
Pillar 1: Unified Data Sources
First thing's first: you have to unify your data sources. Most businesses are swimming in data, but it’s trapped in different pools. Your accounting numbers are in Xero, customer info is over in HubSpot, and your operational data is stuck in a separate inventory platform.
This is the very definition of "data chaos." It’s why your teams show up to meetings with different numbers for the same metric, sparking endless debates and eroding trust. The goal here is to knock down those walls.
By connecting these separate systems, you create a single, cohesive view of your business. This doesn’t mean you need a massive, expensive data warehouse. It’s about strategically linking the platforms that hold the answers to your most important financial and operational questions. Once your data is unified, you can finally ask—and answer—the tough questions, like, "What's the real lifetime value of customers from our last marketing campaign?"
Pillar 2: Simple Data Governance
Once your data sources are talking to each other, the next step is data governance. Don't let the corporate jargon scare you. For an SMB, it boils down to one simple idea: creating a single source of truth that everyone in the company actually trusts.
It’s about setting clear, simple rules for how your data is defined, managed, and used. You decide on one universal definition for "Active Customer" or "Gross Margin" so that sales, finance, and ops are all singing from the same hymn sheet. This completely eliminates those frustrating meetings where three different departments present three different revenue numbers.
A frequently overlooked part of this is implementing strong data governance best practices. This is what ensures the consistency and accuracy you need to build confidence in your reporting. Without that trust, even the slickest dashboards will just gather digital dust.
Simple governance isn’t about creating bureaucracy; it’s about creating clarity. When your team knows they can rely on the data, they can stop arguing about the numbers and start making decisions with them.
Pillar 3: Smart Automation and Tooling
With unified data and clear rules in place, the third pillar is all about smart automation and the right tools. This is where you officially graduate from the manual grind of Excel. Spreadsheets are familiar, sure, but they’re also incredibly time-consuming and a minefield for errors when it comes to modern reporting.
Modern business intelligence (BI) platforms like Microsoft Power BI are an absolute game-changer here. They act as the engine that automates your entire reporting pipeline from start to finish.
What does that look like in practice?
- No More Manual Exports: Data from your core systems refreshes automatically, so your reports are always current. No more nagging people for the latest CSV file.
- Time Back in Your Day: All those hours your team spends copying and pasting data can now be channeled into high-value analysis and strategic thinking.
- Dynamic, Living Insights: Instead of static, dead-on-arrival reports, you get interactive dashboards. You can drill down into the data, filter by different segments, and spot trends as they happen.
This pillar is about swapping tedious labour for an efficient, automated system that works for you 24/7.
Pillar 4: Meaningful KPIs and Metrics
The final pillar ties it all together: focusing on KPIs and metrics that actually mean something. A powerful data setup is useless if it’s just measuring noise. It’s far too easy to get lost in a sea of vanity metrics—like website visits or social media likes—that have no direct connection to your bottom line.
A winning data strategy forces you to be disciplined. You need to select the handful of core metrics that truly reflect the health and progress of your business. These are the numbers that connect your daily operations directly to your financial results.
For an SMB, meaningful KPIs might include:
- Customer Acquisition Cost (CAC): Exactly how much does it cost you to land a new customer?
- Lifetime Value (LTV): What is the total revenue you can expect from a customer over their entire relationship with you?
- Cash Conversion Cycle: How many days does it take to turn your investments in inventory back into cash in the bank?
- Gross Margin by Product/Service: Which of your offerings are actually making you money?
By homing in on these vital signs, you ensure your entire data engine is geared toward one thing: delivering actionable insights that help you make smarter, more profitable decisions.
Are these four pillars feeling like the solution you've been looking for? See how Vizule can help automate your reporting stack and build a strategy that works.
Your 90-Day Roadmap from Spreadsheets to Insights
Building a winning data analysis strategy isn't an overnight job, but it also doesn't need to be a multi-year IT saga. For a growing business, the jump from scattered spreadsheets to automated insights is completely achievable with a focused, phased approach.
This 90-day roadmap is all about delivering real value, fast. It’s designed to make the whole process feel manageable while building momentum every step of the way. Think of it like a three-stage rocket launch—each stage has a clear purpose and pushes you closer to the ultimate goal: making confident, data-backed decisions.
The visual below shows how the core pillars—Sources, Governance, Tools, and KPIs—fit together to form a cohesive strategy.
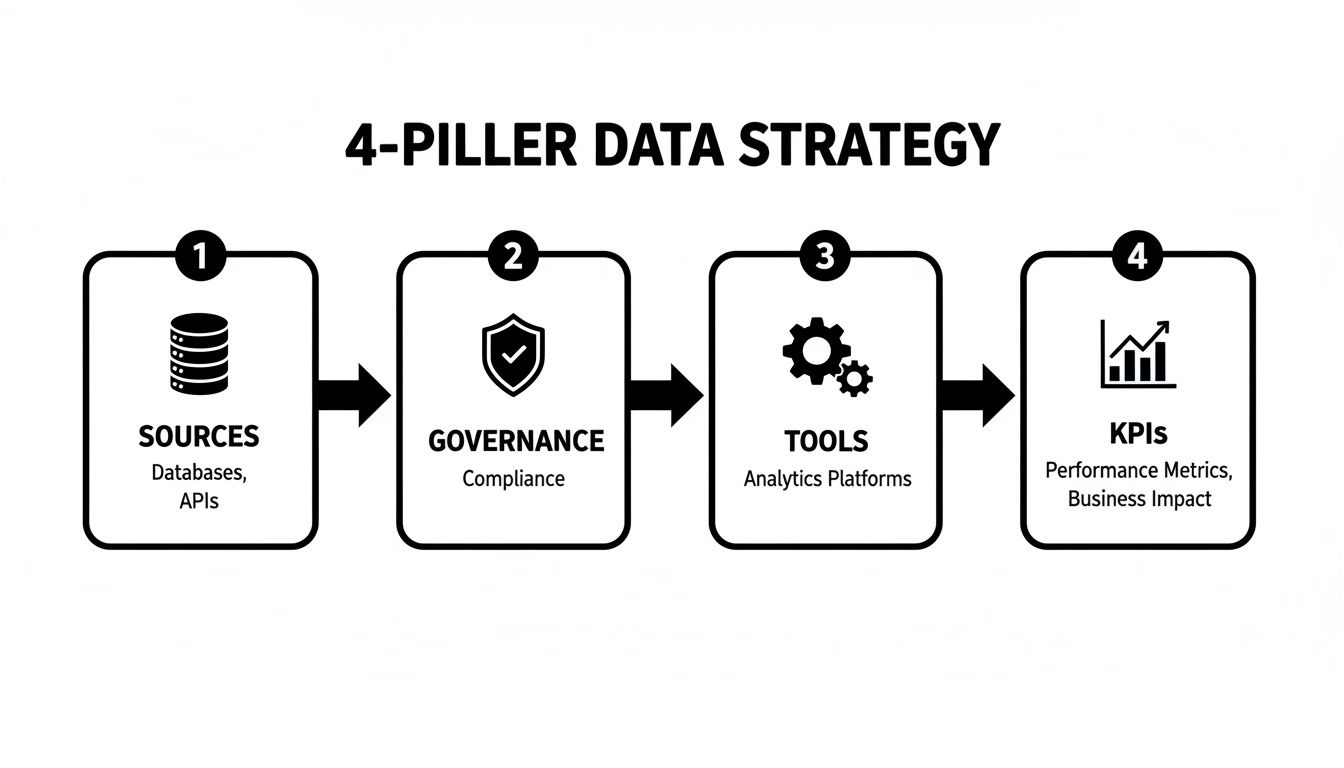
This structured process is your guide for turning raw, messy data into clear, actionable business intelligence.
Phase 1: The Map (Days 1–30)
The first month is all about diagnosis and direction. Before you touch a single piece of technology, you need a clear map of where you are and, more importantly, where you want to go. The goal here isn't to solve everything at once but to zero in on the biggest pain points holding your business back.
We start by hunting down your biggest reporting headaches. Is it that weekly sales report that takes someone eight hours to pull together? Or maybe the cash flow forecast that’s always out of date by the time you see it? By focusing on a high-impact problem first, we guarantee the project delivers immediate relief.
Next, we pinpoint the critical data sources needed to solve that specific problem. This usually means connecting just two or three core systems, like:
- Your accounting software (think Xero or QuickBooks)
- Your CRM (like HubSpot or Salesforce)
- An operational platform (such as your inventory management system)
The final, and most crucial, step in this phase is defining 3-5 core business questions you absolutely need answers to. These aren't technical queries; they are strategic. For instance: "Which of our products has the highest true gross margin?" or "What's our customer acquisition cost by marketing channel?"
By the end of day 30, you won't have a dashboard. You'll have something far more valuable: a focused blueprint that guides the rest of the project. For a deeper look, check out our complete data strategy roadmap.
Phase 2: The Model (Days 31–60)
With a solid blueprint in hand, the second month is all about building the engine. This is where we connect the dots—or rather, the data sources from Phase 1—and start bringing your information to life. Our go-to tool for this is Microsoft Power BI, a powerhouse for business intelligence and automation.
The heart of this phase is creating a central data model. It sounds technical, but the concept is simple. Imagine taking Lego pieces from different kits and assembling them into one cohesive structure. We pull data from your separate systems and build relationships between them, so your sales data can finally "talk" to your finance data.
Once the model is solid, we build the first version of your core KPI dashboard. This initial dashboard is intentionally lean, displaying only the metrics needed to answer the business questions we defined back in Phase 1. You'll see your most important numbers, updated automatically, in one clean, interactive view.
This is often the big "aha!" moment for business owners. For the first time, they see their data unified and visualized, transforming static numbers into a dynamic story about their company's performance.
Phase 3: The Mobilise (Days 61–90)
The final 30 days are all about adoption and empowerment. A brilliant dashboard is useless if your team doesn't understand it, trust it, or use it to make decisions. The "Mobilise" phase ensures your new data capabilities become a living, breathing part of your company's operations.
We start by rolling out the dashboards to key team members. This involves simple, practical training sessions focused not on the technology, but on how to use the insights to do their jobs better. The goal is to make the dashboard a daily go-to resource, not some complex tool they're afraid to touch.
We actively gather feedback during this time. What’s working? What’s confusing? This iterative loop lets us fine-tune the dashboards, making them even more intuitive and valuable. This user-first approach is absolutely critical for long-term success.
By day 90, the transformation is complete. You’ve moved from chaotic, manual reporting to an automated, trusted system that delivers insights on demand. Your team is now equipped to make smarter decisions, and you have a scalable foundation to build on as your business grows.
Here’s a quick summary of how that 90-day journey breaks down.
Your 90-Day Data Strategy Implementation Plan
This phased plan is your guide to moving from guesswork to a fully mobilized business intelligence system in just one quarter.
| Phase | Timeline | Key Activities | Primary Outcome |
|---|---|---|---|
| 1: The Map | Days 1–30 | Identify key business pain points, map critical data sources, define 3–5 core business questions. | A focused, strategic blueprint for the entire project. |
| 2: The Model | Days 31–60 | Connect data sources, build a central data model in Power BI, create the V1 KPI dashboard. | A functional, automated dashboard answering your core questions. |
| 3: The Mobilise | Days 61–90 | Roll out dashboards to the team, conduct user training, gather feedback, and refine the visuals. | A fully adopted BI system embedded in daily operations. |
This roadmap provides a clear path to building a data-driven culture without the overwhelming complexity that derails so many projects.
Ready to start your 90-day journey from spreadsheets to strategic insights? Book a free consultation with a Vizule BI expert today and let's build your roadmap.
Common Pitfalls That Derail Data Initiatives
A solid data analysis strategy is an incredible engine for growth, but even the best plans can get derailed by surprisingly common, and totally avoidable, mistakes. Knowing where these traps are is the first step to sidestepping them. For business owners, being aware of these pitfalls is often the difference between a project that delivers game-changing clarity and one that just… fades away.
We've seen it firsthand. Many data projects stumble right out of the gate, but yours doesn't have to. Here’s what we’ve learned about what works—and what definitely doesn't—when building data capabilities from the ground up.

Pitfall 1: Trying to Analyze Everything at Once
When a business finally commits to getting serious about data, the first instinct is often to "boil the ocean." They want to connect every app, track every metric, and build a dashboard for every single department, all at once.
This approach is a recipe for analysis paralysis. The project becomes so massive and complex that it never gains any real momentum and, in the end, fails to deliver any tangible value.
The solution feels counterintuitive: start small to win big.
Instead of a sprawling, all-encompassing project, zero in on solving one high-impact business problem first. What's your most painful reporting bottleneck? Your most urgent strategic question? Maybe it's getting a reliable cash flow forecast or finally understanding true customer profitability. By laser-focusing your initial efforts, you can score a quick, meaningful win that builds the confidence and momentum you need for everything that comes next.
Pitfall 2: Choosing Tools Before Strategy
Another classic misstep is falling in love with a flashy new software tool before you’ve clearly defined what you actually need it to do. A founder sees a slick dashboard at a conference and decides, "We need that," without first asking, "What business questions are we trying to answer?" This puts the cart miles ahead of the horse.
Technology is a powerful enabler, but it's never the starting point.
Your strategy must always be driven by your business needs, not by software features. Before you ever look at a Power BI demo, you must have crystal-clear answers to questions like, "What are the top five KPIs that determine our success?" and "What decisions will this data help us make each week?"
Defining these requirements first ensures you pick a tool that serves your strategy, not the other way around. It’s a simple shift in sequencing that makes all the difference.
Pitfall 3: Ignoring How Your Team Will Use It
You can build the most powerful, insightful, and beautifully designed dashboard in the world, but if your team doesn't use it, it’s worthless. It's a hard truth. Many data initiatives fail not because of a technical flaw, but a human one—they're designed in a vacuum without considering the end-user's workflow, technical comfort, or daily habits.
User adoption isn't an afterthought; it's a core design principle. To make sure your dashboards become a real part of your company's operating rhythm, you have to:
- Involve End-Users Early: Get feedback from the people who will actually be using the reports from day one.
- Prioritise Simplicity: Build dashboards that are clean, intuitive, and answer questions at a glance. Avoid clutter and complexity like the plague.
- Make Training Practical: Focus training not on the tool's features, but on how to use the insights to make better decisions in their specific roles.
Pitfall 4: The 'Set It and Forget It' Mindset
Finally, a data analysis strategy is not a one-time project you finish and shelve. Your business is constantly evolving—new products launch, market dynamics shift, and your strategic goals change. Your data strategy has to be a living, breathing process that adapts right alongside it.
The "set it and forget it" approach leads directly to stale dashboards and irrelevant metrics. A successful strategy requires a commitment to continuous improvement. This means regularly reviewing your KPIs, gathering feedback, and asking, "Is our data still helping us answer our most important questions?" Without this ongoing maintenance, even a perfect initial setup will lose its value over time. Part of this living strategy is recognizing that ensuring high data integrity is a continuous process—it's essential to understand how to improve data quality on an ongoing basis.
By avoiding these four pitfalls, you can build a data foundation that not only works on day one but keeps delivering value for years to come.
Ready to Build Your Data-Driven Future?
Moving from data chaos to strategic clarity is a huge step for any growing business. A solid data analysis strategy isn't about forcing everyone to become a data scientist overnight. It’s much simpler than that.
The real goal is to get the right information to the right people at the right time. When you nail that, you start making smarter, faster decisions across the board. This is how you unlock scalable growth, get your teams on the same page, and move forward with genuine confidence.
From Insight to Action
A well-built strategy turns those abstract numbers in your spreadsheets into your most valuable asset. It breaks the painful cycle of wrestling with messy data and frees up your team to focus on high-impact work, not manual data entry.
Ultimately, you're creating a repeatable system that delivers clear, automated insights you can actually trust. This kind of system empowers you to:
- Align Finance and Operations: No more frustrating debates over conflicting reports. Everyone finally works from the same trusted numbers.
- Gain True Performance Visibility: Go beyond surface-level metrics to understand what really drives profitability and growth in your business.
- Scale with Confidence: Build a data foundation that grows right alongside your business, ready to tackle new challenges and opportunities.
The leap from reactive reporting to proactive decision-making is the single most powerful change a business can make. It’s the difference between navigating with a compass versus driving with your eyes glued to the rearview mirror.
If you're ready to stop guessing and start using data to drive your business forward, it's time for the next step. Building your strategy doesn't have to be a complex, multi-year project. With a clear roadmap, you can see meaningful results in just a few months.
Want to automate your reporting and finally trust your data? Book your free BI consultation today and let’s build a data analysis strategy that solves your unique challenges.
Frequently Asked Questions About Data Strategy
Navigating the world of data can bring up a lot of questions. That's totally normal, especially for business owners who are more focused on growth than technical jargon. Here are some clear, straightforward answers to the things we get asked most often by founders and operators.
How Much Does a Data Strategy Cost?
This is usually the first question people ask, and the honest answer is: it depends. The cost is tied directly to where you're starting and what you want to achieve. A focused project to build one core financial dashboard in Power BI will naturally be a smaller investment than a full-scale overhaul connecting several complex systems from scratch.
But here’s a better question: what's the return on investment (ROI)? A properly executed data analysis strategy should pay for itself, and quickly. It does this by pinpointing cost savings, finding new revenue streams, and giving your team back dozens of hours every single month.
How Long Until We See Results?
You don't have to wait a year to see value. Not even close. Our 90-day roadmap is designed to deliver real, tangible results within the first quarter. That first "aha!" moment usually hits within the first 30-60 days, right when you see your first automated dashboard and your core business numbers are finally all in one place.
Full adoption across the team and making data a part of your company's DNA takes a bit longer, of course. But those initial wins—the ones that solve your biggest reporting headaches—happen fast.
Do We Need to Hire a Data Scientist?
Absolutely not. For most small and medium-sized businesses, bringing on a full-time data scientist is complete overkill. The goal of a solid data analysis strategy isn't to run complicated machine learning models; it's to automate your reporting and get clear answers to your most critical business questions.
The real power comes from embedding data into your daily operations, not from hiring a dedicated analyst. A good BI consultant sets up the systems so your existing team is empowered to use the insights without needing a technical background.
Can We Just Use Excel or Google Sheets?
Look, we get it. Spreadsheets are familiar. But they're also the root cause of the "data chaos" most businesses are trying to escape. They are riddled with manual errors, they create information silos where no one has the same numbers, and they simply can't handle the automation or scale a growing business demands.
Moving to a tool like Power BI isn’t just about making prettier charts. It’s about building a reliable, automated system that kills manual work and creates a single source of truth your entire team can trust without a second thought.
Ready to get clear answers tailored to your specific business challenges? The team at Vizule is here to help you design a practical, high-impact data analysis strategy that delivers results.


