


Improving your data quality comes down to building a solid foundation. It means setting standards for how information gets entered, removing duplicates, validating data at the source, and establishing clear rules for data governance. This isn't just a technical cleanup; it's a strategic move that transforms unreliable spreadsheets into a powerful engine for automated reporting and confident, insight-led decisions.
Why You Can't Trust Your Business Reports
It’s a frustration almost every business owner has felt. The sales report says one thing, but the finance team’s records show something completely different. Your marketing dashboard feels more like a random number generator than a source of truth.
You spend hours manually stitching together data from different systems, only to present numbers that someone in the room immediately pokes holes in. This is the reality of "Excel chaos," where siloed data and manual processes undermine your confidence.
This deep-seated mistrust in your own reporting rarely stems from a single, catastrophic system failure. Instead, it’s the result of a thousand tiny, seemingly harmless errors that have been quietly piling up over time. The real culprit is almost always poor data quality—a silent threat that cripples your ability to make smart, timely decisions and scale your business effectively.
The True Cost of Small Mistakes
Every business has its share of minor data hiccups. A salesperson misspells a company name in the CRM. An invoice gets logged twice. A customer's address is missing a postcode. Taken individually, these are just minor annoyances. But when they multiply across thousands of entries, they create a dangerous ripple effect of inefficiency and risk.
These little problems quickly snowball into major business headaches:
- Wasted Time: Your team ends up burning hours just cross-referencing spreadsheets and manually scrubbing data instead of focusing on high-value work that actually grows the business.
- Flawed Decisions: Inaccurate sales forecasts can lead to stockouts or overstocking, while unreliable financial data might hide a looming cash flow crisis until it's too late.
- Lost Opportunities: If your customer data is a mess, you can't properly segment your audience for targeted marketing campaigns or even identify who your most profitable clients really are.
The economic fallout from poor data quality is genuinely staggering. Some estimates suggest that in the United States alone, bad data sucks $3.1 trillion out of the economy every year. For individual companies, the average loss is around $12.9 million annually due to these data-related problems.
To get a better sense of how these issues translate into business risks, take a look at the visual below. It breaks down how common data errors can directly undermine your reporting.
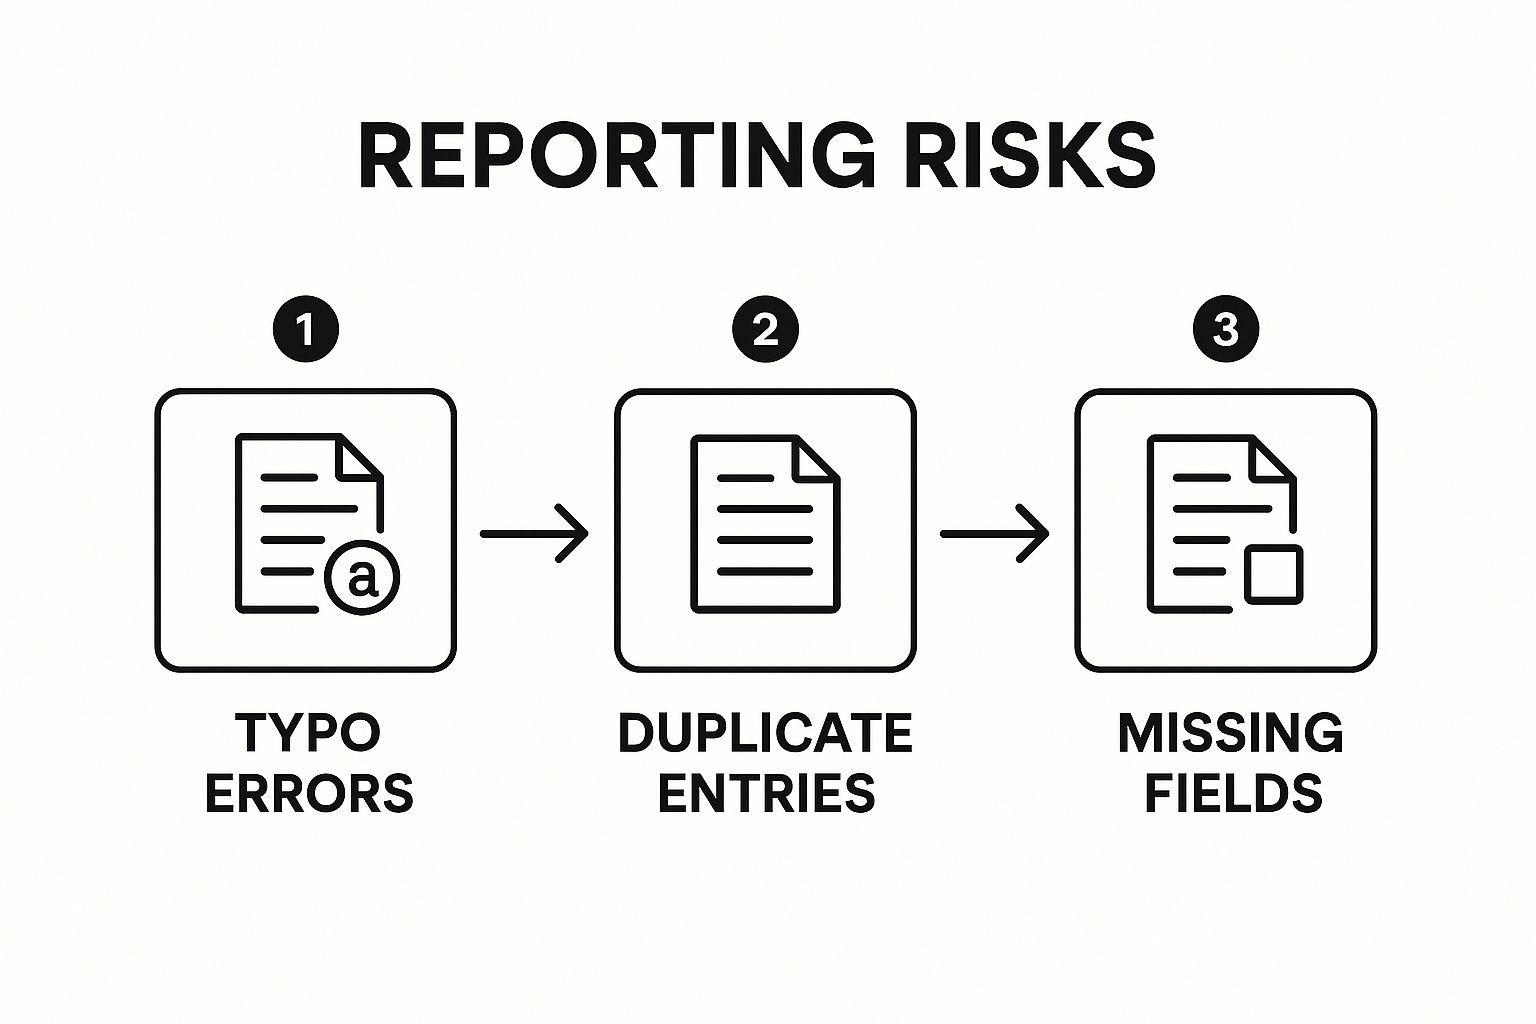
This flow, from simple typos to major reporting risks, shows exactly how a shaky data foundation can sabotage your entire business intelligence effort.
To help you get a handle on this, here's a quick table outlining the most common issues we see and the real-world impact they have on an SMB.
Common Data Quality Issues and Their Business Impact
| Data Quality Issue | Example | Impact on Your Business |
|---|---|---|
| Inaccurate Data | Wrong phone numbers, outdated addresses, incorrect pricing | Wasted marketing spend, failed deliveries, customer frustration, lost sales. |
| Incomplete Data | Missing contact names, empty email fields, no industry information | Inability to segment customers, poor personalization, missed upsell opportunities. |
| Duplicate Records | The same customer or lead entered multiple times | Skewed analytics, annoying customers with multiple messages, inflated pipeline metrics. |
| Inconsistent Formats | "United States", "USA", and "U.S." all used for the same country | Difficult to filter and analyze data, leading to flawed reports and business insights. |
Seeing it laid out like this really drives home how critical it is to get your data in order. It's not just an IT problem; it's a core business function essential for aligning finance and operations.
Tackling data quality isn't just about cleaning up spreadsheets; it's about building a reliable foundation for growth. It’s the first and most critical step toward automating your reporting and creating a system you can finally depend on.
Ultimately, getting this right means moving from scattered, chaotic data to a unified view of your business. If you're looking for a deeper dive into the specific solutions for these data issues, this comprehensive guide on how to improve data quality is an excellent resource.
Ready to stop second-guessing your numbers and start making decisions with confidence? Book your free BI consultation with a Vizule consultant today, and let's build a reporting engine you can truly trust.
A Practical Framework for Auditing Your Data
Before you can fix any data problem, you first have to understand just how deep the rabbit hole goes. I know, tackling a data mess feels completely overwhelming. But a systematic audit is simpler than it sounds. It’s less about fancy software and more about becoming a data detective inside your own business, asking the right questions to trace the source of your reporting headaches.
The best place to start is with what I call a "data walkthrough." This isn't some highly technical exercise. Think of it as following your data on its journey from its birthplace—your CRM, accounting software, or wherever it's created—all the way to its final destination in a report. This process shines a light on every single point where errors can sneak in.
Trace the Data Journey
First things first, pick one critical report that you just don't trust. Is it the monthly sales forecast? Your cash flow reporting? Choose one and start working backward.
Your goal is to map out the entire path that data takes. For example, a sales report might pull information from your CRM, which is then dumped into a spreadsheet, manually tweaked by a team member, and finally copied into a presentation. Every one of those steps is a potential point of failure. Getting a clear picture of this flow is fundamental, much like knowing the steps needed to build an effective data pipeline if you were aiming for automation.
Identify Your Key Business Questions
Next up, define what you actually expect the data to tell you. Every report exists to answer a question, right? For that sales report, the questions might be:
- Who are our top 10 customers by revenue this quarter?
- What is the average deal size for new clients?
- Which sales rep has the highest close rate?
Listing these out gives you a clear benchmark. You're no longer staring at a pile of numbers; you're actively evaluating how well that data answers the questions that matter to your business. If it can't, you know you've got a problem.
Assess Your Data Against Core Quality Dimensions
With your data map and key questions in hand, you can finally start assessing the data itself. You don't need sophisticated tools for this—just a critical eye. Keep an eye out for red flags across these four areas:
- Completeness: Are there obvious gaps? Look for records with missing phone numbers, blank invoice dates, or empty industry fields. Incomplete data makes any kind of segmentation or real analysis nearly impossible.
- Consistency: Is the data uniform? This is where you check for things like using "CA," "Calif.," and "California" interchangeably. These little variations stop you from filtering and grouping accurately, which leads to seriously skewed reports.
- Accuracy: Does the data reflect reality? It's time to spot-check. Pull a few recent customer records from your CRM and compare them against their actual invoices. Do the deal values match up? Is the close date correct?
- Timeliness: How fresh is your information? If your reports are based on data that's a month old, your decisions are already out of date. Data has to be current to be relevant.
This manual audit might feel a bit tedious, but it's an incredibly valuable exercise. It sharpens your intuition and reveals the exact weak spots in your processes that need fixing.
Conducting a data walkthrough isn't just about finding errors; it's about understanding why they happen. It empowers you to move from constantly fighting fires to preventing them in the first place.
Going through this process gives you a concrete "problem list" to work from. Instead of a vague feeling that "the data is wrong," you now have specific, actionable issues like, "our team uses inconsistent state abbreviations" or "deal values aren't updated in the CRM after an invoice is paid." This kind of clarity is the essential first step toward building a reliable, automated reporting system you can finally trust.
If this detective work uncovers more questions than answers, it might be time for an expert opinion. At Vizule, we specialise in untangling these exact data knots for SMBs. Book your free BI consultation, and we'll help you map your data flow and build a solid plan to restore trust in your numbers.
Creating a Data Rulebook to Ensure Consistency
After you’ve done the detective work and figured out where your data issues are coming from, it's time to create a set of rules to keep them from happening again. This isn’t about writing a hundred-page policy manual or buying expensive software. For a small or medium-sized business, this is about building a simple, practical “data rulebook” that gets everyone on the same page.
Think of it as demystifying the whole concept of data governance. At its core, good governance is just about agreeing on the rules of the game. It’s the playbook that finally gets your sales, finance, and operations teams speaking the same language, breaking down the data silos that cause so many reporting headaches.

This alignment is absolutely critical. Without it, trust in data evaporates. Recent findings show that by 2025, a shocking 67% of business leaders will lack complete trust in their organization’s data for making decisions. This isn't surprising when you learn that 64% of organizations point to ongoing data quality problems as their number one data integrity issue.
Establish Clear Data Ownership
One of the quickest wins is to assign clear ownership. It’s a simple truth: when nobody is responsible for data quality, nobody takes action. You don't need a formal committee—just designate a point person for each key data area.
- Who owns sales data? Your Head of Sales should be responsible for the accuracy of records in the CRM.
- Who owns financial data? Your Finance Manager or Controller is the go-to for data in your accounting software.
- Who owns marketing data? Your Marketing Lead should oversee the integrity of campaign and lead source information.
This simple act creates accountability. Suddenly, when an error pops up, everyone knows exactly who to talk to, and that owner is empowered to enforce the rules.
Create a Simple Data Dictionary
A "data dictionary" might sound overly technical, but it’s just a list of agreed-upon definitions for your most important business terms. This document is your best defense against the classic scenario where Sales and Finance have completely different ideas of what an "Active Customer" actually is.
Your dictionary can be a simple shared document that defines terms like:
- Active Customer: A client who has made at least one purchase in the last 12 months.
- Qualified Lead: A lead that has been contacted by sales and confirmed to have budget, authority, and need.
- Churned Customer: A former active customer who has not made a purchase in over 13 months.
Defining your key terms is a foundational step. It ensures that when your Power BI dashboard shows "150 Active Customers," everyone from the CEO to the sales team agrees on what that number actually represents.
Having this clarity is a core piece of building a robust system. To see how these principles fit into a larger framework, you can explore our in-depth guide to developing a data governance strategy.
Set Up Simple Validation Rules and Naming Conventions
Finally, your rulebook needs straightforward rules for data entry. These are the small process changes that prevent countless errors from ever happening.
For example, a consistent naming convention for new clients in your CRM can make a huge difference. Instead of having "Vizule," "Vizule, Ltd.," and "Vizule Limited" as three separate accounts, you establish one rule: Always use the official, registered company name without legal suffixes.
Other simple validation rules could include:
- Phone numbers must always include the country code.
- Deal value fields cannot be left blank.
- State/Region fields must use the two-letter abbreviation from a dropdown list.
These aren't complex technical fixes; they are clear, documented processes that guide your team toward better data habits. To lay a solid foundation, it’s worth exploring proven data governance best practices.
Automating Data Cleansing with Power BI
Once you’ve established a clear rulebook for your data, the next logical move is to stop fixing the same errors over and over again. Manually. A data dictionary and clear ownership are fantastic for preventing future issues, but what about the mess you already have? This is where you shift from constant fire-fighting to building a system that cleans up after itself.
Enter Power BI, and more specifically, its built-in engine, Power Query. Think of Power Query as your tireless, automated data cleaner. You teach it the rules just once, and it applies them flawlessly every single time your reports refresh. This alone can save your team countless hours of tedious, soul-destroying work in Excel.
From Manual Fixes to Automated Rules
For many small and medium-sized businesses, the "monthly report scramble" is a familiar nightmare. It usually involves pulling data from multiple systems into Excel, followed by a painful, repetitive ritual of manual cleaning tasks. This process isn't just a massive time-sink; it's practically an open invitation for human error. This is the transition from Excel to Power BI that unlocks true automation.
Power Query completely changes the game by letting you record your cleaning steps. These steps are saved as a reusable "recipe" that automatically transforms your raw, messy data into a pristine dataset, ready for analysis.
Let's look at a few real-world scenarios that founders and operators deal with every day.
- Zap Duplicate Sales Entries: A glitch in your e-commerce platform means some sales get logged twice. Instead of hunting them down in Excel each week, you apply a "Remove Duplicates" step in Power Query. It will automatically find and kill any identical rows every time the data is refreshed.
- Split a 'Full Name' Column: Your CRM has a single "Full Name" field, but you need 'First Name' and 'Last Name' for your marketing emails. A simple "Split Column by Delimiter" function in Power Query can automatically separate the names based on the space between them. Done.
- Standardize Inconsistent Data: Your sales team has entered location data in every format imaginable—'CA', 'Calif.', and 'California'. Using the "Replace Values" feature, you can create a rule that automatically converts all variations into the standardized 'California' format.
This 'set it and forget it' capability is the heart of smart business intelligence. It frees your team from low-value data janitor work so they can focus on what actually drives the business forward: finding insights.
This screenshot from Power BI shows just how intuitive the interface is for applying these data transformation rules, turning messy source data into clean, report-ready information.
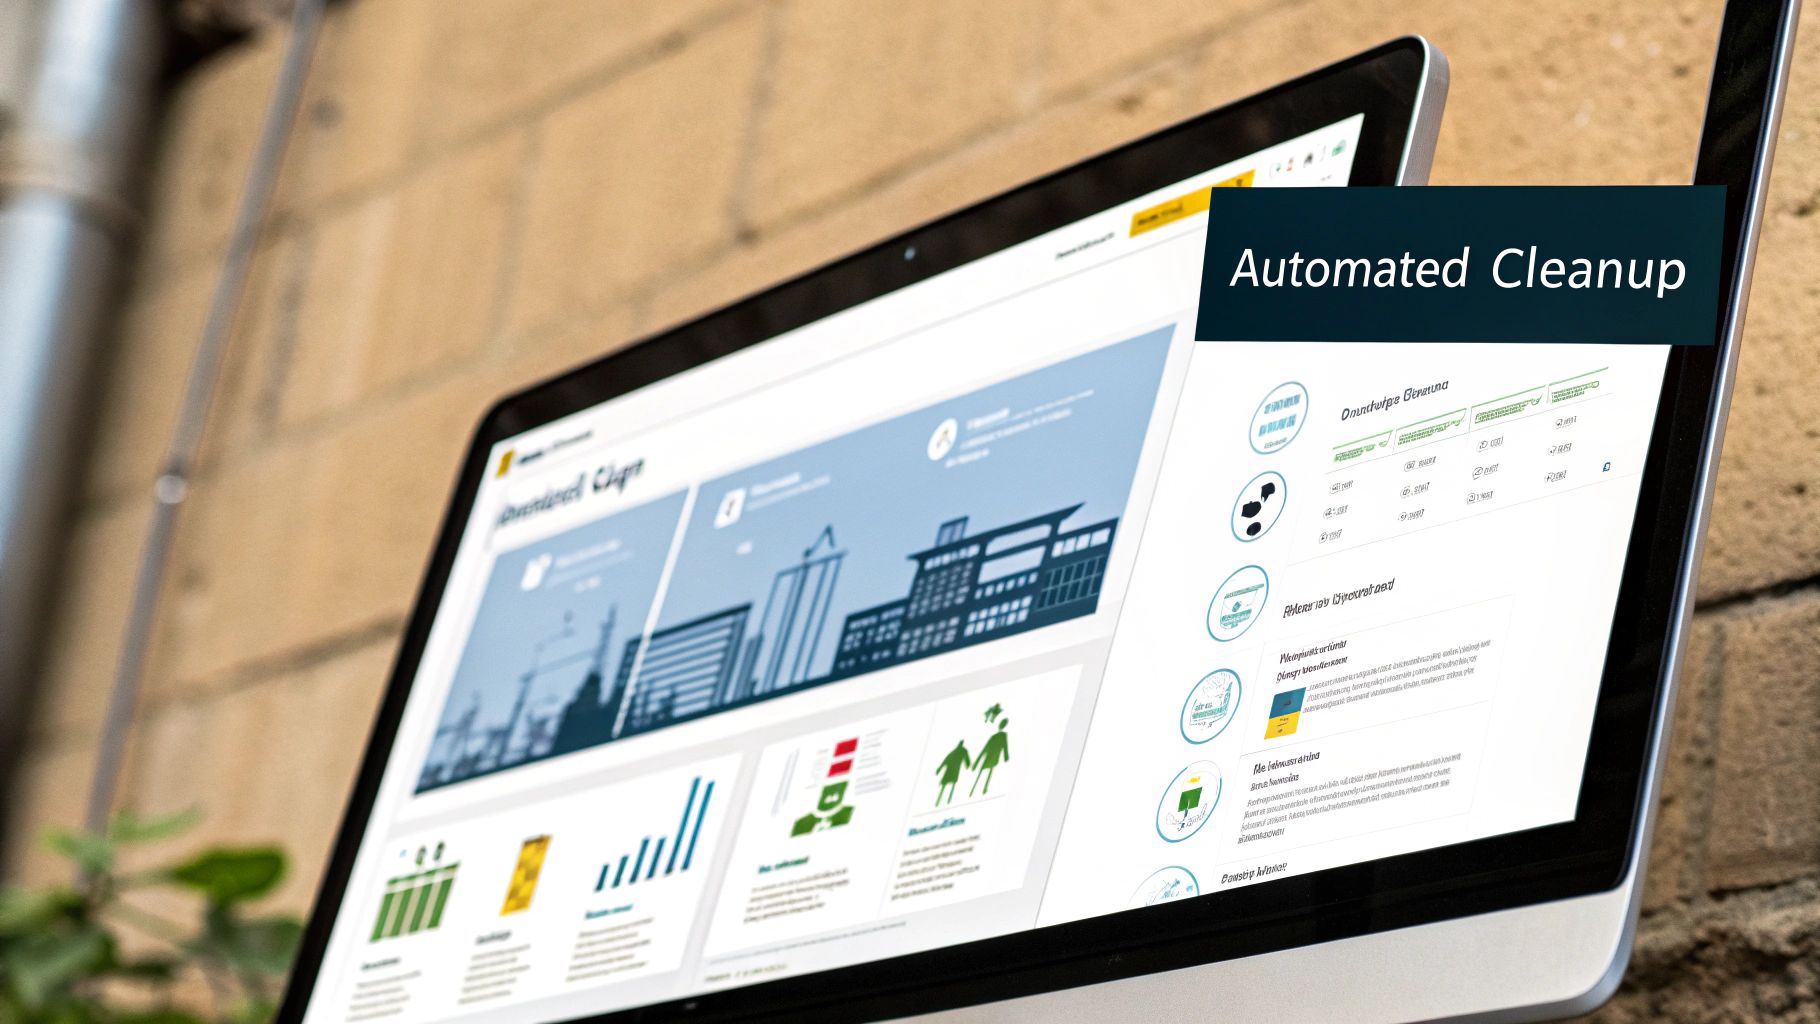
The user-friendly design means business users—not just data experts—can build powerful data cleansing workflows that run on autopilot.
The Power of Repeatable Processes
The real magic here is repeatability. Once you've defined your cleaning steps for one data source, that query can be reused across dozens of reports. This ensures everyone in the company is working from the exact same clean, consistent, and trusted data.
Automating your data cleansing isn't just about efficiency; it's about building trust. When your team knows the data is being scrubbed consistently and automatically every single time, confidence in the final reports skyrockets.
This shift directly tackles the core frustration of unreliable and time-consuming manual reporting. By building these automated cleaning rules, you're not just improving data quality for a single report; you're creating a scalable foundation for your entire reporting stack. You're finally moving away from fragile Excel files and toward a robust, automated system that actually supports your growth.
If escaping Excel chaos and automating your reporting sounds like a dream, it’s closer than you think. See how Vizule can help automate your reporting stack and turn your messy data into your most valuable asset.
Monitoring Your Data Health for Long-Term Success
Getting your data quality up to scratch isn't a project you can just tick off a list. Think of it as an ongoing discipline. You’ve gone through the hard work of auditing your systems, writing the rulebook, and automating the first big cleanup. Now, the real challenge begins: keeping it that way and stopping the slow, inevitable decay of data integrity.
The best way I've found to do this is to start treating your data pipelines like a manufacturing production line. You wouldn't just cross your fingers and hope for the best on a factory floor; you'd have quality control checks at every single stage. We need to bring that same mindset to our information, making sure it stays clean, reliable, and ready for action.
Turning Data Quality Into a Trackable KPI
The secret to making this stick is to make data quality a measurable part of your business operations, not just some vague aspiration. After all, you can't improve what you don't measure. This is where you can point your existing business intelligence tools, like Power BI, at a new target: the health of your data itself.
Instead of building another sales or finance report, you create a Data Quality Dashboard. This isn't for tracking revenue or customer acquisition; it’s for tracking the integrity of the very data that fuels those reports. It takes abstract data problems and turns them into concrete numbers that everyone, from the CEO down, can understand.
For instance, your Data Quality Dashboard could track things like:
- Incomplete Customer Records: A simple line chart showing how many new CRM entries are missing a phone number or email each week.
- Data Validation Failures: A bar chart counting how many product entries break a specific rule, like having a price of zero.
- Duplicate Entry Rate: A big, bold KPI showing the percentage of duplicate invoices found in your accounting system every month.
When you visualise these issues, you shift from reactive firefighting—where you only notice a problem when a report breaks—to proactive management. You can spot a sudden spike in incomplete records and fix the root cause, maybe a new team member needing more training, before it pollutes your entire database.
Setting Measurable Improvement Targets
Once you have that dashboard, you can set real, measurable targets. This completely changes how the organization sees data. A Gartner study found that a shocking 59% of organizations still don't systematically measure their data quality on an ongoing basis. As the report points out, scoring your data on key dimensions like accuracy and completeness on a 0–100 scale allows teams to actually track progress. You can dive deeper into this with this insightful article on data quality measurement methodologies.
For a small or medium-sized business, this is where the theory gets practical. Your targets don't need to be overly academic. They should be simple business goals:
- Objective: "Let's cut down on incomplete customer profiles by 20% this quarter."
- Objective: "We need to hit a 99% consistency rate for product naming conventions by the end of the month."
- Objective: "Get the number of duplicate lead entries down to fewer than 10 per week."
When you start monitoring your data's health with the same rigor you apply to your financial performance, you create a culture of data accountability. It sends a clear message to the whole team: data quality isn't just an IT problem—it's a business priority.
This ongoing monitoring loop is what makes all your hard work last. It confirms the rules you wrote in your data rulebook are actually being followed and that your automated cleanup jobs are doing what they're supposed to. It closes the loop and creates a virtuous cycle of continuous improvement.
This proactive approach is the final piece of the puzzle, ensuring the trust you've painstakingly built in your data is maintained for the long haul.
Ready to build a system that not only cleans your data but keeps it healthy for good? Connect with us to design your financial dashboard in Power BI and gain complete confidence in your numbers.
Your Data Quality Questions Answered
Even with a clear plan, kicking off a data quality project can feel like a massive undertaking. Let's tackle a few of the most common questions we hear from SMB owners and startup founders who are ready to stop fighting their data and start trusting it.
How Much Does It Cost to Improve Data Quality for an SMB?
This is always the first question, and the answer isn't about a huge cash outlay—it's about an investment of time and focus. For most small and mid-sized businesses, the initial cost isn't in pricey software. It's in the strategic work of mapping out how data moves through your company, defining what "good" looks like, and getting your team on board.
The real, and much scarier, cost is the price of doing nothing. Just think about the hours your team wastes every single month manually fixing reports. Or the bottom-line impact of one bad decision made because the data was flat-out wrong. Those costs pile up fast.
Working with a consultancy like Vizule is often a cost-effective shortcut. When we implement Power BI solutions that automate the messy cleanup work, the investment often pays for itself by freeing up thousands of hours of manual effort. More importantly, it lets you make smarter, more profitable decisions. The trick is to start small with one high-impact area, like automating your cash flow reporting, prove the ROI, and then expand from there.
Can I Really Do This Without Being a Technical Expert?
Yes, absolutely. While the tools can get technical, the heart of good data quality is all about business logic. As the business owner or operator, you are the ultimate expert on what your data is supposed to mean. That's the most important skill you need.
Getting your data in order always starts with business questions, not complicated code. It all begins with simple, powerful questions like:
- What's our official definition of a "qualified sales lead"?
- What are the non-negotiable fields that must be filled out for every new client?
- Which KPIs are absolutely essential to run the business day-to-day?
Your job is to define the business logic—the "what" and the "why." Our job as BI consultants is to take that logic and translate it into an automated, technical solution using tools like Power BI. You handle the strategy, we handle the "how."
You don't need to be a data scientist to demand better data. You just need to be the expert in your business—and you already are. Your operational knowledge is the most critical ingredient in any successful data quality project.
Where Is the Best Place to Start If Our Data Is a Total Mess?
When everything feels broken, the natural instinct is to try and fix it all at once. That's a surefire recipe for getting overwhelmed and burning out. The best strategy? Pick one—and only one—critical business report that's causing you the most headaches.
Is it your weekly sales pipeline forecast that nobody trusts? The month-end financial close that takes ten days instead of two? Or maybe it's your marketing ROI report that feels like a total guessing game?
Pick that single report and put all your energy into the specific data that feeds it. Trace its journey from start to finish, pinpoint where the inconsistencies are creeping in, and build your new rules around that one, focused process.
By starting with a small, high-impact area, you get a quick, visible win. This doesn't just solve a real business problem; it proves the value of this effort to your entire team and builds the momentum you need to tackle the next challenge. This focused approach is so much more effective than trying to boil the ocean. You're building a strong foundation, one solid brick at a time.
Tired of wrestling with messy data and reports you can't trust? The team at Vizule specialises in transforming Excel chaos into automated, reliable reporting systems for SMBs. We connect the dots in your data so you can focus on making insight-led decisions that drive growth.
Want to automate your reporting and finally trust your data? Book your free BI consultation with our BI consultants today.


