


If your team is still manually exporting data into spreadsheets, you’re in good company. Countless small and medium-sized businesses are stuck in a daily grind of copying, pasting, and wrestling with data from different systems.
This "Excel chaos" is more than just a headache. It's a massive bottleneck that eats up hours every week and forces you to make critical decisions based on information that’s already stale and likely full of errors.
Let's fix that. A data pipeline is your automated bridge from scattered data sources—like your CRM, accounting software, and ad platforms—to a single, reliable source of truth. This guide will show you how to build one, step-by-step, so you can stop fighting with data and start using it to grow your business.
Escaping The Spreadsheet Trap With A Data Pipeline
Building a proper data pipeline boils down to four key stages: extracting data from your various sources, loading it into a central data warehouse, transforming it into a clean and usable format, and finally, visualizing it in a tool like Power BI.
This automated workflow completely replaces manual spreadsheet tasks, creating a dependable, always-up-to-date foundation for all your business and financial reporting.
What Is a Data Pipeline in Plain English?
Forget the technical jargon. Think of a data pipeline as a purpose-built system that automatically handles all the tedious data work you're currently doing by hand. It’s not a single piece of software, but rather a connected process that accomplishes a few crucial things for your business:
- Brings Siloed Data Together: It pulls information from all the different tools you rely on (think QuickBooks, Shopify, Google Analytics, etc.) and gathers it in one place.
- Cleans and Organizes on the Fly: The pipeline automatically tidies up inconsistencies, standardizes formats, and structures the data so it’s actually ready for analysis.
- Creates a Single Source of Truth: Instead of juggling multiple, conflicting spreadsheets, you get one central repository—usually a data warehouse—where all your most important business data lives, aligning finance and operations.
- Enables Real-Time Reporting: Because the process runs on a schedule, your reports and KPI dashboards are always current. They reflect the latest performance data without anyone needing to hit "refresh."
For a founder or operator, building a data pipeline isn't some abstract, overly complex tech project. It's a practical, strategic move to get time back, align your finance and operations teams, and finally make decisions with real confidence. This guide will walk you through how to build one, step-by-step, without needing a dedicated team of data engineers.
For many businesses, the first step away from manual reporting is improving how they handle their current spreadsheets. A fundamental step in building a robust data pipeline often involves transforming your existing spreadsheet workflows. Learn how to automate Excel to see how you can start reclaiming hours immediately.
Ultimately, the goal here is to shift from reactive data wrangling to proactive, insight-driven decision-making. That journey starts by recognizing that the time you’re spending fighting with spreadsheets is time you could be spending scaling your business.
Mapping Your Data Needs Before You Build
Here’s the single biggest mistake I see business owners make when they decide to build a data pipeline: they start with the technology. It’s tempting to jump straight into researching flashy tools, but a truly successful pipeline begins with a clear business question, not a software subscription.
Before you ever write a line of code or pick a single tool, you need a blueprint. This plan has to be built entirely around what your business needs to know to grow. This "strategy first" approach is non-negotiable. It ensures the system you create is directly tied to commercial outcomes, preventing wasted effort and delivering real insights from day one.
Start With the Questions You Can't Answer
Get your team in a room—especially leaders from finance, operations, and marketing. Then, ask one simple but incredibly powerful question: "What are the top three business questions we can't answer right now?"
Forget about the data for a moment. Just focus on the gaps in your knowledge. The answers that bubble up will become the very foundation of your entire project.
For an e-commerce startup, these questions often sound like this:
- What is our true, fully-loaded customer acquisition cost (CAC) for each marketing channel?
- Which products have the highest and lowest profit margins once we factor in all shipping and return costs?
- What's the lifetime value (LTV) of customers who first bought during a holiday sale versus a normal period?
Answering any of these requires connecting the dots between multiple systems. That CAC question alone needs data from Google Ads, your e-commerce platform like Shopify, and your accounting software like QuickBooks. This exercise immediately shines a light on which data you need and, more importantly, why you need it.
Identify Your Most Valuable Data Sources
Once you've got your key questions, the next logical step is to figure out where the answers are hiding. Most small and medium-sized businesses rely on a handful of critical platforms to keep things running. Your list will probably look something like this:
- Financial Data: QuickBooks, Xero, Stripe
- Sales & E-commerce Data: Shopify, WooCommerce, Salesforce, HubSpot
- Marketing & Web Data: Google Analytics, Google Ads, Facebook Ads
- Operational Data: Inventory management systems, project management tools
Mapping these sources to your questions clarifies exactly what information needs to be pulled. If you want to understand ROAS (Return on Ad Spend), you know you need spend data from your ad platforms and revenue data from your sales platform. Simple as that.
Building a successful pipeline is less about technical complexity and more about strategic clarity. It's about ensuring every piece of data you collect serves a specific commercial purpose, turning your analytics from a cost center into a growth engine.
Define the Key Metrics That Drive Your Business
With your questions and data sources locked in, the final piece of the planning puzzle is defining the specific metrics—or Key Performance Indicators (KPIs)—you'll track. This is where you move from abstract questions to concrete calculations.
For instance, "understanding customer value" becomes much more specific:
- Metric: Customer Lifetime Value (LTV)
- Calculation: (Average Purchase Value) x (Average Purchase Frequency) x (Average Customer Lifespan)
- Required Data Points:
order_totalfrom Shopify,customer_idfrom Shopify,order_datefrom Shopify.
Getting this granular is crucial. It effectively creates the technical specification for your data pipeline, ensuring the final output is a clean, usable table ready for a tool like Power BI. It also pushes you to develop a more robust framework for your business; after all, a well-defined data analytics strategy is the bedrock of scalable growth. This planning prevents scope creep and makes sure your very first pipeline delivers immediate, tangible value.
Choosing the Right Tools for Your Data Stack

The phrase "modern data stack" gets thrown around a lot, and it often sounds complicated and expensive. But here's the reality for a growing business: building a powerful, lean stack of tools is more accessible and affordable than ever. You don't need a team of data engineers to get started.
This is about making smart, strategic choices that grow with you, not over-investing in technology you don't need yet. The goal is simple: pick a few key tools to automate the grunt work, so you can spend your time finding insights.
Data Extraction: Your Automated Data Courier
First things first: you need to get your data out of all the different systems you use. Manually exporting CSVs is the exact time-suck we want to eliminate. This is where extraction tools, often called ELT (Extract, Load, Transform) platforms, come in. They are essentially automated connectors.
You give them the keys (API credentials) to platforms like QuickBooks, Google Ads, or Shopify, and the tool does the rest. It securely pulls your data on a set schedule—say, every hour—and drops it right into your central storage.
For small and mid-sized businesses, a few names consistently pop up:
- Fivetran: Known for being incredibly reliable with a massive library of pre-built connectors. It’s almost plug-and-play, making it a favorite for teams without a dedicated engineer.
- Stitch Data: A very user-friendly and often more budget-friendly choice, perfect for getting common data sources connected in a flash.
These tools are game-changers. They solve the most annoying part of the entire process—just getting all your data into one place. For those who are more hands-on, exploring Top Free Open Source Data Engineering Tools can also offer some powerful, cost-effective alternatives as you scale.
Data Warehousing: Your Central Data Hub
Once the data is flowing, it needs a home. That's the job of a cloud data warehouse. Forget about a blinking server rack in a closet; these are powerful, scalable databases built for one thing: analytics.
Think of it as the ultimate, perfectly organized digital filing cabinet for your entire company. It holds not just what's happening now but all your historical data, too, which is critical for analyzing trends over time.
For SMBs, the two giants in this space are:
- Google BigQuery: Part of the Google Cloud ecosystem, it’s famous for its blazing speed and "serverless" model, which means you only pay for the queries you actually run.
- Snowflake: An incredibly popular and flexible platform that smartly separates storage costs from computing costs, giving you predictable billing and easy scaling.
Picking your data warehouse is a foundational decision. It becomes the central repository that feeds every report and dashboard you build, creating that all-important single source of truth.
Data Transformation: Cleaning Up the Mess
Let's be honest: raw data from different systems is a mess. Dates are in weird formats, column names don't match up, and you need to join different datasets to create meaningful metrics (like joining ad spend with sales data to calculate ROAS).
This cleanup job is the transformation stage. It’s where you model, clean, and structure your raw data into pristine tables that are ready for analysis. This modeling work is where the real magic happens, turning raw inputs into solid business logic, much like the detailed process we follow when we build financial models from scratch.
The go-to tools for this are:
- dbt (Data Build Tool): This is the undisputed industry standard for transformation. It lets you write simple SQL to define all your business rules, test your data for errors, and document everything as you go.
- Power Query: If you're already in the Microsoft ecosystem, this tool is built right into Power BI and Excel. It has a great user-friendly interface for cleaning and reshaping data without writing code.
The market for these tools is exploding for a reason. It's projected to jump from $11.24 billion in 2024 to $29.63 billion by 2029. This shows that building a proper data pipeline isn't just for huge corporations anymore—it's becoming a core strategy for any competitive business.
To make things even clearer, here's a simple breakdown of the essential tools for a small or medium-sized business.
Essential Data Pipeline Tools for SMBs
| Pipeline Stage | Tool Examples | What It Does (In Plain English) | Best For… |
|---|---|---|---|
| Extraction | Fivetran, Stitch | Automatically pulls data from apps like Shopify, Google Ads, QuickBooks. | Teams that want a "set it and forget it" solution without engineering help. |
| Warehousing | Google BigQuery, Snowflake | Acts as a central, organized database in the cloud for all your company data. | Businesses that need a scalable, reliable place to store data for analysis. |
| Transformation | dbt, Power Query | Cleans, organizes, and joins your raw data into clean, report-ready tables. | Teams that want to define business logic (like LTV or ROAS) in a structured way. |
Putting these pieces together creates a powerful, automated system that works for you 24/7.
The right tools don't just move data; they create leverage. By automating extraction, centralising storage, and simplifying transformation, you build a system that generates value around the clock, long after you’ve set it up.
Assembling Your First Automated Data Pipeline
Alright, you've got your plan and you've picked your tools. Now for the fun part: connecting the dots and actually bringing your first automated data pipeline to life. This is where theory gets real. A huge piece of this puzzle is learning how to solve data integration problems efficiently so you have a logical, clean flow from raw data to real insight.
Let's ground this in a scenario I see all the time with small and medium-sized businesses: calculating your daily Return on Ad Spend (ROAS). To get this number, you need data from Google Ads (your spend) and Shopify (your sales). Doing this by hand is a soul-crushing cycle of exporting CSVs, fighting with VLOOKUPs, and constantly updating spreadsheets. A data pipeline makes it a reliable, automated process that just works.
Connecting Your Raw Data Sources
First things first, you need to pull the raw data into your data warehouse automatically. If you're using a modern ELT tool like Fivetran or Stitch, this is surprisingly simple and doesn't require you to write a single line of code.
You'll basically just:
- Authorize Access: Securely connect your Google Ads and Shopify accounts to the tool, usually with API keys. It’s read-only, so your original data is safe.
- Select Your Destination: Tell the tool where to send the data—your cloud data warehouse, like Google BigQuery or Snowflake.
- Choose Your Data: Pick the specific tables you need. Think
campaign_spendfrom Google Ads andordersorsalesfrom Shopify.
Once that's set up, the tool gets to work. It pulls in all your historical data first, then shifts to an incremental update schedule—sometimes as often as every few minutes. This is how your warehouse stays current without you lifting a finger.
The Crucial Transformation Step
Now, all that raw data is flowing into your warehouse. The problem? It's not actually useful for analysis yet. Your Shopify orders table and your Google Ads spend table are just sitting there, completely separate.
The real magic happens in the transformation step. This is where you join these different datasets, clean them up, and build a single, pristine table that’s ready for analysis.
This is where a tool like dbt or even Power Query comes in. You’ll use simple logic or a visual interface to handle a few key jobs:
- Joining Datasets: Combine the ad spend and sales tables. The most common way is to join them on the date.
- Cleaning Data: This is critical. You'll standardize date formats across both sources, handle any currency conversions, and filter out things like test orders that would skew your numbers.
- Calculating Metrics: Create new columns for the metrics that matter. For our example, this is where you’d create a
ROAScolumn by dividingtotal_salesbytotal_ad_spendfor each day.
What comes out of this process is a clean, trustworthy table—let’s call it daily_marketing_performance—that becomes the single source of truth for your ROAS calculations.
This infographic paints a great picture of the efficiency you gain. It shows how millions of rows can be pulled in, cleaned with high accuracy, and loaded for analysis in a remarkably short amount of time.
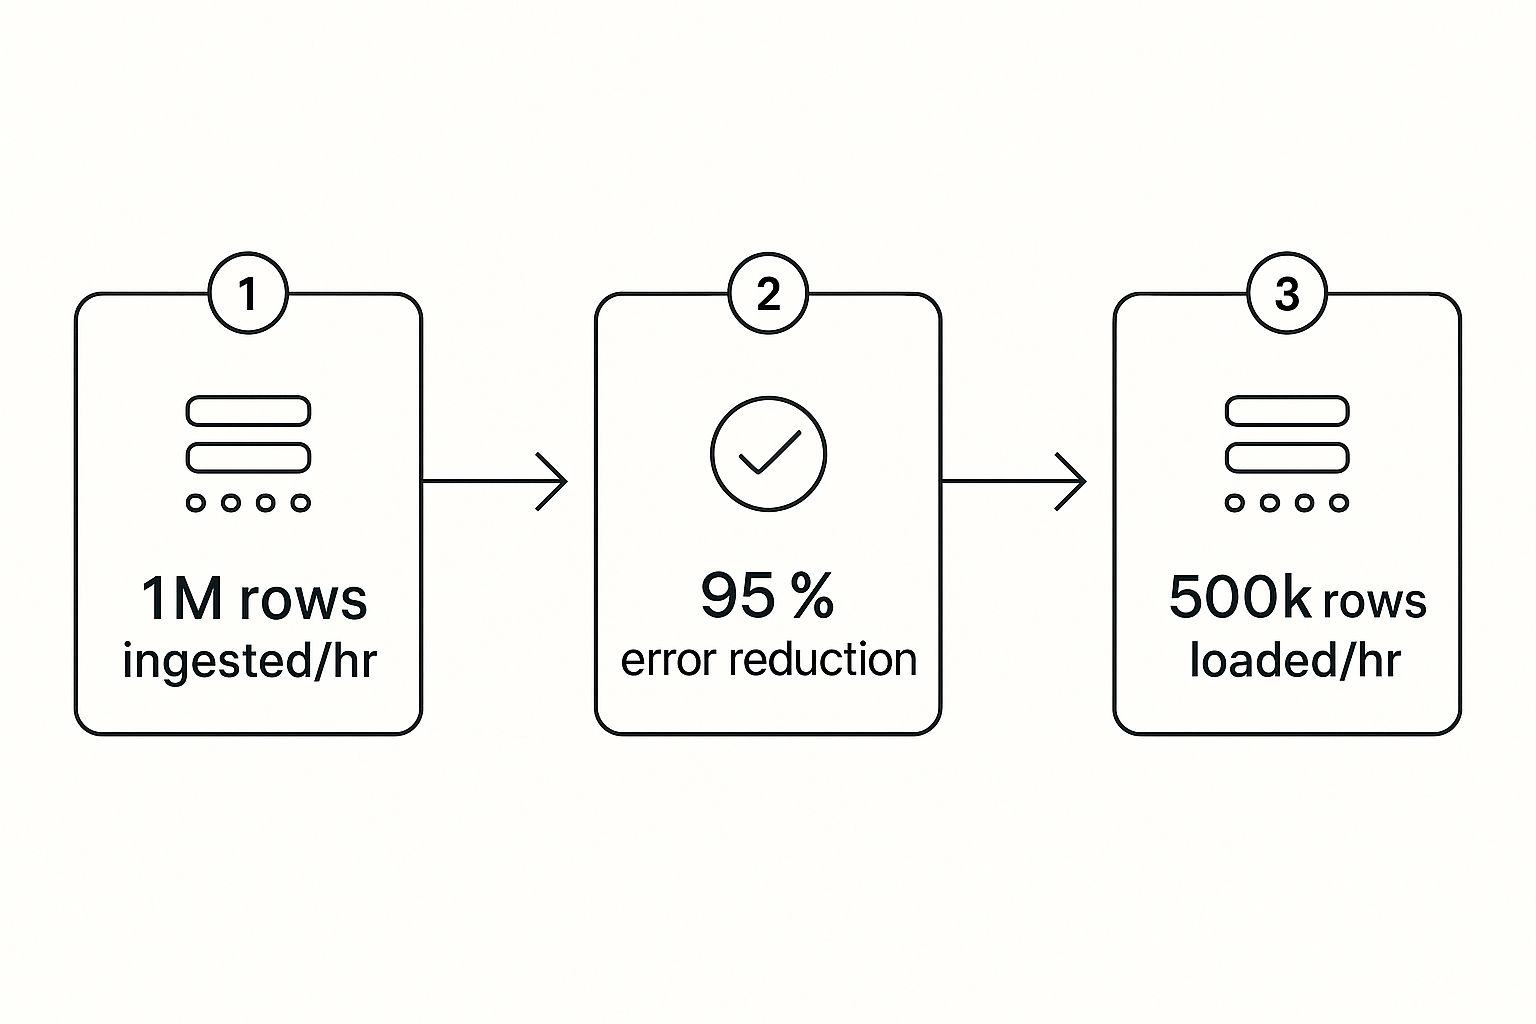
This visual really drives home the core benefit: automation takes care of the massive data volumes and complex cleaning, delivering reliable insights every single time.
Scheduling for Full Automation
The final piece of the puzzle is putting this whole thing on a schedule so it runs by itself. You’ll configure your ELT tool to grab new data hourly, then set your transformation script to run right after that sync is complete. This creates a fully autonomous system.
Every hour, your pipeline will automatically:
- Fetch the latest ad spend and sales data.
- Load it into the warehouse.
- Run the transformation to update your
daily_marketing_performancetable.
The outcome is a hands-off, dependable flow of information that becomes the backbone for all your business intelligence. This is exactly why the demand for these systems is exploding. The global data pipeline market was valued at $6.251 billion in 2025 and is on track to shoot past $15 billion by 2033.
You've just turned a chaotic, manual reporting task into a predictable, automated asset. This isn't a technical nightmare; it's a logical process that frees up your team to focus on what the data is saying, not where to find it.
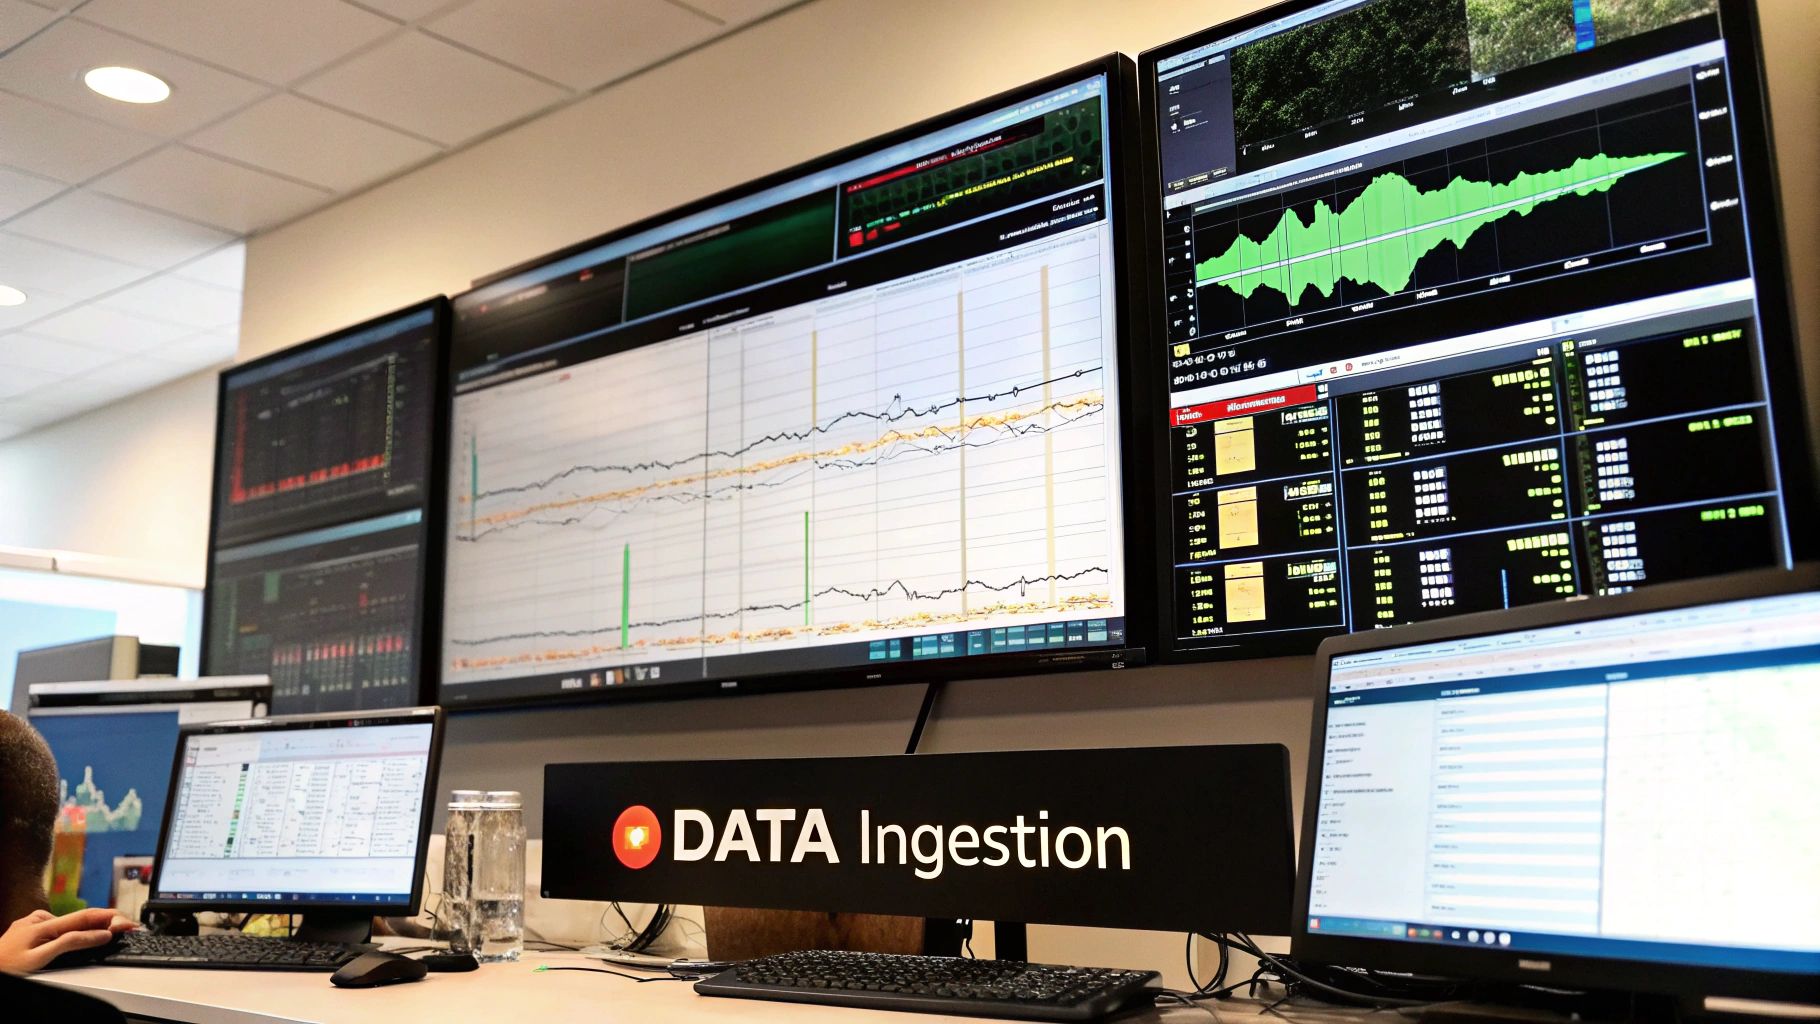
Visualizing Success with Power BI Dashboards

Let's be honest, an automated data pipeline is an incredible technical achievement, but it’s only half the story. All that perfectly clean, structured data sitting in your warehouse is just raw potential. The real magic—the actual payoff for all that hard work—happens when you can finally see the insights. This is the moment your data stops being a spreadsheet and starts being a tool for smart decisions.
This is exactly where a business intelligence (BI) platform like Power BI shines. Think of it as the sleek, user-friendly cockpit that sits on top of your powerful pipeline engine. It hooks directly into your data warehouse and transforms rows of numbers into the interactive, real-time KPI dashboards your leadership team has been dreaming of.
From Manual Reports to Automated Clarity
Just picture the before-and-after for a typical business. Before, your most important financial report was probably a sprawling, multi-tab Excel file. It took hours, maybe even days, of manual work to update each month, and you always had that nagging feeling that one formula might be off.
Now, with your pipeline feeding it clean data, you can build a dynamic financial dashboard in Power BI that essentially runs on autopilot. You can connect it straight to your curated tables—like that daily_marketing_performance table we talked about—and create visuals that are always up-to-date.
This is the ultimate win. It's about more than just saving time; it's about gaining clarity. You can now:
- Drill down into trends with a single click, going from a high-level revenue figure to specific product performance in seconds.
- Analyze profit margins in real-time by blending sales data from Shopify with cost-of-goods-sold data from your accounting software.
- Share insights across the company using secure, web-based dashboards, finally getting everyone on the same page and working from the same numbers.
The final step isn’t just about making pretty charts. It’s about creating a living, breathing view of your business that empowers your team to ask better questions and find faster answers.
The Power of Interactive Financial Dashboards
For founders and operators, this is where the strategic advantage really hits home. Instead of waiting for month-end reports to tell you what happened, you have a daily pulse on the health of your business. This is especially game-changing for financial reporting and building a forecasting model, where timing is everything.
With a Power BI dashboard fueled by your pipeline, you can instantly get answers to critical questions like:
- How is our cash flow reporting looking this week compared to last?
- Which marketing campaign is driving the most profitable customers?
- Are we on track to hit our quarterly revenue targets?
This capability is what turns your data from a simple asset into a genuine growth engine. It’s no surprise that the global data pipeline market, valued at $10.01 billion in 2024, is expected to skyrocket to $43.61 billion by 2032. As businesses everywhere wake up to the need for real-time analytics, the infrastructure to support it becomes non-negotiable. You can explore more market insights to see why this adoption is accelerating so quickly.
Ultimately, connecting your pipeline to Power BI is what makes your data actionable. It bridges the gap between raw information and the insight-led decisions that will truly scale your business.
Ready to Bring Your Data into Focus?
You now have the complete blueprint for building a data pipeline that can genuinely transform your business. Moving away from manual processes and embracing an automated system isn't just about saving countless hours—it's about building a rock-solid foundation for scalable, data-driven growth.
The journey from data chaos to clarity gives you a massive strategic advantage. It means your business can react faster to market shifts, plan smarter with information you can actually trust, and lead your industry with newfound confidence.
Your time is best spent acting on insights, not hunting for them. An automated pipeline frees you up to focus on strategy and growth, leaving the data wrangling to a system built to handle it.
If you're ready to put these strategies into action but want an expert partner to guide you through the process, the team at Vizule is here to help. We specialise in building custom BI solutions that connect all the dots for businesses just like yours.
Want to automate your reporting and finally trust your data? Book your free BI consultation today, and let's design the automated reporting stack your business truly deserves.
Common Questions About Data Pipelines
As you start thinking about building a proper data pipeline, a few practical questions always pop up. Here are the answers to the most common ones we hear from founders who are ready to trade in spreadsheet chaos for automated clarity.
How Much Does It Cost to Build a Data Pipeline for an SMB?
This is usually the first question, and the answer is almost always: it’s more affordable than you think.
With modern cloud tools, you aren’t buying expensive servers or massive software licenses. A lean, effective data stack for a small or medium-sized business can run for just a few hundred dollars a month in subscriptions.
The real investment is the initial time and expertise to get everything designed and configured correctly. But when you weigh that against the hidden costs of manual reporting—like wasted employee hours on copy-paste tasks and the massive risk of making bad decisions on faulty data—the ROI is almost immediate.
Do I Need to Hire a Data Engineer to Manage This?
Not necessarily. The new wave of data tools, like Fivetran for data ingestion and dbt for transformation, are built for a new role: the "analytics engineer." Many can even be managed by a technically sharp business user. The whole point of these platforms is to make data more accessible.
For most SMBs, the smartest path is to partner with a consultancy like Vizule. We handle the heavy lifting—designing and building the core pipeline and getting it running smoothly. Then, we hand you a low-maintenance system that doesn't demand a full-time, six-figure hire. You get the power of an enterprise-grade setup without the enterprise-grade overhead.
A common misconception is that a data pipeline is a huge, ongoing technical burden. A well-designed pipeline is actually a set-it-and-forget-it asset that runs quietly in the background, needing very little attention once it's up.
How Long Does It Take to Build Our First Data Pipeline?
This doesn't have to be a six-month saga. By zeroing in on a single, high-impact business problem—like our earlier example of calculating daily ROAS—you can often get a fully functional pipeline live in just a few weeks.
The trick is to start small, prove the value, and expand from there. This agile approach helps you avoid the classic trap of trying to connect every single data source from day one, which just leads to delays and frustration. Your first successful project builds momentum and shows the team what’s possible, making it much easier to justify the next step.
Is a Data Pipeline Better Than Just Using Zapier or Make?
This is a great question because it gets right to the core of why you'd build a pipeline in the first place.
Tools like Zapier and Make (which used to be Integromat) are fantastic for task-based automation. They’re perfect for simple, trigger-based actions like, "when a new sale happens in Shopify, add a row to this Google Sheet." They move small bits of data from A to B.
A data pipeline, on the other hand, is built for robust, large-scale data aggregation and analysis. It solves a completely different problem.
Here’s the breakdown:
- Volume and History: A pipeline is designed to pull in massive amounts of historical data and store it in a central data warehouse. This is the only way you can do real trend analysis over time.
- Complex Transformations: A pipeline doesn't just move data; it cleans, models, and prepares it specifically for business intelligence. This lets you run complex calculations that are impossible in a simple automation tool.
- BI Integration: The end goal of a pipeline is to feed clean, structured data into a powerful visualization tool like Power BI. This is how you build the interactive dashboards and financial models that actually guide your business.
In short, Zapier connects apps. A data pipeline builds a complete, historical, and analysis-ready view of your entire business.
Building your first data pipeline is a huge step toward scalable growth. By automating your data flow, you give your team the freedom to focus on what they do best—making smart decisions that push the business forward.
If you're ready to make that leap but want an expert partner to get it right the first time, Vizule is here to help.
See how Vizule can help automate your reporting stack. Connect with us to design your financial dashboard in Power BI at https://vizule.io.


