


Staring at a tangled web of spreadsheets, trying to make a critical business decision? You're not alone. The simple truth is that to build financial models that actually work, you have to define the key questions you need to answer, structure the model logically, connect it to real-time data, and use it for dynamic scenario planning. This guide will walk you through exactly how to do that, moving you from Excel chaos to confident, data-driven leadership.
Escape Excel Chaos with a Real Financial Model

So many founders and operators feel trapped by their own data. They spend hours wrestling with conflicting, error-prone spreadsheets, making it nearly impossible to get a clear picture of business health. This isn't just frustrating; it's a huge operational risk.
Let's be honest: this isn't just a business problem; it's a tool problem. When your reports are always out of date, you're constantly reacting to old news instead of shaping your future.
A true financial model is more than just another spreadsheet—it’s a dynamic engine for strategic growth. It transforms your entire approach from reactive to proactive, providing a clear line of sight into performance and aligning your whole operation around a single source of truth.
From Static Reports to Strategic Foresight
The fundamental flaw in most homegrown financial reporting is how static it is. The usual process? Manually exporting data from various systems, pasting it all into a master Excel file, and then spending hours just cleaning it up. By the time the report is ready, the data is already obsolete.
A well-built financial model, especially when hooked up to modern business intelligence tools like Power BI, completely changes this dynamic. It becomes a central hub for decision-making, not just a historical archive.
This shift allows you to:
- Automate Data Integration: Connect directly to your accounting software (like Xero or QuickBooks), CRM, and operational platforms. This pulls in live data, which means no more manual entry and far fewer errors.
- Run "What-If" Scenarios: Instantly see the impact of changing a key business driver. Ask questions like, "What happens to our cash flow if we boost our marketing budget by 15%?" or "How does a 5% drop in customer retention affect our annual recurring revenue?"
- Gain Operational Clarity: Give your entire leadership team a single source of truth. This ensures sales, marketing, and finance are all working from the same numbers and chasing the same goals.
A great financial model tells the story of your business—where you've been, where you are now, and most importantly, where you're going. It's the bridge between raw data and confident, insight-led decisions.
Instead of getting bogged down by data chaos, you gain the ability to forecast with confidence, manage cash flow proactively, and steer your business toward sustainable growth. This guide will show you how to build a financial model that gives you this exact control.
Want to automate your reporting and finally trust your data? Book a free call with our BI consultants today.
Design a Model That Answers Your Key Questions

A truly powerful financial model starts with powerful questions, not a maze of complex formulas. Before you even touch a spreadsheet, you need to nail down its purpose. Too many founders dive headfirst into building, only to end up with a tool that tracks everything but answers nothing important.
The first real step in building a financial model is to step away from the keyboard. Get your leadership team in a room with a whiteboard and start asking the tough questions.
Are you laser-focused on runway and trying to figure out, "When will we be cash-flow positive?" Or maybe you're scaling up marketing and need to know, "What's the real, fully-loaded ROI on our latest campaign?" The answers you're looking for will literally shape the entire design of your model.
Start with Your Core Business Drivers
Every single business, no matter the industry, has a small handful of key performance indicators (KPIs) that actually move the needle. These are your business drivers. They’re the cause-and-effect levers that generate revenue and, ultimately, profit. Identifying these is the absolute foundation of a solid, driver-based forecasting model.
For a SaaS company, this list would likely include:
- Monthly Recurring Revenue (MRR): The lifeblood of any subscription business.
- Customer Acquisition Cost (CAC): Exactly how much it costs to land one new customer.
- Customer Lifetime Value (LTV): The total revenue you can expect from a single customer.
- Churn Rate: The percentage of customers who cancel their subscriptions each month.
An e-commerce business, on the other hand, would be obsessed with drivers like average order value (AOV), conversion rate, and customer repeat purchase rate. When you get these inputs right, your forecast becomes a realistic reflection of how your business actually works.
The goal isn't to track every metric under the sun. It's to pinpoint the 20% of drivers that dictate 80% of your financial outcomes. This focus is what separates a genuinely useful model from a cluttered, confusing spreadsheet.
The Power of the One-Page Model
To crystallize your thinking, start with a "one-page financial model." This isn't a literal single page, but a concept focused on radical simplicity. The idea is to sketch out your main assumptions, key drivers, and the outcomes you want to see in a high-level, non-intimidating way.
This simple exercise forces you to connect the dots between your day-to-day operational activities and your financial statements. For example, how does a change in website traffic (a marketing KPI) flow all the way through to revenue (an income statement line item)? Thinking this through early saves you from building a model that exists in a vacuum. If you want to dive deeper into this, you can explore our guide on how to supercharge your finances with smarter modelling.
Involve Your Entire Team
A financial model built in a silo by the finance team is destined to fail. Why? Because it won’t reflect the operational realities of your sales, marketing, and product departments. Your head of sales knows the sales cycle inside and out, and your marketing lead lives and breathes lead conversion rates.
Bring these leaders into the design process from day one. Ask them:
- What assumptions are you making in your own planning?
- What are the key levers you can pull to impact your team's results?
- What data do you actually trust and use to measure performance?
This collaborative approach accomplishes two critical things. First, it ensures the model's assumptions are grounded in reality, which dramatically increases its accuracy. Second, it creates buy-in across the entire organization. When your whole team helps build the map, they're much more likely to use it to navigate.
Building a financial model this way transforms it from a finance-only report into a central nervous system for your whole business, aligning every single department around a common set of goals and metrics.
Structure Your Model for Clarity and Scale
Now that you've figured out the why behind your model, it's time to build the engine. A solid financial model isn't a massive, tangled spreadsheet. It's a clean, well-oiled machine with distinct parts that all talk to each other. This modular design is the secret to a model that's not only accurate but also easy to audit and ready to grow with your business.
Think of it like building with LEGOs. You wouldn't carve a car out of a single block of wood; you build it piece by piece. A modular approach lets you tweak one area—like your sales forecasts—without causing the whole thing to crash. This massively cuts down on errors and makes your model infinitely more flexible.
The Blueprint: A Modular Approach
A well-built financial model is put together with separate, but linked, worksheets. This "separation of concerns" is a fundamental principle in good financial modelling. Each piece has one job and does it well, which makes the whole system transparent and much easier to manage.
Before we dive into the specific components, it's useful to have a clear mental map of what we're building. The table below breaks down the core building blocks of any scalable model, outlining what each part does and what drives it.
Core Components of a Scalable Financial Model
| Component | Purpose | Key Inputs / Drivers |
|---|---|---|
| Assumptions & Drivers | The model's "control panel." This sheet houses all your key business levers and inputs in one central, easy-to-update location. | Website traffic, conversion rates, Customer Acquisition Cost (CAC), churn rate, pricing, hiring plan, etc. |
| Historical Data | The foundation of reality. This section contains your past financial performance, usually imported from your accounting software. | Monthly P&L, Balance Sheet, and Cash Flow statements from previous periods. |
| Income Statement | Measures profitability over a period. It answers the question: "Are we making money?" | Revenue, Cost of Goods Sold (COGS), Operating Expenses (OpEx), leading to Net Income. |
| Balance Sheet | A snapshot of your company's financial health at a single point in time. It must always balance. | Assets (what you own), Liabilities (what you owe), and Equity (the residual value). |
| Cash Flow Statement | Tracks the actual movement of cash. Arguably the most critical statement for managing runway and operational health. | Cash from Operations, Investing, and Financing activities. |
Having these distinct sections prevents the classic "spaghetti spreadsheet" problem, where everything is intertwined and impossible to audit.
The image below gives you a high-level look at how these pieces come together. You start by identifying the core statements, define the assumptions that will drive them, and then validate everything with real data.
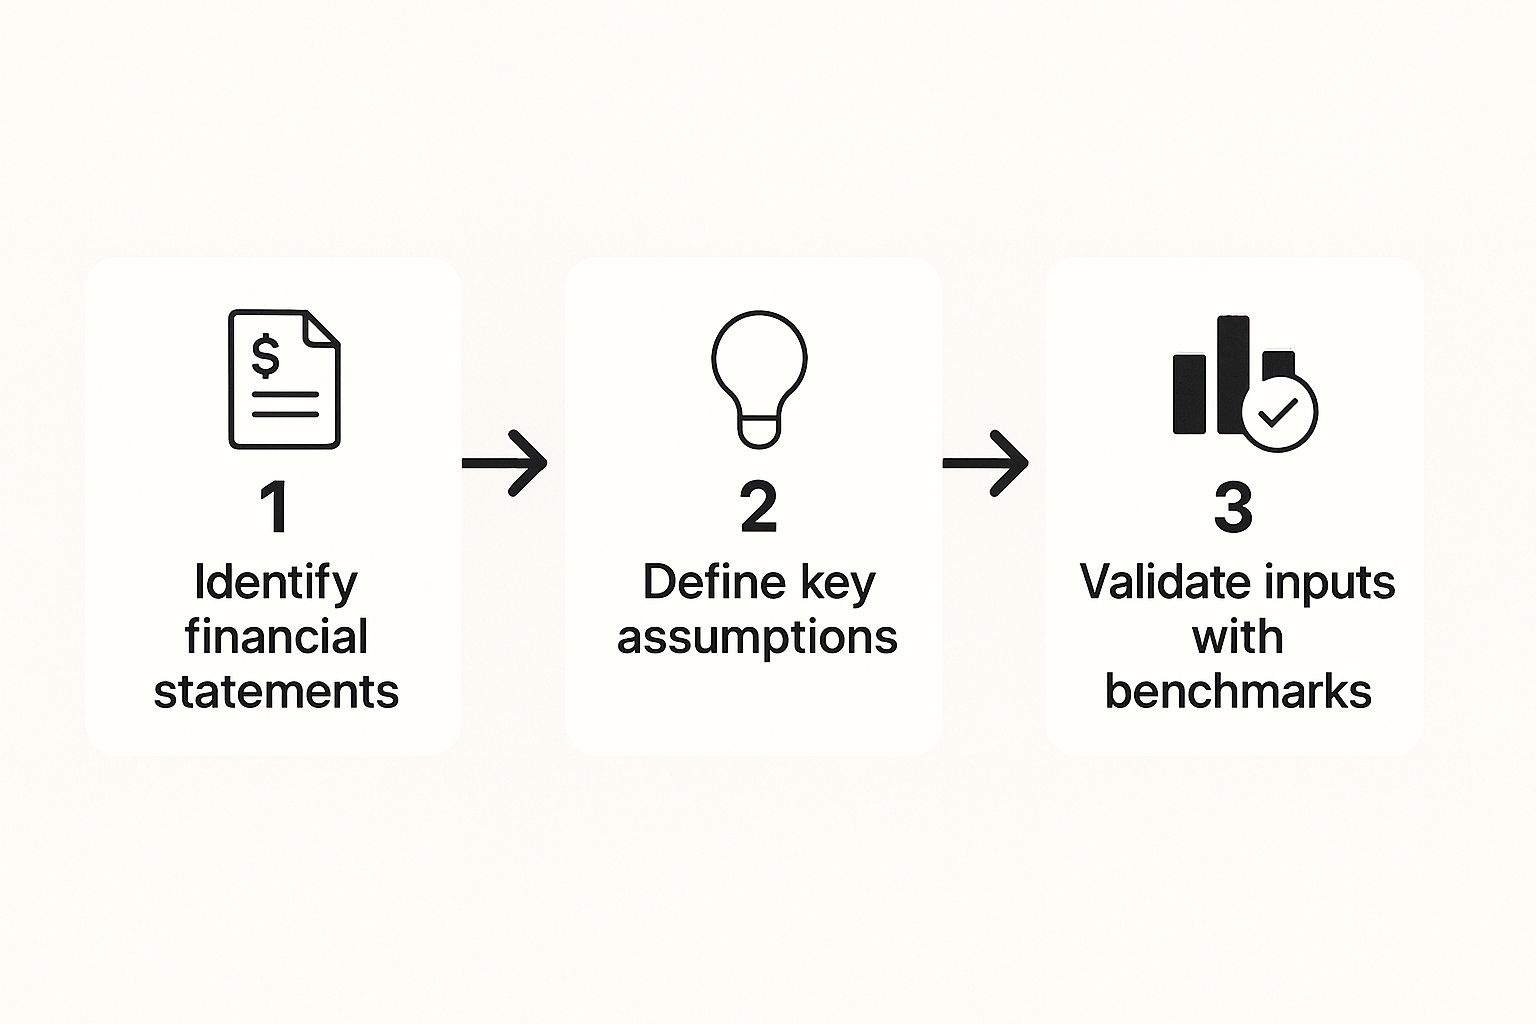
This logical flow—from assumptions to statements to validation—is what makes your model defensible and genuinely useful for decision-making.
Connecting the Dots: A Real-World Example
Let's make this real. Imagine a direct-to-consumer (DTC) e-commerce business. On their 'Assumptions' sheet, they'd lay out their core business drivers:
- Monthly Website Traffic: 50,000 visitors
- E-commerce Conversion Rate: 2.5%
- Average Order Value (AOV): $85
- Cost of Goods Sold (COGS) as % of Revenue: 40%
The model then does the heavy lifting. Revenue isn't just a number you pluck from thin air; it’s a living formula: Website Traffic * Conversion Rate * AOV. This result flows straight into the 'Income Statement' sheet. If you change a driver on the 'Assumptions' sheet—say, you run a campaign that boosts your conversion rate—the entire model updates instantly. Revenue, profit, and cash flow all recalculate automatically.
Golden Rule of Financial Modeling: Never hardcode numbers directly into formulas. Always link back to your 'Assumptions' sheet. This one habit is what separates a static report from a dynamic, powerful tool for scenario planning.
Typing a formula like =(B5*0.025*85) is a rookie mistake. It makes it impossible to test different scenarios without manually hunting down every single formula. The pro move is =(Assumptions!C2*Assumptions!C3*Assumptions!C4).
Foundational Best Practices
Beyond the structure, a few simple formatting rules can save you from a world of pain. This isn't just about making things look pretty; it's about creating a clear visual language so anyone (including your future self) can understand the model at a glance.
Adopt a dead-simple color-coding system:
- Blue Font: Use this for all hardcoded inputs and assumptions. It screams, "This is a number you can change."
- Black Font: Use this for all formulas and calculated outputs. It's a clear signal: "Don't type here; this cell is doing the math."
- Green Font: For any links pulling data from other worksheets in the file.
This simple discipline makes auditing your model for errors about ten times easier. When you can instantly see where the inputs live, you can trace the logic and trust the outputs. A messy model is a black box; a well-structured one tells a clear story.
If your current model feels more like a tangled mess than a clear story, it might be time for a new approach. Connect with us to design your financial dashboard in Power BI and bring this level of clarity and automation to your business.
Connect Your Model to Power BI for Dynamic Insights

This is the moment we leave static spreadsheets in the rearview mirror. You've built a solid, well-structured model, but right now, it’s still living in Excel. In today's market, any report is practically outdated the moment it's finished. Connecting that model to a tool like Power BI transforms it from a historical document into a living, breathing decision-making engine.
This isn't just a fancy tech upgrade; it fundamentally changes how you and your team interact with financial data. You’ll move from running periodic reports to having continuous, real-time insight. Think about your current process: exporting data, updating tabs, fixing broken formulas, and finally generating a PDF. Now, imagine that entire workflow happening automatically, every single night.
From Manual Updates to Automated Reporting
The biggest win here is automation. Power BI can connect directly to your core business systems—your accounting software like Xero or QuickBooks, your CRM like HubSpot, and even your operational databases. It pulls this data in, cleans it according to rules you only have to set once, and populates your model without you lifting a finger.
This is how you build a reporting stack you can actually rely on. The benefits are immediate and substantial:
- Drastic Time Savings: You and your team can reclaim countless hours spent on mind-numbing data entry and report prep. This frees up your best people to focus on analysis and strategy, not copy-pasting.
- Increased Accuracy: Manual data handling is the #1 source of errors in financial reporting. By automating the data pipeline, you practically eliminate the risk of human error, leading to numbers you can truly trust.
- A Single Source of Truth: When every report and dashboard pulls from the same centrally managed data model, everyone in the company is on the same page. No more arguments in meetings over whose numbers are correct.
Your team's time is your most valuable asset. Wasting it on manual report building is a massive hidden cost that kills productivity and slows down critical decisions. Automation gives you that time back.
Unleash Dynamic Scenario Planning
Sure, a static Excel model can run scenarios, but it's often a clunky process of tweaking input cells and trying to see what happens. Power BI makes this interactive and incredibly visual. By creating dashboards with slicers and parameters, you empower your entire leadership team to explore possibilities on their own.
For example, a marketing director can use a simple slider on a dashboard to see the immediate impact of increasing ad spend by 10% or 20%. They can watch how that single change cascades through the entire model, affecting not just leads and sales but profitability and cash flow, all in real time.
This visual interactivity makes complex financial concepts accessible to everyone, no matter their financial literacy. You could build out interactive toggles to answer key business questions like:
- What happens to our gross margin if COGS increases by 5%?
- How does our hiring plan impact operating expenses and runway over the next 18 months?
- What's the break-even point for our new product line based on different pricing tiers?
This takes your financial model from a tool for the finance team and turns it into a strategic asset for the entire business. It fosters a culture of data-driven curiosity and proactive planning. For a deeper look into this process, explore our complete guide on revamping your reporting with Power BI for more advanced techniques.
Prepare for Board Meetings in Minutes, Not Days
Picture this: you have a board meeting tomorrow morning. Instead of a frantic, late-night scramble to update spreadsheets and build a presentation, you simply pull up a live, accurate Power BI dashboard. Every chart is current, every KPI is correct, and you can drill down into any number to answer questions on the fly with complete confidence.
This is the end goal. It's not just about building a model; it's about creating a system that delivers reliable, actionable insights with minimal friction. This is how you unlock true business agility, enabling you to pivot faster, seize opportunities, and navigate uncertainty with a clear view of your financial landscape.
Validate and Automate Your Model for Trusted Decisions
A financial model is completely worthless if you can’t trust the outputs. After all the hard work structuring and connecting your data, this is the final, critical checkpoint. Validation isn't just about hunting for formula errors; it’s about confirming that the model tells a story that actually makes sense in the real world.
The whole point is to stress-test your logic and make sure the numbers reflect business reality. An unvalidated model is just a risky black box. A validated one, on the other hand, becomes a reliable compass for navigating tough decisions. This is how you build a financial model you can confidently bet your business on.
A Practical Checklist for Accuracy
Before you start running scenarios, you need to conduct a thorough audit. This is where you put on your sceptic’s hat and actively try to poke holes in your own work. Trust me, it’s far better for you to find a flaw now than for an investor or a board member to find it later.
Here’s a simple but effective validation checklist I always run through:
- Sense-Check Against Historicals: Does your forecast look like a plausible extension of your past performance? If your model suddenly predicts a 50% jump in revenue with no corresponding change in your sales or marketing drivers, you’ve got a problem.
- Balance the Balance Sheet: This is absolutely non-negotiable. Your total assets must always equal your total liabilities plus equity. If they don't, there’s a fundamental error somewhere in your logic, often in how retained earnings or debt schedules are linked.
- Trace Key Drivers: Pick one key driver—like 'new customer sign-ups'—and follow its journey through the entire model. Watch how it impacts revenue, the cost to serve that customer, and ultimately, your cash balance.
- Test Extreme Inputs: What happens if you set a key driver to zero? If you set new customer growth to zero, your revenue should flatline or decline due to churn. If it doesn’t, a formula is broken somewhere. Simple as that.
Prepare for Uncertainty with Scenario Planning
Once you're confident in the mechanical integrity of your model, it's time to use it to explore the future. The market is unpredictable, but you can prepare for that uncertainty by building out different scenarios. This moves you from a single, rigid forecast to a more realistic range of potential outcomes.
I always recommend building three essential scenarios:
- Base Case: This is your "most likely to happen" forecast, built on your most reasonable assumptions. Think of it as your operational plan.
- Best Case (Upside): This is your optimistic scenario. What happens if that big partnership you've been working on finally closes, or your new marketing channel wildly over-performs?
- Worst Case (Downside): This is the scenario that keeps you up at night. What if a major client churns, or a new competitor drives up your customer acquisition costs? This is your risk-management plan, showing you exactly how much runway you have if things go south.
Scenario analysis isn't about predicting the future with perfect accuracy. It's about understanding the financial impact of different futures so you can prepare your business to be resilient, no matter what happens.
Lock in Reliability with Automation
This brings us back to the most powerful way to build a trustworthy model: automation. While manual validation is crucial, the ultimate way to ensure ongoing accuracy is to remove the primary source of errors—manual data entry.
Connecting your model to a BI tool like Power BI, as we’ve discussed, automates the flow of data from your core systems like Xero, QuickBooks, or your CRM. This automation is what transforms your financial model from a one-time project into a continuously reliable decision-making tool.
It eliminates the hundreds of hours spent on manual updates and, more importantly, it eliminates the inevitable mistakes that creep in during that tedious process. When your historical data and key operational metrics refresh automatically, your base case is always grounded in the most current reality. This frees you up to focus your energy on strategy and adapting to change, not chasing down data entry errors.
Is your team still spending too much time fixing errors and not enough time planning for the future? See how Vizule can help automate your reporting stack and build a financial model that gives you complete confidence in your numbers.
How to Use Your Financial Model for Strategic Growth
So, you've done the hard work. You’ve wrestled that messy spreadsheet into a validated, automated financial model. Congratulations. But building the model is just the start—the real value comes from using it to make smarter, faster decisions that actually drive growth.
You’ve officially moved beyond the chaos of static reports and out-of-date numbers. What you have now is a powerful tool. It’s time to put it to work.
Set Smarter Budgets and Align Your Team
A dynamic financial model completely changes the game for budgeting. What was once a painful annual chore can become a continuous, strategic conversation. Forget just adding a few percentage points to last year's numbers. Now, you can build a budget from the ground up, tied directly to your core business drivers.
For instance, your model gives you direct answers to critical questions like, "To hit our $5 million revenue target, exactly how much do we need in marketing spend and how many salespeople do we need to hire?"
This driver-based approach makes your budget a realistic operational plan, not just a financial document collecting dust. It gets everyone on the same page—from marketing and sales to operations—all working toward a single set of interconnected goals.
Your financial model becomes the single source of truth. It translates high-level company objectives into specific, departmental targets and finally ends the siloed planning that holds so many businesses back.
Proactively Manage Your Cash Flow
For any founder or operator, cash is king. There's no better tool for proactive cash flow management than a financial model connected to your live data. You can spot potential shortfalls months in advance, which gives you plenty of time to react.
Instead of getting blindsided by a low bank balance, you can use your model to stress-test decisions before you make them.
- Test hiring decisions: See the immediate impact of bringing on three new engineers on your monthly burn rate and cash runway.
- Model payment terms: Analyze how shifting customer payment terms from 30 to 60 days will affect your cash position over the next two quarters.
- Plan for capital expenditures: Figure out precisely when you can afford that new piece of equipment without putting the business at risk.
This kind of foresight is a massive competitive advantage. It's what allows you to navigate uncertainty with confidence. We explore more of these practical applications in our guide on how to boost SME profitability with data-driven financial modelling.
Secure Investor Funding with Confidence
When you walk into an investor meeting, they are going to pick your numbers apart. An automated, driver-based financial model is your best defense and your greatest asset. It proves you have a deep, sophisticated understanding of how your business actually works.
You can confidently answer the tough questions and even model different scenarios live in the meeting. Show them exactly how their investment will impact growth drivers and KPIs. This builds incredible credibility and shows you're a founder who manages by the numbers. You’re not just selling a story; you’re presenting a data-backed plan for executing it.
Your Top Financial Modeling Questions, Answered
Building your first real financial model can feel like a huge hurdle. It's a journey every founder and operator goes through. Here are the honest answers to the questions we get asked most as we help clients move from spreadsheet headaches to genuine, data-driven clarity.
How Long Does It Take to Build a Financial Model?
Honestly? It depends. A simple model for an early-stage startup, maybe just focused on cash runway and some basic revenue projections, could be knocked out in a few days.
But for a more established business with multiple product lines, tangled cost structures, and years of historical data to wrangle? You're likely looking at 1-3 weeks to build, test, and truly validate it. The real time-saver isn't just experience, but a smart, modular approach. And integrating a tool like Power BI to automate the data feeds from your other systems is a game-changer, slashing both build time and ongoing upkeep.
Can I Build a Model Without a Finance Degree?
Absolutely. You don't need to be a CPA. What you do need is a deep, almost obsessive understanding of how your business actually works. We always teach financial modeling by focusing on business logic, not accounting jargon.
The best financial models are built to answer clear business questions, not to show off complex formulas. The whole point is to create a tool that feels intuitive to you—the person who has to make the tough calls.
It’s all about translating your operational knowledge into a logical structure. What really drives your sales? What impacts customer churn? Where are the hidden costs? That's the stuff that matters.
What Is the Biggest Mistake People Make?
Hands down, the most common and costly mistake is jumping straight into Excel and building formulas without first figuring out the key business questions the model needs to answer. I see it all the time. This "build-first, think-later" habit almost guarantees you'll end up with a monster of a spreadsheet that's rigid, impossible to audit, and ultimately, untrustworthy.
A close second is hard-coding your assumptions and drivers directly into formulas. It's a classic rookie error that makes scenario planning a nightmare. It turns what should be a dynamic, flexible tool into a static, useless report.
How Often Should I Update My Financial Model?
Think of your model as a living, breathing part of your business, not a dusty report you create once a quarter. This is where automation really proves its worth.
By hooking your model up to Power BI and automating the data feeds from your accounting software (like Xero or QuickBooks) and CRM, your core historical data can be refreshed daily or weekly without you lifting a finger. Then, your job is to schedule time—maybe monthly or quarterly—to review and tweak your strategic assumptions. These are the drivers you actually control, and you should revisit them anytime something major happens in the business.
Ready to stop guessing and start making decisions with confidence? The team at Vizule specializes in building the exact kind of automated, driver-based financial models we've discussed. We help founders and operators connect the dots in their data, unlock insight-led decision-making, and drive strategic growth.


