


A data strategy is a straightforward plan for how your business will gather, manage, and use information to achieve its goals. Forget the idea of a dense, technical document. Think of it as a business plan for your data—the critical link between your company's biggest ambitions and the daily decisions you make to get there.
For a small or medium-sized business, a data strategy isn't a "nice-to-have"; it's the foundation for scalable growth. It's how you move from gut-feel decisions to confident, insight-led action.
Why Your Business Needs a Data Strategy Now

If you're running a small or medium-sized business, "data strategy" might sound like something reserved for corporations with massive IT budgets. In reality, it’s the SMBs navigating tight resources and fierce competition that often need one the most.
Without a clear plan, data quickly becomes a source of frustration, not a competitive edge.
You're probably feeling the symptoms already: endless hours spent manually wrestling with spreadsheets, conflicting reports from different departments, and that nagging uncertainty about which numbers to trust. It's the chaos of trying to make your accounting software talk to your sales CRM, leaving you guessing about true profitability and performance.
From Data Chaos to Strategic Clarity
The daily grind without a data strategy is a familiar story for many SMBs. It's a cycle of manual work, conflicting numbers, and missed opportunities. In contrast, implementing a clear strategy brings automation, alignment, and actionable insights.
Here’s a look at what that transformation means for your day-to-day operations:
| Symptom of Data Chaos | Benefit of a Data Strategy |
|---|---|
| Hours wasted manually updating spreadsheets every week. | Automated reports that are always up-to-date. |
| Sales and finance teams arguing over whose numbers are "right." | A single source of truth everyone trusts. |
| Making critical business decisions based on gut feelings. | Decisions backed by real-time performance metrics. |
| Uncertainty about which products or clients are truly profitable. | Clear visibility into the true drivers of growth. |
| Inconsistent data makes it impossible to scale processes reliably. | A solid foundation for repeatable, scalable success. |
A data strategy cuts through the noise. It’s how you finally connect the dots between what your business is doing and where it's actually going.
From Storage to Strategy
The whole idea of a data strategy has come a long way. Back in the day, the focus was just on storing data efficiently. Today, it's a much more active, forward-looking discipline.
Modern data strategies are built around data governance, quality control, and advanced analytics. With AI becoming a standard part of business, a solid strategy is essential to get any real value from these powerful tools. It's not just about having the tech; it's about having a plan for it.
A well-designed strategy is also crucial for unlocking insights with customer experience analytics, helping you understand your clients on a much deeper level.
Ultimately, a data strategy is the roadmap that transforms your data from a chaotic liability into your most valuable asset. It’s the key to unlocking consistent, insight-led growth and achieving genuine data-driven decision-making.
The Four Pillars of a Practical Data Strategy
Building a robust data strategy isn't about complexity; it's about clarity. When founders hear "data strategy," they often picture thousand-page documents and eye-watering software bills. That's not the reality for smart SMBs.
These four pillars are easy to remember and perfectly manageable for businesses with limited resources. When you get them right, chaotic spreadsheets transform into clear, actionable dashboards.
Think of it like a hierarchy. Your overall 'Data Strategy' sits at the top, guiding everything underneath it: Data Sources, Data Management, Technology, and People.
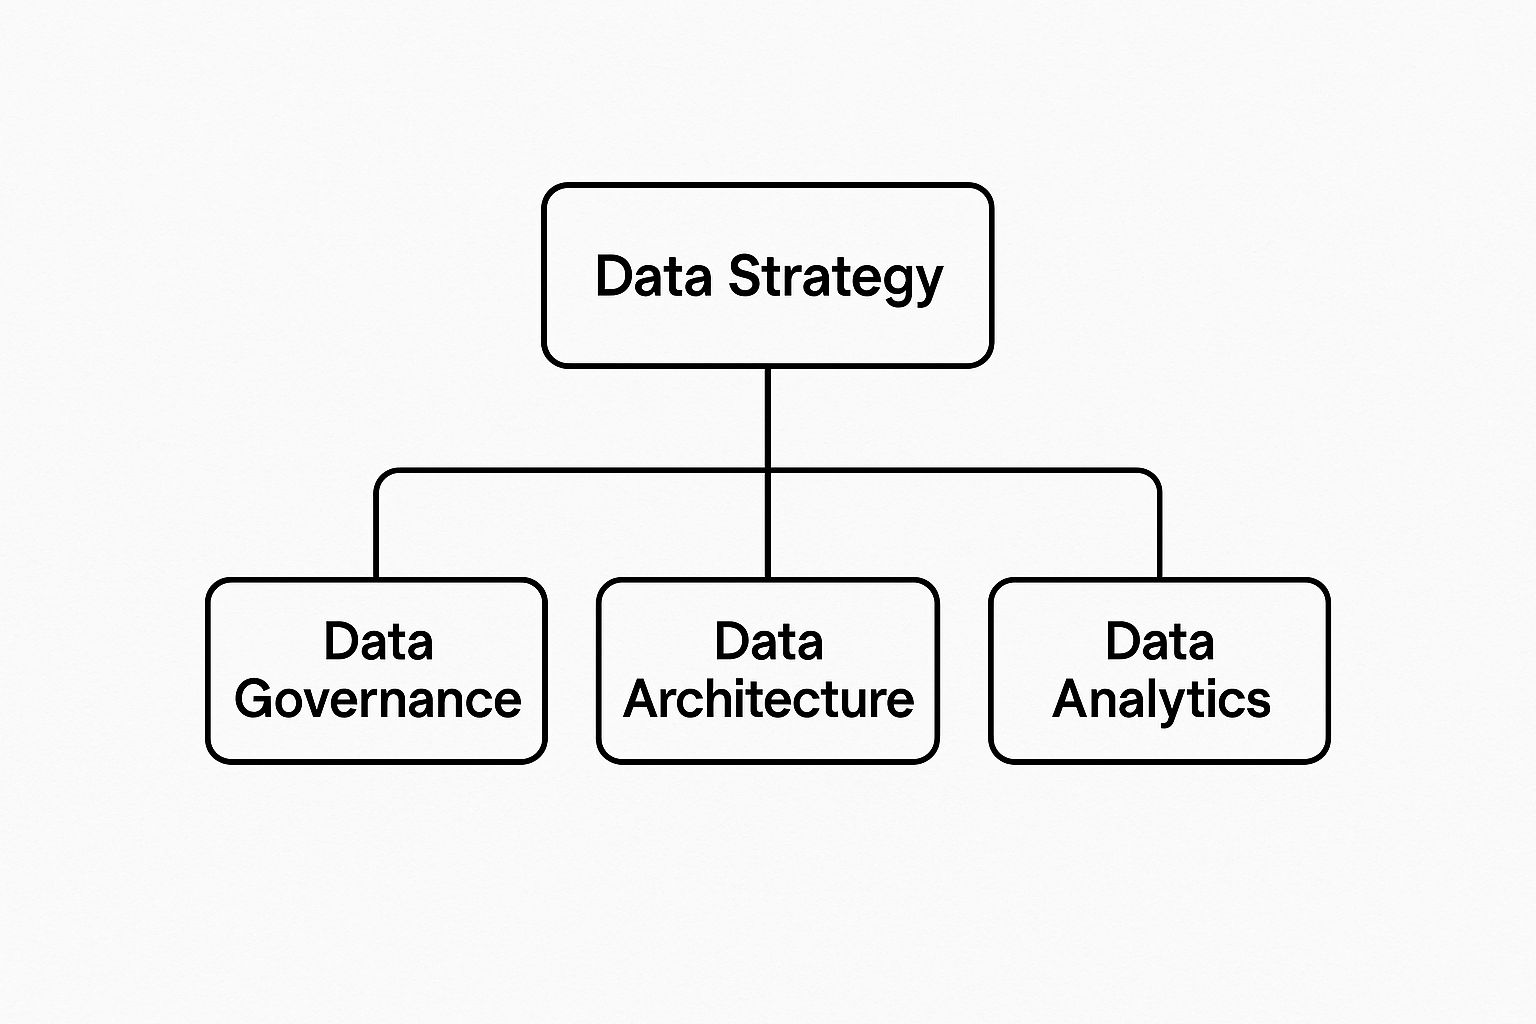
This diagram makes it clear: these pillars aren't separate projects. They must align under one unified strategy to create real business value.
Data Sources
The first pillar is all about answering one question: where does your critical information live? For most businesses, it’s scattered everywhere. Examples include:
- Financials in Xero or QuickBooks
- Sales Data in your CRM (e.g., HubSpot, Pipedrive)
- Marketing Analytics from Google Analytics or social media
- Operational Data from project management or inventory systems
The trick is to start by asking what business questions you need to answer. Forget the data for a second and focus on the problems. For instance:
- Which marketing channel gives us the highest ROI?
- What are our most profitable product lines?
- How long is our average sales cycle, really?
- When do our expenses always seem to spike during the month?
These questions act as a filter. They guide you to connect and pull only the information that truly matters instead of trying to boil the ocean.
Data Management
Clean, reliable data builds trust. And trust leads to faster, better decisions. This pillar is about establishing the ground rules for your data. Think of it as quality control. Key practices include:
- Define Key Metrics: Ensure everyone agrees on what "customer churn" or "qualified lead" actually means.
- Automate Quality Checks: Set up simple rules to spot missing or incorrect values before they derail your reports.
- Establish Access Levels: Control who can see and edit sensitive data, ensuring information security.
Tip: Create a simple data dictionary in a shared document. Listing your top 10-15 business metrics and their exact definitions can prevent countless hours of confusion and debate down the line.
Regularly reviewing these rules is crucial. For one client, an automated check flagged a misnamed field that was causing chaos, preventing $5,000 in duplicate billing errors. That's the power of good data management—your dashboards stay accurate even as the business evolves.
Technology
Choosing the right tools is about centralizing your data without breaking the bank. It's easy to get overwhelmed by options, but for most SMBs, the choice comes down to moving from manual spreadsheets to an automated BI platform.
| Feature | Excel | Power BI |
|---|---|---|
| Data Refresh | Manual copy-and-paste | Scheduled or live |
| Data Limits | ~1 million rows per sheet | Tens of millions of rows |
| Cost Impact | Hidden labor costs in hours | Low monthly subscription |
| Dashboards | Static charts | Interactive, drill-down visuals |
A tool like Power BI is more than a dashboarding tool; it's an automation engine. It includes Power Query, which allows you to clean, merge, and transform data without writing a single line of code.
For example, you can build a workflow that automatically connects to your sales data, removes rows with missing deal values, and merges it with marketing spend—all on a daily schedule. This is how you reclaim hours from manual data prep. Power BI also integrates seamlessly with common tools like QuickBooks and Google Analytics, letting you pull everything into one central place for a complete view of the business.
People and Culture
Numbers on a screen are meaningless until your team is ready and willing to use them. This final pillar is often the most important. It's about fostering a culture of curiosity and establishing clear ownership over your data.
Here’s a simple, three-step approach:
- Define Roles: Who is responsible for data quality? Who analyzes it? Who presents the reports?
- Train Your Team: Run quick workshops showing your team how to read a dashboard and ask insightful questions based on what they see.
- Make It Routine: Weave data into your regular team meetings. When leadership consistently references dashboards to make decisions, everyone else follows suit.
"Our ops team started making suggestions based on dashboard insights within days of us rolling it out."
— CFO at a mid-sized retailer
Building this data-informed culture is what guarantees long-term success. When people trust the numbers, they start using them to drive the business forward.
A Step-by-Step Roadmap to Build Your Data Strategy

It’s easy to talk about being “data-driven,” but much harder to build a practical plan that works without bogging down a small team.
We've designed this simple, five-step roadmap for busy founders and operators. It cuts through the noise and focuses on a logical path that gets you results, fast.
Step 1: Start With Your Business Questions
The single biggest mistake businesses make is collecting data for the sake of it. A winning strategy never starts with technology—it starts with the burning questions you need answers to.
Before you touch a spreadsheet, get your team together and define what you really need to know to move the business forward.
Focus on questions that hit the bottom line: revenue, costs, and customer value. Think along the lines of:
- Which marketing campaigns are bringing in our most profitable customers, not just the most leads?
- What’s our actual Customer Lifetime Value (CLV) after accounting for support costs?
- Where are deals getting stuck in our sales pipeline?
When you start with questions, your entire strategy becomes laser-focused on solving real-world problems.
Step 2: Audit Your Current Data and Tools
Now you know what you need to answer. So, where is all that information hiding? For most SMBs, the answer is everywhere—scattered across a dozen platforms that don’t speak to each other.
It's time for a simple inventory. A basic spreadsheet is perfect for this.
- Financial Data: QuickBooks, Xero, Stripe
- Sales & CRM Data: HubSpot, Salesforce, Pipedrive
- Marketing Data: Google Analytics, social media accounts, Mailchimp
- Operational Data: Asana, inventory systems, Zendesk
This process will almost certainly expose serious gaps and highlight the manual workarounds your team relies on. This is the "aha!" moment when many founders realize their trusty friend, Excel, has officially become the bottleneck holding the business back.
Step 3: Design Your Data Architecture and Pipelines
This step sounds intimidating, but for an SMB, it’s really just about drawing a map. The goal is to plan how data will get from those different sources into one central place where you can actually analyze it.
This is where you design your single source of truth. For some, that might be a data warehouse. But more often, a business intelligence tool like Power BI that can pull everything together is the right move. Our guide on how to build a data pipeline dives deeper into the mechanics here.
The name of the game is automation. A smart architecture gets rid of manual data pulls and copy-paste reporting. It frees up your team to find insights instead of drowning in data entry.
Your map should also show how often data needs to be updated. Maybe financial data is refreshed daily, but website traffic is pulled in every hour. This keeps everyone working with information that’s both fresh and relevant.
Step 4: Establish Simple Governance Rules
Data governance is a fancy term for making sure your data is accurate, consistent, and safe. For a small business, this isn't about creating a hundred-page manual. It's about setting some basic rules of the road.
Start with these three areas:
- Access Control: Decide who gets to see, edit, and share what. Your finance team needs the full P&L, but the marketing team might just need to see campaign spend.
- Data Definitions: Create a simple dictionary for your key metrics. When you say "active user" or "customer churn," what does that actually mean? This stops different departments from using the same words to talk about different things.
- Security Protocols: Outline how you protect sensitive information. You can find excellent information security policy templates to give you a solid starting point.
Step 5: Launch a Pilot Project and Iterate
Don't try to boil the ocean. Instead of tackling every data problem at once, pick one small, high-impact project to start with. This gets you a quick win, builds momentum, and lets you learn as you go.
A perfect first project is often automating a single, critical report that everyone hates putting together manually.
For instance, focus on building an automated cash flow dashboard in Power BI. It solves a massive pain point, shows off the power of automation, and delivers immediate value to leadership. By starting small, you build trust and get a tangible win on the board, making it much easier to get support for bigger data projects down the line.
Avoiding Common Traps That Derail SMBs
Knowing the steps is one thing. Actually pulling it off is another. Many promising data initiatives stumble, not because the goals are wrong, but because of a few common, predictable traps that turn initial excitement into frustration.
If you know what these traps are ahead of time, you can steer clear of them.
The Tool Trap: Buying Software Without a Problem
First up is the most common pitfall: the 'Tool Trap'. This is the siren song of shiny software purchased before anyone has clearly defined the business problem it's supposed to solve. A slick sales demo can make any tool look like a magic wand, but technology without a clear purpose is just an expensive distraction.
The rule is simple: Strategy must always come before software. Your business questions—like "How can we reduce customer churn?"—should dictate the tools you choose, not the other way around.
This tech-first mentality is a huge reason why so many data projects fail. Digital transformation efforts have a global success rate of only about 35%. A big driver of this is the complexity of juggling too many tools. The average organization uses 5 to 7 different data platforms, and 70% of data leaders say it's causing major headaches. You can discover the latest insights on data transformation challenges to see the full picture.
The Boiling the Ocean Fallacy
The second major hurdle is what we call 'Boiling the Ocean'. This is what happens when a business gets so excited that it tries to track and analyze everything all at once. Every data source gets connected, dozens of dashboards are built, and every metric imaginable is collected.
The result isn't clarity; it's chaos. Your team gets buried under a mountain of information, making it impossible to spot the critical signals in the noise.
The fix? Start small and be ruthlessly focused.
- Identify One Core Problem: Pick a single, high-stakes area to start with, like sales pipeline analysis or marketing ROI.
- Define 3-5 Key Metrics: Choose just a handful of metrics that directly measure success for that specific problem.
- Build One Focused Dashboard: Create a single view that answers only the questions related to that one problem.
This approach gets you a quick win and proves the value of your strategy.
The Silo Snag: Disconnected Data Systems
Finally, there's the 'Silo Snag'. This is a classic operational headache where your critical data is locked in separate systems that don't talk to each other. Your finance data is in QuickBooks, your sales data is in your CRM, and your marketing data is in Google Analytics.
Because these systems are disconnected, you can never get a complete picture of the business. You can see how much you spent on a marketing campaign, and you can see how many new customers you signed up. But you can't easily connect the two to calculate your true customer acquisition cost.
A huge part of a real data strategy is breaking down these walls. The goal is to create a single, unified view that connects finance, sales, and operations. This is how you finally move from just guessing to actually knowing.
How Power BI Brings Your Data Strategy to Life
A data strategy is just a document until you have the right engine to power it. This is where a business intelligence tool like Microsoft Power BI steps in, turning your high-level goals into tangible, day-to-day reality.

Think of Power BI as the platform that executes your strategy. It’s the bridge between the big business questions you’ve defined and the daily decisions your team makes. It connects the dots, automates the grunt work, and puts actionable insights directly into the hands of the people who need them most.
From Siloed Systems to a Single Source of Truth
The first and most critical role Power BI plays is that of a central connector. Your business data is likely scattered across systems that don't talk to each other: sales figures in a CRM, financials in QuickBooks, and website traffic in Google Analytics.
Power BI connects directly to these disparate sources, pulling all that information together into a single, unified data model. It demolishes the silos that cause so much confusion. Suddenly, sales and finance are looking at the same numbers, from the same place, updated on the same schedule.
This unified view becomes your single source of truth—an essential foundation for any successful data strategy. When everyone trusts the numbers, the conversation shifts from arguing about whose data is right to deciding on the best course of action.
This integration isn't just a one-time thing. Power BI automatically refreshes the data, ensuring your reports are always current without anyone ever having to manually copy and paste information again.
Automating the Flow From Raw Data to Actionable Insight
A huge part of a data strategy is replacing hours of manual report building with automated, interactive dashboards. This is where Power BI truly shines for SMBs. That endless cycle of exporting CSVs, cleaning them in Excel, and building static charts isn't just time-consuming; it’s a bottleneck that slows down your decision-making.
Power BI automates this entire workflow:
- Connect: It establishes live connections to your key data sources.
- Transform: Using its built-in tool, Power Query, it cleans and shapes raw data based on rules you set up just once.
- Model: It creates relationships between different datasets, so you can see how marketing spend directly impacts sales revenue.
- Visualize: It presents information in interactive dashboards where you can drill down into details, filter by date or product, and explore the data for yourself.
This process turns reporting from a backward-looking chore into a forward-looking strategic activity. For a deeper dive, our guide can help you unlock big wins with Power BI.
Turning Metrics Into Meaningful Decisions
Finally, Power BI brings your strategy to life by making key metrics visible and accessible to everyone on your team. When KPIs like customer acquisition cost (CAC), cash flow, and operational efficiency are displayed on a clear dashboard, they become part of the daily conversation.
This visibility fosters a culture of accountability. An operations manager can spot a supply chain bottleneck before it becomes a crisis. A marketing manager can quickly reallocate budget from an underperforming campaign to one that’s delivering a higher return.
By transforming abstract goals into concrete, visual metrics, Power BI empowers your team to make smarter, faster decisions every single day.
Frequently Asked Questions About Data Strategy
Diving into a data strategy often raises practical questions. Below are the top FAQs we hear from founders and SMB leaders—answered in plain English to help you move forward with confidence.
How Much Does a Data Strategy Actually Cost For An SMB?
This question tops every list, and the good news is: it’s far more affordable than you might think. The real expense isn’t the tools—it's the hidden cost of operating without a plan: wasted hours on manual reports, flawed analysis, and missed growth opportunities.
Here’s a typical SMB investment breakdown:
- Tools: Power BI Pro is highly affordable and handles data integration, transformation, and visualization in one place.
- Expertise: Instead of hiring a full-time, six-figure data scientist, partner with a consultancy like Vizule for fractional access to seasoned analysts who can get you set up fast.
You’re building a foundation that often pays for itself through automation and smarter decision-making within the first few months.
How Quickly Can I Expect To See Real Results?
You don’t need to wait a year for payback. By focusing on a small, high-impact problem, you can see meaningful change in 30 to 60 days.
For example, one of our e-commerce clients was spending 15 hours each month manually building sales and inventory forecasts in Excel. We delivered an automated Power BI dashboard tied to their Shopify and warehouse data—cutting that process to zero in under six weeks. Their operations manager reclaimed those hours to optimize stock levels instead of wrestling with formulas.
The first victories usually come from time savings. Deeper insights—like identifying your most profitable customer segments—follow quickly.
Can’t I Just Keep Using Excel?
Excel is incredible—until it isn’t. You’ve likely hit the tipping point if you recognize these signs:
- Version Control Chaos: Your inbox overflows with files named “Financials_v3_Final_JohnsEdits.xlsx.”
- Manual Overload: Key people spend hours copying and pasting between sheets.
- Data Integrity Issues: One broken formula can skew your entire report for weeks.
- Scalability Limits: Spreadsheets slow to a crawl, crash, or simply can’t handle growing data volumes.
Moving from Excel to a dedicated BI tool like Power BI is more than an upgrade—it’s moving from manual wrangling to automated business intelligence. That’s how you lay the groundwork for real, sustainable growth.
Do I Need To Hire A Data Scientist?
Not at all, especially at first. A data scientist excels at advanced modeling and predictive algorithms. Your initial need is simpler: someone who understands your business and knows how to turn raw data into actionable reports.
Look for a BI consultant or data analyst—a professional who can:
- Connect your data sources
- Build automated dashboards
- Visualize the key metrics that drive your decisions
Hiring a full-time data scientist this early is often overkill. The Data Intelligence and Analytics market is projected to grow from $409 billion in 2024 to $876.6 billion by 2029. Learn more about the data market’s rapid expansion. This surge is all about making data tools more accessible, not more complicated.
Ready to stop wrestling with spreadsheets and start making insight-led decisions? The team at Vizule can help you map out a practical data strategy and build the automated reporting dashboards you need to scale with confidence.
Book your free BI consultation today and see how quickly you can turn your data into your most powerful asset.


