


A data strategy roadmap isn't just a technical document for your IT team; it’s a business plan that connects your growth goals to the data you need to achieve them. For founders and operators drowning in spreadsheets, it’s the blueprint for turning siloed, messy information into your most valuable asset. It answers three critical questions: what data initiatives to focus on, when to tackle them, and why they matter to your bottom line.
If you’re ready to move from gut-feel decisions to data-driven growth, this guide will show you how.
Why Your SMB Can't Afford to Ignore a Data Strategy Roadmap
Are you staring at a mess of spreadsheets and conflicting reports from different departments? It’s a common story for growing businesses. You hit a wall not because of your product or team, but because your data is in chaos.
You’re probably feeling the friction already. Finance reports don't quite match the sales figures from your CRM. The operational dashboards are always a week out of date. And major decisions still rely more on gut instinct than hard numbers.
This is exactly where a data strategy roadmap becomes your most critical tool for scaling smart. It’s a practical plan for transforming that chaos into clarity, giving you a serious competitive edge. This isn't an exercise for massive corporations; it’s a vital plan for founders who want to stop guessing and start using data for profitable growth.
From Excel Chaos to Insight-Led Decisions
A well-designed roadmap cuts right to the heart of the real-world problems holding your business back. This is about more than just technology—it's a business plan focused on tangible outcomes.
A solid roadmap solves common headaches for SMBs:
- Aligning Teams: It gets finance, sales, and operations on the same page by creating a single source of truth for all your key performance indicators (KPIs). No more debating whose numbers are correct.
- Automating Tedious Reporting: You can eliminate the hours your team wastes manually exporting data from different apps and patching together weekly reports, freeing them up for high-value analysis instead.
- Building Trust in Your Numbers: By establishing clear rules and processes, you ensure your data is accurate, consistent, and reliable. That means you can finally make strategic decisions with confidence.
- Enabling Scalable Growth: It helps you build a data foundation that grows with your business, preventing the reporting bottlenecks that stall progress right when things are getting good.
This structured approach is the key to unlocking the true value hiding in your business data. While the global data analytics market is projected to hit $132.9 billion by 2026, just buying the right tools isn't enough. Many digital projects fail because they lack a clear strategy for integration and user adoption. A roadmap ensures your investment in tools like Power BI actually translates into measurable business outcomes.

The Four Pillars of a Successful Roadmap
To get you from where you are now (the chaos) to where you want to be (clarity and growth), every good roadmap is built on four core phases. This structure demystifies the process and gives you a clear path forward.
Below is a quick look at the journey. We start with an honest assessment of the current situation, design a better future, establish the rules for trusted data, and then roll it out in a way that delivers value fast.
| Key Phases of a Data Strategy Roadmap |
| :— | :— |
| Phase | Primary Goal for Your Business |
| Diagnostics | Get an honest assessment of your current data reality, identifying pain points and defining the critical business questions you need to answer. |
| Architecture | Design your future-proof data hub—often moving from Excel to Power BI—to create a centralized, reliable system for reporting. |
| Governance | Establish simple rules for data quality and consistency to build trust across the organization. |
| Rollout | Implement a phased plan that delivers quick wins and fosters a culture of data-driven decision-making. |
Each of these stages builds on the last, creating a logical progression from chaos to clarity. It’s a proven framework that turns a daunting project into a series of manageable, high-impact steps.
Phase 1: Diagnosing Your Current Data Reality
Before you can build a roadmap to your data future, you need an honest map of where you stand today. This isn't a dry technical audit. It's a commercial deep dive into how data—or the lack of it—truly impacts your daily operations and strategic goals.
For many growing businesses, this is the first time they’ve formally stepped back to assess the real cost of their "Excel chaos."
The process kicks off by identifying the critical business questions your data should be answering, but isn't. Think about your last leadership meeting. What numbers did you wish you had at your fingertips? What questions were met with a vague, "we'll have to get back to you on that"? Those gaps are the real starting point for your entire data strategy.
Mapping Your Data Sources and Silos
Next, you have to map out all your existing data sources. This exercise often reveals a surprisingly fragmented landscape. Most SMBs find that vital information is scattered across a dozen different places—from accounting software like Xero or QuickBooks to your CRM, e-commerce platform, and various marketing tools.
And then there are the spreadsheets. We call them the unofficial data warehouses of the small business world. These countless, disconnected files often hold your most critical business logic hostage, making a single, unified view of performance nearly impossible.
A key goal here is to pinpoint the exact sources of friction. Where do manual processes break down? Where are teams spending hours copying and pasting data just to create a basic weekly report? These bottlenecks aren't just inefficient; they are direct barriers to growth.
This mapping exercise helps you visualise where your information is siloed. When sales data in HubSpot doesn't talk to your financial data in Xero, you can't easily calculate customer lifetime value or profitability by channel. Identifying these disconnects is the foundational first step.
Uncovering the Real Pain Points
Technology and data sources are only half the picture. The real insights come from talking to the people who use—or struggle to use—this data every single day. Interviewing your key stakeholders is non-negotiable.
Sit down with your heads of finance, sales, marketing, and operations. Listen to their frustrations firsthand. You'll hear stories of spending entire Mondays building reports instead of analysing them, making crucial budget decisions based on outdated numbers, and a fundamental lack of trust in the data itself.
To guide these conversations, ask targeted questions:
- What decisions do you delay because you can't get the right data? This uncovers the massive opportunity cost of poor data access.
- Which reports are the most time-consuming to create? This immediately highlights prime candidates for automation.
- When was the last time two different reports showed conflicting numbers for the same metric? This points directly to issues with data definitions and consistency.
- How confident are you in the accuracy of the data you use? This gauges the level of trust—a critical factor for getting anyone to actually use the new system.
These discussions almost always reveal pervasive data quality issues—inconsistent naming conventions, duplicate entries, or missing information. These aren't just minor annoyances; they erode trust and waste an incredible amount of valuable time. Understanding and documenting these problems is a critical first step, and you can learn more about how to address them by exploring ways to improve data quality systematically.
By the end of this diagnostic phase, you won't just have a list of systems. You'll have a prioritised list of real business challenges that a robust data strategy can solve, directly linked to operational pain and strategic goals. This clear "current state" analysis becomes the bedrock for every other step on your roadmap.
Phase 2: Designing Your Future-Proof Data Hub
With a clear, honest picture of your current data reality, it's time to design the future. This architecture phase is where you lay the technical foundation to support your business goals. For most growing businesses, this means moving away from fragile, error-prone Excel models and toward a modern, centralised data hub.
The goal is to create a single source of truth—a reliable, central place where all your business data lives. It needs to be clean, organised, and ready for analysis. Think of it as the engine that powers fast, trustworthy financial and operational reporting.
Building this hub isn't about buying the most expensive software. It's about designing a simple, effective system that connects your disparate data sources and turns them into a powerful asset. The focus is always on the outcome: accessible insights that drive your business forward.
Core Components of a Modern Data Stack for SMBs
A modern data hub acts like an assembly line. Raw materials (data from your apps) come in one end, get processed and refined in the middle, and emerge as a finished product (like an interactive Power BI dashboard) at the other end.
Here are the essential components:
- Data Integration Tools: These are the connectors that automatically pull data from all your different systems—your CRM, accounting software, marketing platforms, and even spreadsheets. This step completely replaces the soul-crushing manual work of exporting CSVs.
- A Central Data Warehouse: This is the heart of your hub. It's a specialised database designed to store all your integrated data in a structured, analysis-ready format. This is where you solve annoying issues like inconsistent naming conventions and create clean, reliable datasets.
- Business Intelligence (BI) Platform: This is the final, user-facing layer. A tool like Power BI connects directly to your data warehouse and transforms the clean data into interactive dashboards, KPI reports, and financial models. It’s how your team explores the data and finds the answers they need, without ever touching a spreadsheet.
The financial upside of getting this right is huge. Organisations with strong data integration achieve a 10.3x ROI compared to just 3.7x for those with poor integration. A solid, integrated architecture is absolutely critical for turning raw data into something valuable.
Visualising the Data Flow
To demystify the tech talk, it helps to see how data moves through this modern stack. The process flow is surprisingly straightforward, taking raw inputs and turning them into actionable intelligence.
This infographic shows a high-level view of how we map out the key questions, sources, and pain points during the diagnostic phase.
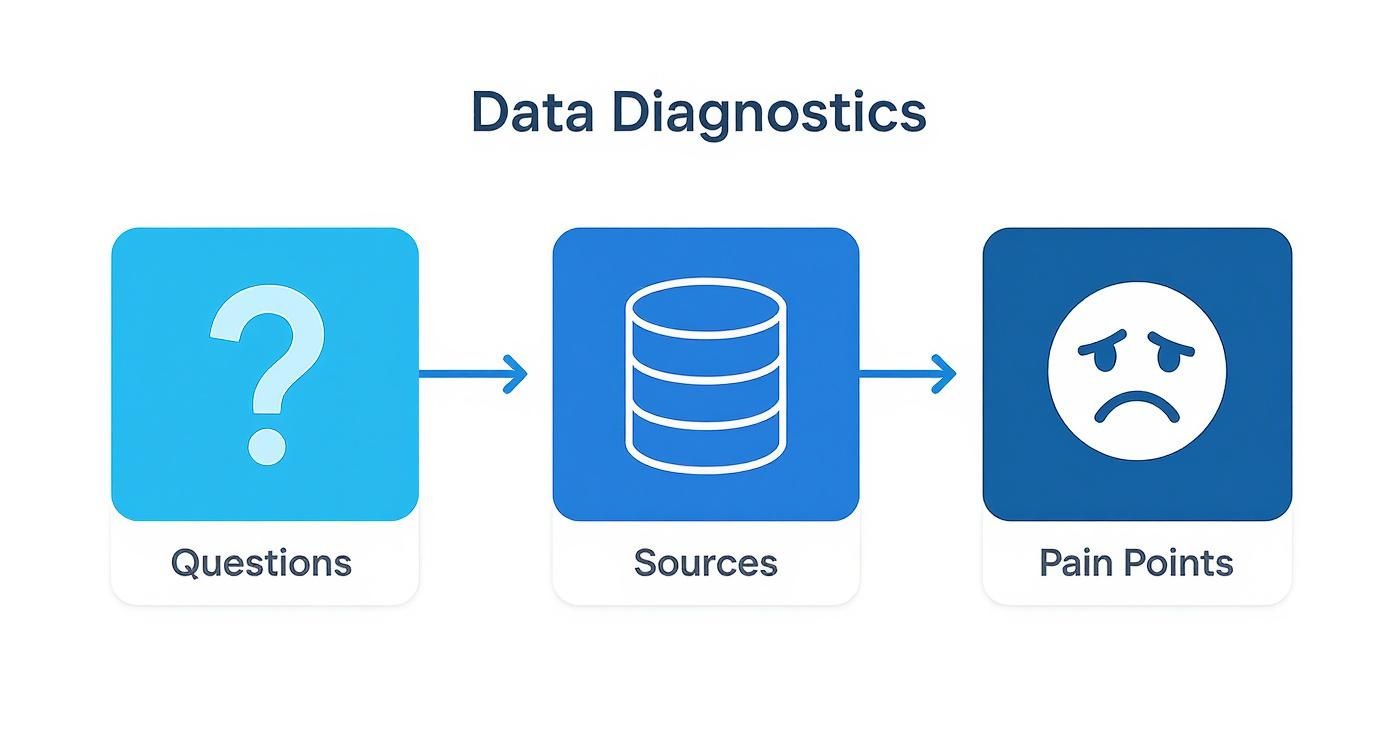
This process ensures the architecture we design is directly tied to solving the most pressing business challenges your team identified.
Practical Considerations for SMBs
As you design this data hub, understanding the principles behind it is key. You can explore critical database design best practices to get a sense of what goes into building a solid foundation. But for founders and operators, it really boils down to balancing three main factors.
Your goal isn't to build a system that rivals Amazon's. It's to build a system that solves your problems, fits your budget, and is easy for your team to use.
Here's how to think about it:
- Cost vs. Scalability: Start with tools that offer flexible, usage-based pricing. Cloud-based data warehouses and BI platforms like Power BI allow you to begin small and scale your investment as your data volume and user base grow. Avoid getting locked into expensive, long-term contracts for features you don't need yet.
- Ease of Use: Choose platforms with user-friendly interfaces. The ultimate goal is to empower your non-technical team members to do their own analysis. A system that requires a team of developers to maintain is counterproductive for a growing business.
- Future-Proofing: While you're starting small, design the architecture with growth in mind. Make sure the system can easily accommodate new data sources as your business expands. A little foresight here prevents you from having to rebuild everything from scratch in two years.
This architecture phase is the most technical part of your data strategy roadmap, but it's driven entirely by your business needs. By focusing on creating a simple, scalable, and user-friendly data hub, you lay the groundwork for a truly data-driven organization.
Phase 3: Establishing Simple Rules for Trusted Data
You can build the most powerful data hub in the world, but it’s useless if nobody trusts the numbers. This is where data governance comes in. It’s about establishing simple, clear rules and processes to ensure your data is accurate, consistent, and secure.
For many SMB founders, the term "data governance" sounds corporate, intimidating, and expensive. It doesn't have to be.
In reality, it can start with a few practical steps that have an immediate impact on your team's confidence in the data. It’s how you finally move from operating on "I think" to "I know." The point is to build a shared understanding across the business, starting with one of the most common—and damaging—problems: teams using different definitions for the same crucial metric.
Creating a Shared Business Language
How does your company define "Net Revenue"? Does the sales team’s calculation match what finance uses? If not, you have a governance problem. The first step is to create a simple data dictionary. This sounds technical, but it’s just a document where everyone agrees on and writes down the plain-English definitions for your most important business metrics.
This is a non-technical exercise that delivers huge value. Start by defining your top 5-10 KPIs:
- Customer Acquisition Cost (CAC): What specific marketing and sales expenses are included? Get granular.
- Customer Lifetime Value (LTV): Over what time period is this measured? How are repeat purchases factored in?
- Active User: What specific action must a user take within a given timeframe to be considered ‘active’?
Once you have definitions, assign clear ownership for each key data asset. Your Head of Sales, for example, becomes the official owner of all CRM data. This isn't about playing the blame game; it's about creating accountability. When someone is responsible for the quality of a dataset, that quality almost always improves.
You can dive deeper into these foundational principles in our detailed guide on creating a data governance strategy.
Tackling Common Data Quality Issues
With clear definitions and ownership in place, you can start squashing the practical data quality issues that erode trust. These are the everyday annoyances that force your team to spend hours cleaning data instead of actually analysing it.
We've all seen them:
- Duplicate Records: Multiple entries for the same customer in your CRM.
- Inconsistent Formatting: Dates written as "01-12-2024" in one system and "Dec 1, 24" in another.
- Missing Information: Incomplete customer addresses or missing lead sources that make attribution impossible.
Setting up simple validation rules in your source systems can prevent many of these headaches from happening in the first place. This slowly but surely builds a strong foundation for data integrity.
For smaller businesses, even a few straightforward actions can make a massive difference in data quality and team confidence.
Simple Data Governance Actions for SMBs
| Action Item | Business Benefit |
|---|---|
| Create a Basic Data Dictionary | Ensures everyone is speaking the same language when discussing key metrics like revenue or customer churn. |
| Assign Data Owners | Creates clear accountability. The Head of Marketing owns marketing data, making them responsible for its accuracy. |
| Standardise Key Fields | Enforces consistent formats (e.g., using state abbreviations) in your CRM to prevent messy, unusable data. |
| Regular Data Cleanup Sprints | Dedicate a few hours each quarter to merge duplicates and fill in missing info. Prevents small issues from snowballing. |
| Implement Access Controls | Limit who can edit critical data to reduce the risk of accidental errors or unauthorised changes. |
These small, consistent efforts are what separate businesses that trust their data from those that are constantly questioning it.
Building trust in your data is a high-return activity. When your team trusts the dashboards in front of them, they can confidently make decisions that move the business forward—without the usual second-guessing and manual verification.
This isn’t just a nice-to-have. Data quality is a critical bottleneck for most companies. Research shows that 95% of businesses are challenged by unstructured data and 44% cite data issues as a major obstacle to tech investments. On the flip side, businesses that get governance right see a 20% boost in profitability or performance, as detailed in recent findings on 2025 business trends. Good governance is how you ensure your roadmap delivers real, measurable value.
Phase 4: Bringing Your Roadmap to Life
A brilliant strategy on paper is worthless without smart execution. This rollout phase is where your data strategy roadmap leaves the theoretical behind and starts delivering real-world value. It’s all about implementing the plan in a manageable way and getting your team genuinely excited to use the new tools and insights.
The planning is done. Now it's time to build.

A "big bang" launch, where everything goes live at once, almost never works for a growing business. It’s too disruptive, the risks are high, and it pushes back the moment you see any return on your investment.
A phased, pilot project approach is a much smarter way to get started.
Start with a High-Impact Pilot Project
The secret to building momentum is to start small and score a quick, visible win. You need to pick an initial project that solves a real, painful problem for a key department. The perfect pilot is high-impact but low in technical complexity.
For many of our clients, a fantastic first step is automating the monthly financial reporting pack in a tool like Power BI. It's the ideal candidate for a few reasons:
- It solves a known pain point: Finance teams often burn days manually pulling data from different systems to build these reports.
- The value is crystal clear: Automating it frees up dozens of hours, slashes the risk of human error, and gets critical financial insights to leadership faster.
- It showcases real capability: It demonstrates the power of a connected data system and interactive dashboards in a way everyone instantly understands.
By delivering this first automated report, you immediately create internal champions. Your finance team becomes the first success story, showing everyone how the new data infrastructure makes their jobs easier and more impactful. That’s far more persuasive than any slide deck you could create.
Create a Realistic Implementation Timeline
Once you've chosen your pilot, it’s time to map out a realistic timeline. This isn't just about technical milestones; it's about managing expectations across the business. Break down your timeline into clear, manageable phases, each with a specific deliverable.
A classic mistake is underestimating the time needed for testing and user feedback. Don't just plan for the build—plan for the refinement. This iterative approach ensures the final product actually meets the team's needs. A core part of this process involves connecting your various systems, where effective data integration consulting becomes essential for creating a seamless flow of information from source to dashboard.
The goal of the rollout isn't just to launch technology. It's to change habits. You're shifting the company's muscle memory away from static spreadsheets and toward dynamic, self-service insights.
This phased approach lets you build, test, learn, and improve with each step. You systematically reduce risk while steadily building confidence across the organization.
Drive Adoption Through Training and Feedback
Technology is only half the battle. True adoption comes from empowering your team to use the new tools confidently. This doesn't mean scheduling week-long training courses. It’s about creating simple, accessible materials that are directly relevant to their roles.
Here are a few practical ideas that work for busy teams:
- Short Video Tutorials: Record quick, 2-3 minute screen-share videos showing how to use a new dashboard or find a specific metric.
- Simple "How-To" Guides: Create one-page PDFs with screenshots and clear, numbered instructions for the most common tasks.
- "Office Hours" Sessions: Host optional weekly drop-in sessions where people can ask questions and get hands-on help without pressure.
Most importantly, you need a clear feedback loop. Make it incredibly easy for users to report issues or suggest improvements. This not only helps you refine the system but makes the team feel like they are part of the process, not just having a new system forced upon them.
A successful rollout is complete when your team stops asking for static reports and starts actively exploring the data themselves to guide their daily work. This is the ultimate goal of your data strategy roadmap—turning data from a chore into a competitive advantage.
Your Path to Insight-Led Growth Starts Here
Building a data strategy roadmap isn't just another project; it's the foundation for becoming an insight-led organization. By moving through diagnostics, architecture, governance, and rollout, you fundamentally change how your business operates. You move from being reactive and buried in spreadsheets to becoming proactive and data-driven.
The end goal is a single source of truth that gets your entire team on the same page. It’s about automating the manual reporting that eats up your team's time and, most importantly, uncovering the growth opportunities hiding in plain sight within your data. Modern technologies and Unlocking The Power of AI will only accelerate this game-changing shift.
The journey might seem complex, but the destination—clarity, confidence, and control—is absolutely worth it.
Stop letting data chaos limit your potential. It’s time to build a roadmap that empowers you to scale intelligently and finally trust your numbers. The right strategy turns data from a liability into your most valuable asset for sustainable growth.
Want to automate your reporting and finally trust your data? Book a free call with our BI consultants today to start building your data strategy roadmap.
Still Have Questions? Your Roadmap FAQ
Taking the first step toward a data strategy roadmap can feel like a big one. Here are the most common questions we hear from founders and operators, answered directly.
How Long Does It Take to Create a Data Strategy Roadmap?
For most small-to-medium businesses, the initial roadmap development—from discovery workshops to a final, agreed-upon plan—takes between four to eight weeks.
The biggest variables are usually the complexity of your current systems and the availability of your key people to participate. After that, the implementation happens in manageable stages. We always kick things off with a pilot project that delivers a quick, high-impact win to build momentum.
Is a Data Strategy Roadmap Only for Large Corporations?
Not at all. In fact, it's often the smaller, more nimble businesses that benefit most. You have a massive advantage: you can implement a new data strategy far faster than a corporate giant.
A roadmap is arguably more critical for a growing business because it lets you build a solid data foundation before things get chaotic. Think of it as putting the scaffolding in place while the building is still small, not after you've already added ten messy floors. It helps you make smarter calls on hiring, marketing spend, and operations right from the start.
What Is the First Practical Step I Can Take Today?
Pinpoint your single most time-consuming reporting task.
Is it that weekly sales report that takes half a day to stitch together? Maybe it’s the monthly financial summary that's always late because of endless manual fixes?
Pick one. Then, write down every single step it takes to produce it. This simple exercise instantly highlights your data silos, manual bottlenecks, and quality issues. This becomes the perfect, real-world launchpad for the Diagnostics phase of your roadmap.
Do I Need to Hire a Data Scientist to Implement This?
No. The whole point of building a modern data stack with tools like Power BI is to empower the non-technical people you already have. You need specialists to build the initial foundation—the data plumbing and wiring—but not to run reports every day.
A firm like Vizule designs and builds that core architecture and your first critical dashboards. Then, we train your team on how to use these new, intuitive tools for self-service analysis. You get the power of a dedicated data team without the six-figure overhead.
Ready to stop wrestling with spreadsheets and start building a clear path to insight-led growth? The team at Vizule can help you map, model, and mobilise your data to unlock automated, trustworthy reporting.


