


For so many small and medium-sized business owners, the end of the month brings a familiar sense of dread. You’re stuck wrestling with scattered spreadsheets, manually copying and pasting data, and dealing with that nagging fear that the final numbers just aren’t quite right.
Business intelligence for finance is the definitive answer to this chaos. It’s not about adding more software; it’s a tech-driven approach that automates data collection and reporting. The goal is to transform all that disconnected financial and operational data into a single, trustworthy source of truth you can actually use for clear, strategic decision-making.
From Financial Chaos to Strategic Clarity

If you’re an SMB owner or operator, you know the pain of relying on manual reports. It’s slow, riddled with human error, and eats up precious hours you should be spending on growth. Key sales data is stuck in your CRM, expense details are in your accounting software, and operational metrics live in yet another system. Getting them all to talk to each other feels like a monumental task.
This is precisely the problem that business intelligence for finance is built to solve. It’s about creating a streamlined system that finally connects the dots between all your siloed data sources.
The Shift from Manual to Automated
Think of BI as the central nervous system for your company’s financial health. It pulls information from all your critical platforms—like your accounting package, sales CRM, and inventory management—and consolidates it into one cohesive view. The result is so much more than just a faster reporting process; it fundamentally changes how you see and use your data.
It’s a big reason why more companies are ditching outdated methods. The global BI market, valued at around $31.98 billion, is expected to nearly double by 2032 as businesses turn to BI to get a better handle on their financial performance. You can discover more insights about the BI market growth on fortunebusinessinsights.com.
Instead of spending late nights exporting CSVs and debugging formulas in Excel, you get access to dynamic, interactive dashboards. These tools give you an accurate, up-to-the-minute picture of your performance, allowing you to stop reacting to old problems and start building a proactive strategy.
A well-implemented BI system doesn’t just show you what happened last month; it helps you understand why it happened and what you can do about it next month. It gives you the foresight needed to scale with confidence.
The difference between the old, manual grind and a modern, automated approach is stark. Let’s break it down.
Manual Reporting vs Automated BI: A Comparison for SMBs
This table shows a side-by-side look at the traditional spreadsheet-based process versus a modern BI system. It highlights the dramatic improvements in everything from time saved to strategic impact.
| Aspect | The Old Way (Manual Spreadsheets) | The New Way (Business Intelligence) |
|---|---|---|
| Data Collection | Manual export/import from multiple sources; time-consuming | Automated, scheduled data pulls from all connected systems |
| Accuracy | Prone to copy-paste errors, typos, and broken formulas | High; data is standardized and validated, creating a “single source of truth” |
| Time to Insight | Days or weeks; report is outdated the moment it’s finished | Real-time or near-real-time; insights are available instantly |
| Scalability | Breaks down as data volume grows; becomes unmanageable | Easily scales with your business; handles millions of data points |
| Strategic Value | Limited to historical reporting (“what happened”) | Enables predictive and prescriptive analytics (“why it happened” and “what to do”) |
| Accessibility | Siloed in files, often only accessible to a few individuals | Accessible to all relevant stakeholders via shared, secure dashboards |
As you can see, making the switch isn’t just an upgrade—it’s a fundamental change in how your business operates. You move from being buried in data to being empowered by it.
Want to automate your reporting and finally trust your data? Book a free call with our BI consultants today.
The Building Blocks of a Finance BI System
Thinking about implementing business intelligence for finance can feel pretty daunting. It’s easy to imagine needing a whole team of engineers just to get started. But in reality, a modern finance BI system is built from a few core, understandable components. It’s less like building a skyscraper from scratch and more like assembling high-quality, pre-made modules to create a custom home for your data.
Each piece plays a distinct and crucial role. The real beauty of this approach, especially with tools like Power BI, is that you can start small with just one component and expand as you grow. This makes a powerful BI system accessible for any ambitious business, not just giant corporations.
Your Data Integration Foundation
First things first: data integration. This is the absolute foundation of your entire system. Its job is to automatically hook into all the different places your financial and operational data lives—your accounting software (like QuickBooks or Xero), your CRM, payment processors, and yes, even those stubborn but essential operational spreadsheets.
Instead of you manually exporting CSVs and wrestling with copy-paste, this layer does all the heavy lifting. It creates a seamless, automated pipeline that pulls all your information together. This process doesn’t just eliminate tedious manual work; it crushes the risk of human error that plagues so many finance reports.
The Central Data Warehouse Framework
Once your data is flowing in from its various sources, it needs a clean, organized place to live. That’s the job of a data warehouse. Think of it as the central library for your business—a single, structured repository where all your information is stored, cleaned up, and standardized.
This is where the real transformation happens. The data warehouse takes messy, inconsistent data—like different date formats or naming conventions from various systems—and makes it all uniform. It creates what’s known in the industry as a single source of truth.
A single source of truth is the absolute core of a trustworthy BI system. It ensures that when your sales team and your finance team both pull a report on last month’s revenue, they are looking at the exact same, validated numbers. No more arguments over whose spreadsheet is right.
This step is what takes you from basic data gathering to true business intelligence. It prepares your data for meaningful analysis, ensuring every report you build is based on information you can actually trust. For more on this, we’ve outlined several strategies in our guide to small business success.
The infographic below shows how these core pillars work together, starting with data collection and moving toward insightful reporting.
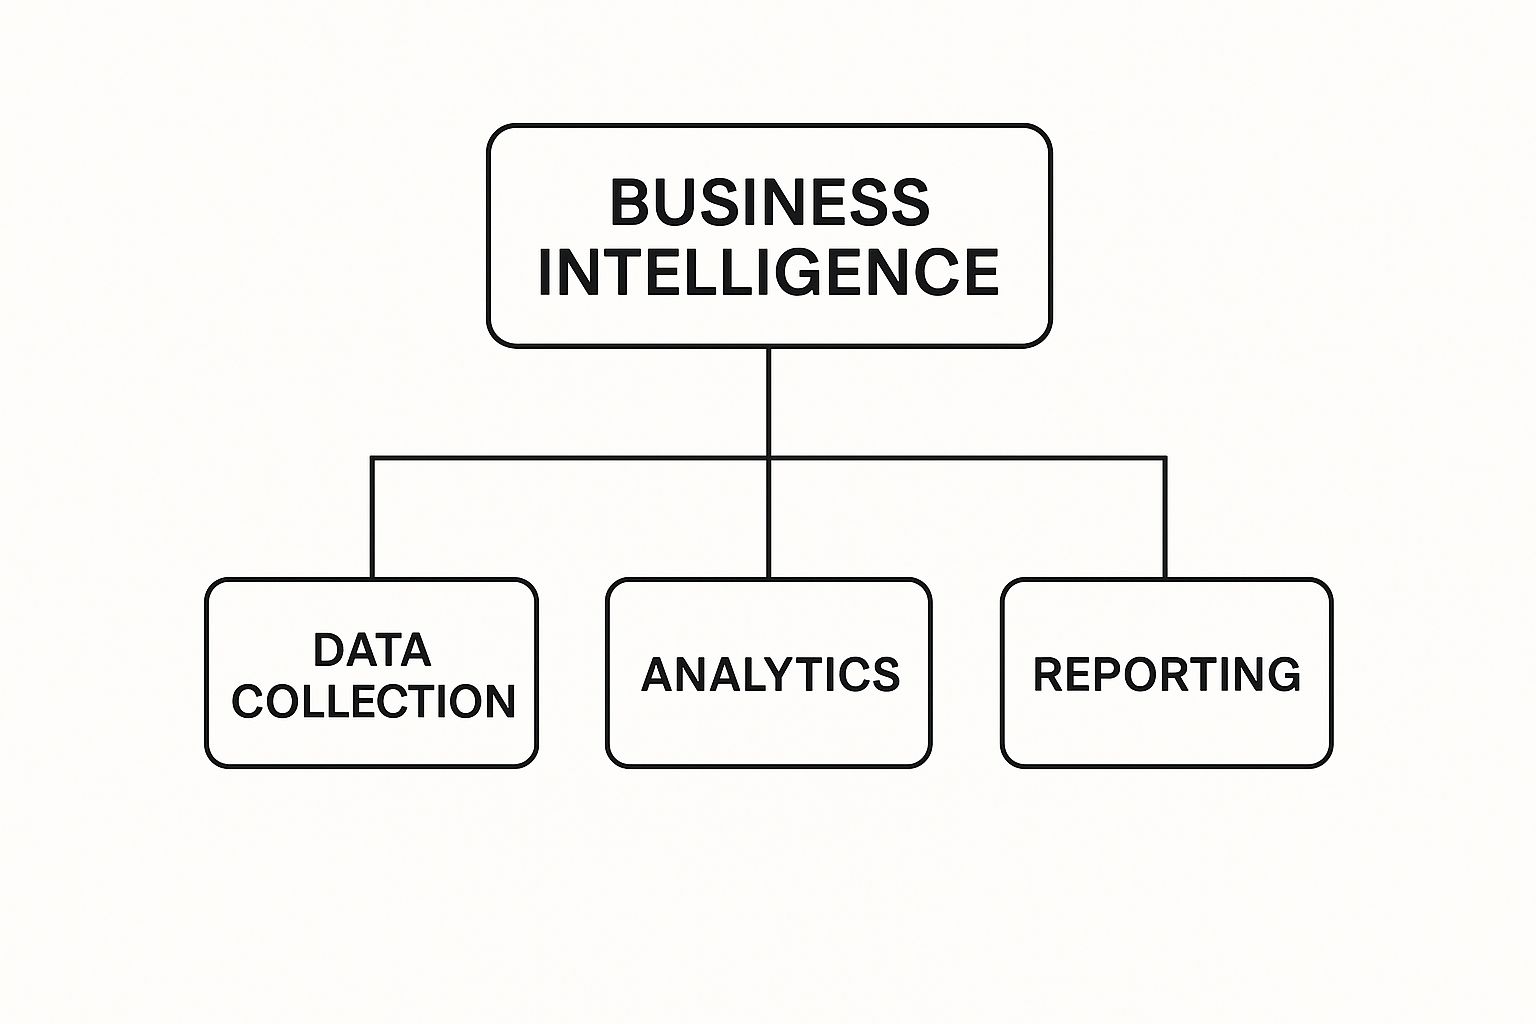
This simple hierarchy shows how each stage builds on the last, turning raw, disconnected data into strategic assets for your business.
Data Models and Dashboards
The final building block is where your data truly comes to life. Data modelling and dashboarding turn raw numbers into clear, intuitive visuals. This is where a tool like Power BI really shines.
Here, the clean data from your warehouse is modeled to define relationships—for instance, directly linking sales activities from your CRM to the revenue figures in your accounting system. This financial model then powers your interactive dashboards.
Now you can visualize critical financial statements and metrics like:
- A dynamic Profit & Loss (P&L) statement
- Real-time cash flow reporting
- Automated budget vs. actuals tracking
- KPI dashboards monitoring everything from customer acquisition cost to gross margin
Understanding these building blocks should give you the confidence to start your own BI journey. You don’t have to build it all at once, but you do have to start.
Automate Your Most Critical Financial Reports

Once you have a solid data foundation, business intelligence for finance starts to pay off. This is where the theory becomes practice. Forget spending your days buried in spreadsheets; automation frees you to focus on strategy.
This isn’t just about clawing back a few hours. It’s about eliminating the costly human errors that sneak into manual reporting. It’s about getting insights when they still matter, not a month after the fact.
Think of your most important financial summaries—not as static, historical documents, but as living, breathing, interactive tools. With a proper BI system, these reports stop being a chore and start being a competitive edge, updated automatically and ready when you are.
Dynamic Profit & Loss (P&L) Statements
A classic P&L statement tells you what happened. A dynamic P&L built in a tool like Power BI tells you why it happened. Instead of a flat PDF, you get an interactive dashboard where you can drill down into any line item with a single click.
For instance, an e-commerce business can filter its P&L on the fly to see the profitability of a specific product line, a sales channel, or even a single marketing campaign. This gives them the power to quickly spot what’s truly driving profit and what’s just draining cash. Budgeting decisions suddenly become much faster and a whole lot smarter.
Real-Time Cash Flow Dashboards
For any SMB owner, cash flow isn’t just a number on a page—it’s the company’s lifeblood. Relying on weekly or monthly cash flow statements is like trying to drive by only looking in the rearview mirror. You’re always reacting to problems that have already happened.
A real-time cash flow dashboard completely changes the game.
By connecting directly to your bank accounts and accounting software, it gives you a live, up-to-the-minute view of your cash position. Even better, it can use your historical data to power a forecasting model, projecting your cash balance based on anticipated revenue and expenses. This foresight helps you manage working capital, see shortfalls coming, and make confident calls on hiring, inventory, or expansion.
A live cash flow dashboard turns one of your biggest anxieties into one of your greatest strategic assets. It moves you from worrying about making payroll to planning for long-term growth.
Automated Budget vs. Actual Variance Analysis
The budget vs. actuals meeting is a staple for a reason, but the prep work is often a painful, manual slog of exporting data from Excel to Power BI. When you automate this analysis in a BI tool, it transforms from a dreaded task into a continuous, effortless process.
An automated variance report instantly flags where—and why—you are over or under budget.
- Immediate Alerts: Get notified the moment a department’s spending goes over its limit by a set percentage.
- Root Cause Analysis: Click down from a high-level variance like “Marketing Overspend” to see the specific line-item transactions behind it.
- Performance Tracking: Watch your budget adherence in real-time, giving you the chance to make corrections during the month, not after it’s too late.
This is the kind of automation that empowers you to manage financial performance proactively, not reactively. To see how this looks in the real world, check out our guide on revamping your reporting with Power BI.
The move toward business intelligence for finance is happening fast for a reason: it delivers this kind of actionable clarity. The global BI software market is expected to jump from $41.74 billion to $47.48 billion in the next year alone. As you can read in the full BI market forecast on precedenceresearch.com, that growth reflects an intense demand from businesses to make smarter, data-backed decisions. The investment is driven by the clear ROI that comes from automating essential reports and unlocking the insights hidden within them.
See how Vizule can help automate your reporting stack. Connect with us to design your financial dashboard in Power BI.
Your Practical Roadmap to BI Implementation
Making the leap from manual spreadsheets to an automated BI system can feel like a huge project, but it doesn’t have to be. For a busy SMB operator, the secret is a structured, phased approach. This roadmap breaks the process down into four manageable stages, turning a complex undertaking into a series of clear, achievable steps.
The goal isn’t to boil the ocean on day one. Instead, we’ll zero in on one high-impact area first to deliver real value, fast. This builds momentum, shows an immediate return, and gets your team genuinely excited about what business intelligence for finance can do.
Phase 1: Discovery and Goal Setting
Before you even think about technology, the most critical step is defining what success actually looks like. This discovery phase is all about asking the right questions. Don’t start with, “What reports do we want?” Instead, ask, “What are the most urgent financial and operational questions we can’t answer right now?”
This approach ensures your BI project is driven by genuine business needs, not just a list of technical features.
Some common questions we help SMBs tackle at this stage include:
- Profitability: Which of our products, services, or customers are truly driving our margins?
- Cash Flow: What will our cash balance look like in three months if current trends hold?
- Efficiency: Where are the hidden operational bottlenecks that are silently eating into our profits?
By nailing down these key questions first, you create a clear target for the entire project.
Phase 2: Data Audit and Consolidation
With your goals defined, it’s time for a data audit. Think of this as creating a map of your entire data landscape. You need to pinpoint where every critical piece of financial and operational information currently lives.
For most small to mid-sized businesses, this means digging into:
- Accounting software (like QuickBooks or Xero)
- Customer Relationship Management (CRM) systems
- Payment processors (e.g., Stripe)
- And, of course, the various “mission-critical” Excel or Google Sheets files holding things together.
The goal here isn’t just to make a list. It’s about understanding the quality and structure of the data. This is where you’ll uncover messy inconsistencies—like different naming conventions for the same customer across two systems—that have to be cleaned up to create a single source of truth.
Phase 3: Tool Selection and Setup
Once you know what data you have and what you want to achieve, you can finally pick the right tools for the job. While there are many options out there, a platform like Microsoft Power BI often hits the sweet spot for SMBs. It’s powerful, scalable, and surprisingly cost-effective, especially since it connects smoothly with tools you probably already use, like Excel and Office 365.
This is a major decision point, and global investment patterns tell a compelling story. The projected global spend on BI software is set to hit $72.1 billion in the next year, with the Americas making up 43% of that. This massive investment shows just how essential these tools have become for financial decision-making. You can explore more about business intelligence market spending on hginsights.com. For an SMB, going with a mainstream, well-supported tool like Power BI means tapping into this robust ecosystem.
Phase 4: Dashboard Design and Adoption
This final phase is where your strategy comes to life. It’s about more than just building pretty charts; it’s about designing intuitive, actionable KPI dashboards that directly answer the questions you defined back in Phase 1. A great dashboard tells a story, guiding the user from a high-level metric down to the nitty-gritty details with just a few clicks.
A dashboard is only successful if your team actually uses it. Adoption is everything.
This means you need to involve your team in the design process and give them the training to feel confident exploring the data on their own. Start by automating one crucial, time-consuming report, like the monthly financial close or a budget vs. actuals analysis. When your team sees how much time it saves and how much clearer the insights are, they’ll be clamoring for more.
Embarking on this journey doesn’t have to be a solo mission. A BI partner like Vizule can guide you through each phase, helping you avoid common pitfalls and ensuring you achieve clarity from day one. Book your free BI consultation to see how we can help automate your reporting stack.
Moving Beyond Reporting to Predictive Strategy

Automating your historical reports is a huge win. It saves countless hours and slashes the risk of costly errors. But honestly, that’s just the starting line. The real magic of business intelligence for finance kicks in when you shift from being a reactive record-keeper to a strategic, forward-looking partner for the entire business.
This is where the questions change. You stop asking, “What happened last month?” and start asking, “What’s likely to happen next?” A mature BI setup gives you the power to not just track past performance but to actively design your company’s future.
From Historical Data to Accurate Forecasting
Think about it: all that clean, consolidated data sitting in your BI system is the perfect fuel for financial forecasting. By digging into past trends, seasonality, and what really drives performance, you can build a surprisingly accurate forecasting model.
This isn’t about gazing into a crystal ball. It’s about using solid statistical methods to make highly educated predictions. You trade gut feelings for models built on real-world data.
A strong forecast gives you a priceless advantage: time. You can spot challenges and jump on opportunities long before they appear on the horizon, giving you the agility to outmaneuver the competition.
With this capability, you can start confidently answering the big-picture questions that define your company’s path forward.
Powerful Scenario Modeling in Power BI
What if you could test-drive a major business decision before committing a single dollar? That’s exactly what scenario modeling lets you do. By building a dynamic financial model in a tool like Power BI, you can tweak key variables and instantly see the ripple effects on your bottom line.
Just think about these classic founder dilemmas:
- Hiring Decisions: What happens to our cash runway if we hire two new salespeople in Q3? A model can map out the new burn rate and project when those hires will likely pay for themselves.
- Pricing Strategy: How would a 10% price increase affect our gross margin and overall profit, even if we lose 5% of our sales volume?
- Operational Changes: If we invest in new software that cuts processing time by 15%, what’s the direct impact on our operational costs and net profit over the next year?
Trying to answer these questions in Excel would be a manual, error-prone nightmare. In an interactive BI dashboard, it becomes a simple, insightful exercise that builds data-backed confidence. You can learn more about how to predict your company’s future with smarter financial models in our detailed guide.
Uncovering Hidden Drivers with AI and Machine Learning
Modern BI platforms are now baking in artificial intelligence (AI) and machine learning (ML) that take analysis to a completely different level. These algorithms can sift through millions of data points to find connections and patterns that a human analyst would almost certainly miss.
This technology can automatically bring hidden insights to the surface. For example, it can:
- Identify the real drivers of customer churn by linking usage data with support tickets and subscription history.
- Pinpoint operational leaks by spotting anomalies in expense reports or supply chain data.
- Discover your most profitable customer segments, showing you exactly where to focus your marketing and sales efforts for the biggest impact.
By using these advanced capabilities, you’re not just optimising your business—you’re giving it a serious competitive edge. This is how business intelligence for finance elevates your strategy from being simply informed to being truly intelligent.
We’ve walked through the all-too-familiar chaos of spreadsheets and seen the strategic clarity that modern business intelligence can offer. The takeaway for founders and operators is simple: business intelligence for finance isn’t some corporate luxury anymore. For any SMB looking to scale intelligently, it’s the engine for growth. It’s the bridge that takes you from being drowned by data to being empowered by it.
When you embrace BI, you’re doing more than just creating slicker reports. You’re fundamentally changing your relationship with your numbers and building a financial foundation that can actually support your future ambitions.
From Manual Grind to Strategic Advantage
The benefits are clear, practical, and almost immediate. You get back countless hours by automating the tedious tasks that used to eat up your team’s week. You boost accuracy, finally getting rid of those copy-paste errors that slowly kill trust in your data. Most importantly, you gain crystal-clear visibility into every corner of your operations.
This shift allows you to lead with confidence backed by hard data. You can finally stop wrestling with conflicting spreadsheets and start making strategic moves that create real, measurable value.
The ultimate goal of business intelligence for finance is to turn your data from a retrospective record into a proactive asset. It stops being about what you did and starts being about what you should do next.
This is the very transition that separates businesses that just scrape by from those that truly thrive. You stop reacting to yesterday’s problems and start actively shaping tomorrow’s outcomes. The focus shifts from just balancing the books to architecting growth, all supported by insights you can actually count on. It’s about building a financial reporting system that works for you, not the other way around.
Your Next Step Toward Financial Clarity
If you’re tired of second-guessing your data, spending weekends reconciling reports, and feeling like you’re flying blind, then the path forward is clear. The technology and expertise needed to build a better way are more accessible today than ever before. You don’t need a massive budget or an in-house data science team to get started.
What you do need is a clear vision and a partner you can trust to help you bring it to life. At Vizule, we specialize in connecting the dots in your data. We build the automated reporting systems that give SMBs the clarity they need to not just compete, but to win. We help you move from financial chaos to strategic control.
Ready to automate your reporting and finally build a financial foundation you can trust?
Book your free BI consultation with a Vizule expert today. Let’s build your financial clarity, together.
Frequently Asked Questions About Finance BI
Diving into business intelligence for your finance function naturally brings up some practical questions. As a founder or leader, you need straightforward answers to see how this actually impacts your business on the ground. Here are the most common questions we get from SMBs and our no-nonsense answers.
How Much Does a BI Solution Cost for a Small Business?
This is always the first question, and the honest answer is: it depends. There’s no single price tag. Think of a BI solution less like a product you buy off the shelf and more like a utility you invest in that scales with you. Your initial investment really comes down to how complex your data sources are and the scope of your first project.
For most small and medium-sized businesses, the main cost isn’t the software itself—a tool like Power BI is surprisingly affordable. The real cost driver is the expertise needed to set it up correctly. When you partner with a consultancy like Vizule, you’re paying for an efficient, expert implementation that sidesteps the hefty salary of a full-time hire. The focus should always be on ROI. Our clients often find that automating just one critical report—like the monthly financial close—saves so much time and prevents so many errors that it pays for the initial setup within just a few months.
How Quickly Can I Expect to See Results?
You’ll see tangible results much faster than you might think, but it happens in two phases.
- Quick Wins (Weeks): We can get your first high-impact dashboard up and running in just a few weeks. This could be a real-time cash flow report or an automated P&L. It delivers immediate value by slashing hours of manual work and giving you instant clarity where you need it most.
- Strategic Maturity (Ongoing): Building a truly integrated, forward-looking BI system isn’t a one-and-done project; it’s a journey. As your business grows, your data needs will evolve. Real strategic maturity is achieved by continuously adding new data sources, refining your models, and empowering your team to ask bigger, better questions.
The goal is to get your first win on the board quickly. This builds momentum and proves the value of business intelligence for finance, creating a solid foundation for more advanced strategic analysis down the road.
Do I Need a Data Analyst on My Team?
Nope. You absolutely do not need to hire a full-time data analyst to get started. Modern BI platforms are built with user-friendly interfaces, so non-technical leaders can easily explore data and understand performance through interactive dashboards.
The real challenge isn’t using the dashboards day-to-day. It’s the initial setup, data integration, and model building. That’s a specialized skill set needed to ensure your data is clean, connected, and trustworthy. A consultancy like Vizule fills this expertise gap. We act as your outsourced data team to build that robust foundation, handling the technical heavy lifting so you can get back to running your business—just with much clearer insights.
How Is This Different from My Accounting Software Reports?
This is a fantastic question and a crucial distinction to make. Your accounting software (like Xero or QuickBooks) is great at what it does: generating static, pre-built reports about what has already happened financially. It spits out a standard P&L or balance sheet.
A real BI system is in a different league. It’s a flexible, dynamic, and integrated analytics engine.
- It Connects All Your Data: BI pulls information not just from accounting, but also from your CRM, sales platforms, and operational tools. This is how you link financial outcomes to the activities that actually drive them.
- It’s Interactive: Instead of a flat PDF, you get a dynamic dashboard. You can drill down, filter, and slice the data any way you want to find the answers to your specific questions.
- It’s Forward-Looking: Accounting reports are purely historical. A BI system uses that history to build a forecasting model, helping you predict future performance and run what-if scenarios to make smarter decisions.
In short, your accounting software tells you your numbers. A business intelligence for finance system tells you the story behind your numbers.
Ready to move beyond basic reports and unlock true strategic insight? Vizule specializes in building the automated reporting and financial modeling systems that empower SMBs to scale with confidence.
Connect with us to design your financial dashboard in Power BI


