


Think of a powerful data & analytics strategy as your roadmap out of manual reporting chaos. It's not about getting lost in complex algorithms; it's about building an automated system that connects your sales, finance, and operations data into a single source of truth, giving you a live, honest look at your business at any moment.
Moving Beyond Guesswork and Manual Reports

For most SMB founders, the word "data" probably brings a headache to mind. It’s trapped in messy spreadsheets that eat up hours of manual work, pulling numbers from different systems just to get a blurry snapshot of the business.
You know the routine all too well. Exporting from your CRM, copying from your accounting software, and pasting it all into a monstrous Excel file that threatens to crash your computer.
This frantic, reactive process means your reports are out of date the second you finish them. You’re forced to make critical decisions based on gut feelings and historical numbers that don’t reflect what’s happening right now. A well-designed data and analytics strategy is the definitive escape from this cycle of inefficiency.
From Data Chaos to Strategic Clarity
The jump from manual reporting to a structured data strategy is huge. It completely changes how you see and run your business every single day, moving you from reacting to past events to proactively shaping what happens next.
We've seen this transition countless times. A company drowning in spreadsheets suddenly finds a new level of control and foresight. Here’s a practical look at what that change feels like.
| Common Challenge (The 'Before') | Strategic Solution (The 'After') |
|---|---|
| Decisions are based on intuition or outdated reports. | Decisions are guided by real-time, accurate data from across the business. |
| The team spends hours each week on manual data entry and report building. | Reporting is automated, freeing up your team to focus on analysis and growth initiatives. |
| Data is siloed in different platforms (CRM, accounting, etc.), creating conflicting numbers. | A "single source of truth" provides a unified view of performance, aligning all departments. |
| You can't drill down into details without starting a new manual report. | Interactive dashboards in Power BI allow for instant deep-dives into specific metrics. |
Ultimately, this transition is about creating an automated system that weaves your sales, finance, and operations data into one cohesive view. To truly break free from relying on gut instinct and manual grunt work, it’s critical to embrace data-driven decision making.
Key Takeaway: A data strategy isn't just about technology; it's a business framework for turning your raw operational data into your most valuable asset for confident, insight-led growth.
This guide is built specifically for non-technical leaders. We’ll show you exactly how to build that system using accessible tools like Power BI. Our goal is to help you gain true visibility, align your finances with your operations, and finally unlock the insights hiding inside your data.
If you’re ready to trade spreadsheet chaos for clarity, you’re in the right place.
Aligning Your Strategy with Business Goals
A solid data strategy never starts with a flashy dashboard or the latest software. It all begins with a deceptively simple question that every founder needs to ask: "What are we actually trying to achieve?" Before you even glance at a piece of technology, you have to get crystal clear on your core business objectives.
Are you laser-focused on boosting customer lifetime value? Is the main goal to slash operational costs by 15%? Maybe you're scrambling to get a better handle on cash flow forecasting to navigate a tight market. Whatever they are, these goals are your true north. Every single part of your data & analytics strategy has to point directly at them.
Without that clarity, you're just building pretty dashboards that track "vanity metrics"—numbers that look impressive but do absolutely nothing to move the needle on what really matters.
From Broad Goals to Specific KPIs
Once you’ve nailed down the high-level objective, it’s time to break it down into things you can actually measure. This is where Key Performance Indicators (KPIs) come into play. A good KPI isn't just a number; it's a direct measure of your progress against a specific goal.
Let's say your big-picture goal is to "improve customer retention." You wouldn't track something generic like website traffic. Instead, you'd zero in on specific, actionable metrics:
- Customer Churn Rate: What percentage of customers are walking away each month or quarter?
- Repeat Purchase Rate: How many of your customers are coming back for a second, third, or fourth purchase?
- Customer Lifetime Value (CLV): What's the total revenue you can expect from a single customer over their entire relationship with you?
These KPIs give you a concrete way to track success. They turn a vague ambition into a tangible target, so you can see exactly how your efforts are paying off.
Mapping Your Data Sources
With your KPIs locked in, you can finally start hunting for the data. For most small and medium-sized businesses, information is scattered everywhere—this is the "Excel chaos" so many of us know all too well. The mission here is to create an inventory of where all your critical information lives.
You’ll likely find a familiar picture:
- Customer details are sitting in your CRM, maybe HubSpot or Salesforce.
- Financials are locked away in accounting software like QuickBooks or Xero.
- Inventory and operational data? That's probably tracked in a jumble of disconnected spreadsheets.
This mapping exercise is often a huge eye-opener. It shines a harsh light on the hidden data silos and inconsistencies that have been quietly sabotaging your decisions for years. You might discover that the sales team's revenue numbers don't quite line up with the finance team's—a classic symptom of siloed data.
This visual breaks down the logical flow for auditing your current state, starting with your data, then your tech, and finally, your team.
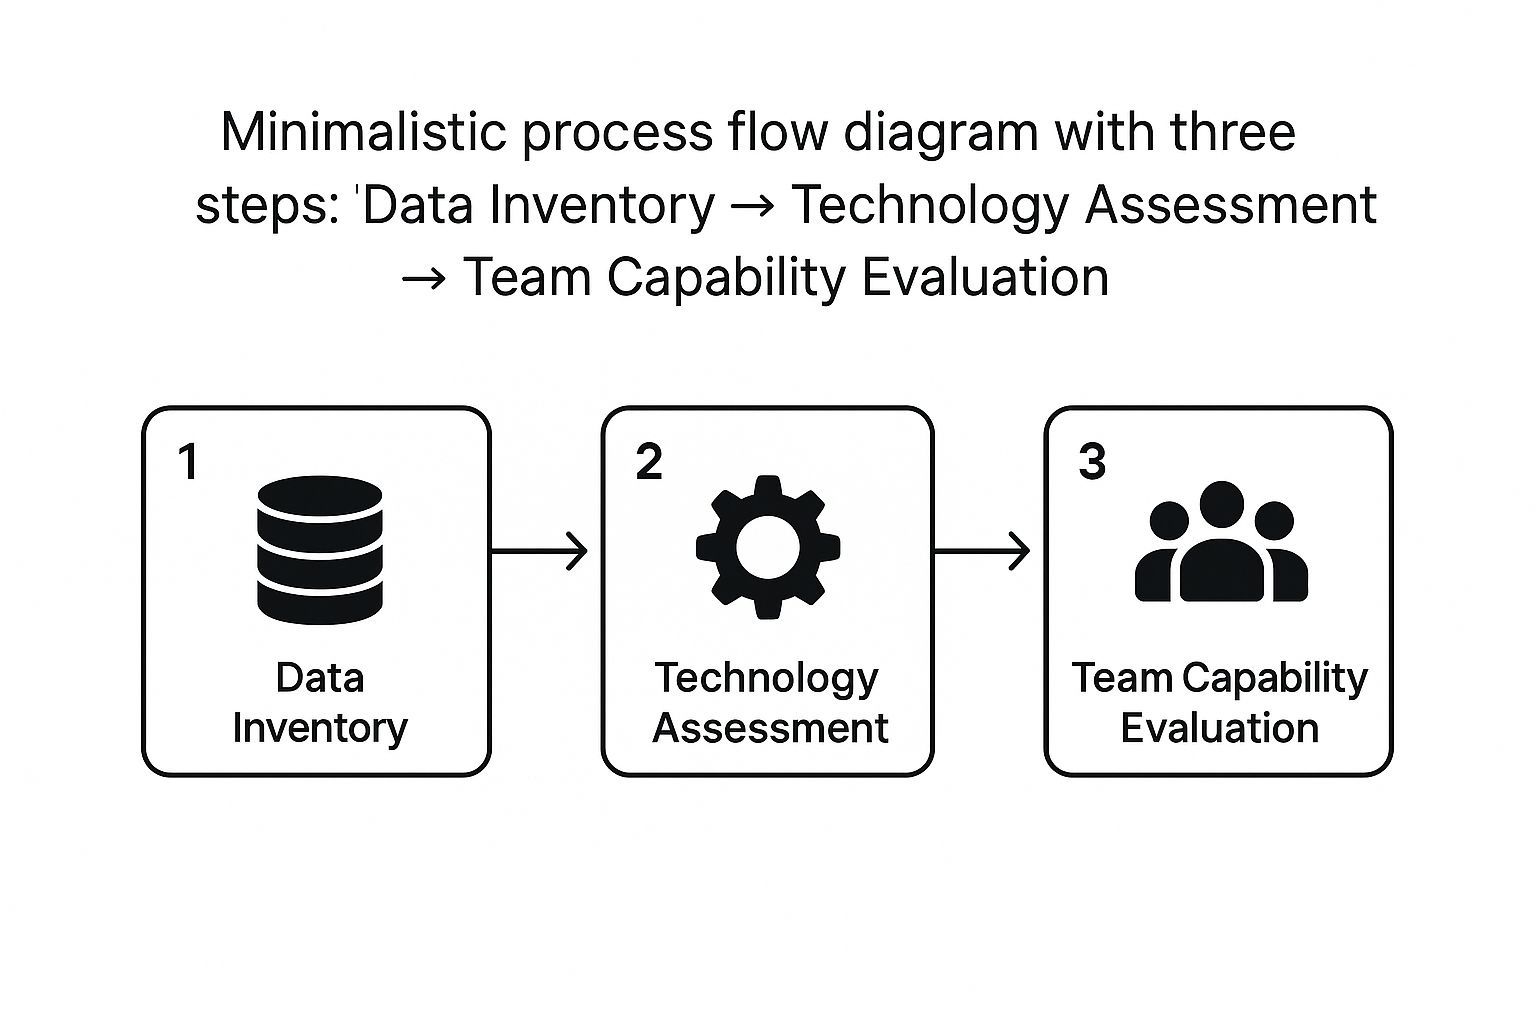
This process really drives home that a winning strategy depends on understanding not just what data you have, but also the technology and people you need to actually use it.
Bring Your Team into the Conversation
Look, a data strategy cooked up in an executive vacuum is doomed from the start. One of the most important things you can do in this early phase is to pull key people from sales, finance, and operations into the conversation. And do it early and often.
Your team on the front lines understands the business realities better than anyone. Their insights will ensure the strategy you build is practical, gets adopted, and delivers tangible value across the entire company.
The sales manager knows which metrics actually predict a closed deal. The operations lead sees the data points that signal a looming inventory disaster. And your finance team knows exactly what’s needed for accurate cash flow reporting.
By involving them from day one, you’re not just gathering requirements—you’re building buy-in. This collaborative approach transforms the project from a top-down mandate into a shared mission to build a smarter, more data-driven business.
Tired of fragmented data holding you back? Book your free BI consultation and let's map out a strategy that aligns directly with your business goals.
Designing Your Modern SMB Tech Stack
Your technology is the engine that brings your data & analytics strategy to life, but let's be clear: this doesn't need to be complicated or expensive. For most small and mid-sized businesses, the secret is choosing flexible, scalable tools that play nicely together. The goal is a seamless, automated flow of information from its source right to your screen.

We're not just buying software here. We're building an end-to-end system that turns raw data into real insights with as little manual work as possible. This is how you break your team free from the soul-crushing cycle of copy-and-paste reporting so they can focus on what actually moves the needle.
The Core Components of an SMB Data Stack
For a growing business, the ideal tech stack is lean, powerful, and built around one central truth. Think of it in three distinct layers that work in perfect harmony.
- Data Sources: This is where your data is born. It's everything from your accounting software like QuickBooks, your e-commerce platform like Shopify, your marketing tools like Google Analytics, and yes, even those mission-critical spreadsheets everyone relies on.
- Data Warehouse (The Central Hub): This is the absolute game-changer. Instead of trying to connect to a dozen different sources (which is a recipe for disaster), you funnel everything into one central repository. A cloud-based solution like Azure SQL Database or Azure Synapse Analytics becomes your single source of truth. It cleans, organizes, and prepares the data for analysis.
- Business Intelligence (BI) Platform: This is the fun part—where your data gets a voice. A tool like Microsoft Power BI connects directly to your data warehouse, letting you build dynamic, self-refreshing dashboards that finally answer your most important business questions.
Following this structure completely eliminates the "my numbers don't match your numbers" debate. Forever. Everyone is finally on the same page, working from the same verified dataset.
Bringing It All Together with Power BI
There's a reason Power BI sits at the heart of this modern stack. It’s way more than a visualization tool; it’s an entire analytics ecosystem built to connect all your different data sources. Whether your information is sitting in a simple Excel file or a complex database, Power BI has the connectors to pull it all together.
The real magic is its ability to directly query data from a central data warehouse. What does that mean for you? Your reports aren't just automated; they're lightning-fast and always show the very latest information, transforming your Excel to Power BI workflow.
For an SMB, this is huge. It delivers enterprise-level analytics power without the enterprise-level price tag or complexity. If you're curious how it stacks up against the competition, you can see our breakdown of the best business intelligence platforms for your needs.
Real-World Scenario: An E-Commerce Retailer
Let's make this real. Picture an e-commerce business drowning in data chaos. Sales figures are in Shopify, their marketing spend is in Google Ads, and inventory is tracked in a spreadsheet that's perpetually out of date. The founder wastes hours every single Monday wrestling with this mess just to calculate their true customer acquisition cost (CAC) and return on ad spend (ROAS).
By implementing a modern data stack, their workflow is completely transformed:
- Automated Integration: They set up connectors to automatically pull data from Shopify, Google Ads, and their inventory system into an Azure data warehouse. This happens every night while they sleep.
- Centralized Metrics: Inside the warehouse, the data is cleaned up and joined together. A single, clean table is created that links marketing spend directly to customer orders and product costs.
- Dynamic Dashboards: A Power BI dashboard connects to this central source. Now, the founder can see their ROAS in real-time, filter by any marketing campaign, and view inventory levels right next to sales forecasts—all on one screen, all updated automatically.
This isn't just about saving time; it's about gaining the clarity needed to make smarter, faster decisions. The conversation immediately shifts from "What happened last month?" to "Which marketing channel should we double down on tomorrow?"
Building Dashboards That Answer Key Questions
Your data strategy only becomes real when you can see it on a screen. After all the hard work aligning goals and wrestling with your tech stack, the dashboard is where your data finally starts talking. But a truly effective dashboard does more than just throw up a few charts; it tells a clear story and gives you direct answers to your most urgent business questions.
The goal isn't to cram every single metric you can think of onto one screen. That's a recipe for noise and confusion. The real art lies in designing a focused experience, say in Power BI, that actually helps your team by guiding their attention to what truly matters.
From Data Points to a Clear Narrative
Think of your dashboard like the front page of a newspaper—it needs to grab your attention with the biggest story right away. This is done through something called visual hierarchy, which is just a fancy way of saying you put the most important stuff front and center. Your most critical KPI, whether it's Gross Profit Margin or Customer Acquisition Cost, should be the biggest, boldest number on the screen. No question.
From there, the design should naturally guide the user's eye from the big-picture summary down to the nitty-gritty details. This is where choosing the right chart for the job is absolutely critical.
- Tracking trends over time? A simple line chart is your best friend for watching revenue or website traffic month-over-month.
- Comparing different categories? A bar chart is perfect for stacking up sales performance across your product lines or regions.
- Trying to understand the makeup of something? A treemap or stacked column chart can instantly show you what percentage of total sales each category contributes.
The right visualization delivers the insight in a split second. The wrong one makes your team squint and struggle to figure out what they're looking at, which just slows everyone down. To learn more about bringing your data to life, check out our detailed guide on data visualization and dashboards.
Empowering Your Team with Self-Service Analytics
The real magic of a modern dashboard is its interactivity. Static, PDF-style reports are a relic of the past. The whole point is to create a self-service environment where your team can get curious, explore the data, and find their own answers.
This is where interactive filters and slicers in a tool like Power BI completely change the game. Imagine a single dashboard that links your financial forecasting model with live sales performance and operational KPIs.
With just a few clicks, your Head of Sales can drill down from a company-wide P&L to see how their specific team is doing, and then click again to see an individual salesperson's numbers. This is the difference between reporting on what happened and exploring why it happened.
This kind of capability is what drives people to actually use the tools you build. When your team realizes they can get answers in seconds instead of waiting days for an analyst to pull a new report, the dashboard becomes an essential part of their daily routine.
The Growing Importance of Effective Analytics
Building this kind of intuitive analytics experience isn't a "nice-to-have" anymore; it's a core part of a modern business strategy. The global data analytics market was valued at around USD 64.99 billion in 2024 and is projected to hit an incredible USD 402.70 billion by 2032.
This boom was kicked into high gear by the pandemic, where 52% of companies hit the accelerator on their AI and analytics plans to stay afloat and make better decisions. You can read more about how market trends highlight the importance of data analytics on fortunebusinessinsights.com.
And this isn't just a game for giant corporations. For a small or medium-sized business, a well-designed dashboard acts as a force multiplier. It gives your team the kind of insight that was once only possible for companies with massive analytics departments, leveling the playing field and empowering you to make smarter, faster decisions that drive real growth.
Ready to build dashboards that don't just show data, but actually answer your most critical business questions? See how Vizule can help automate your reporting stack and turn your data into a clear, actionable story.
Creating a Culture of Insight-Led Decisions
You can have the most elegant Power BI dashboards and the most robust data warehouse in the world, but they're completely worthless if your team doesn't use them. This brings us to the final, critical phase of your data & analytics strategy: shifting from building tools to building a culture.
The real goal is to embed data into the daily rhythm of your business, making it a natural part of how everyone operates.
This is where technology meets human behavior. It’s all about transforming the company mindset from "I think…" to "I know, and here's the data to prove it." This isn't a switch you can just flip overnight. It’s a deliberate process of training, reinforcement, and most importantly, leadership.
Fostering Widespread Adoption and Trust
Driving adoption starts with one simple thing: making data accessible and unintimidating. People naturally resist what they don't understand, so your first job is to demystify the new tools and reports you’ve worked so hard to build.
Forget about a single, overwhelming training session. Think in terms of ongoing support and education. This approach respects that different people learn at different paces.
- Host Hands-On Workshops: Gather small groups from finance, sales, and ops to walk through the new dashboards. Let them click around, ask questions, and explore the data in a supportive, low-pressure setting.
- Create Simple Video Tutorials: Record short, two-minute videos answering a common question, like "How do I see my top-performing products this month?" Host them somewhere your team can easily find and reference them anytime.
- Establish a Go-To Resource: No one should ever feel stuck. Make it crystal clear who they can ask for help, whether it's an internal champion or a dedicated partner like Vizule.
This entire process is a core part of managing the human side of a shift to a data-first mindset.
Appointing Analytics Champions
One of the most effective ways to drive adoption is to find your "analytics champions." These are the naturally curious, tech-savvy people on your team who are genuinely excited about these new capabilities. They don't need to be data scientists; they just need to be enthusiastic.
Empower these individuals to be the first line of support for their colleagues. They can translate technical questions into plain English, share success stories, and advocate for the new way of working in their own departmental meetings.
This kind of peer-to-peer support is far more effective than any top-down mandate. It creates a groundswell of organic adoption that helps truly embed data into your company's DNA. To foster an environment of informed choices, it helps to understand a few core business intelligence best practices.
Integrating Data into Daily Business Rhythms
For data to become part of your culture, it has to be part of your conversations. The most direct way to achieve this is by weaving your new dashboards directly into existing business routines.
When your Power BI dashboards become the focal point of weekly sales meetings, financial reviews, and operational huddles, they stop being a "special project" and start being "just how we do business." This consistent exposure builds familiarity and powerfully demonstrates leadership's commitment to insight-led decision-making.
The market is increasingly leaning on these capabilities. In 2024, predictive analytics dominated the global data analytics market, accounting for about 40.12% of the revenue. This isn't surprising, as it helps businesses use historical data to forecast future trends, empowering proactive decisions in everything from resource planning to customer engagement.
This cultural shift is the capstone of your strategy, the final piece that ensures your investment pays dividends for years to come.
Tired of important decisions being made on gut-feel alone? Book your free BI consultation and let's build a culture of data-driven confidence together.
Your Next Steps with Data and Analytics
Dipping your toes into the world of data can feel like a massive project, especially when you're already juggling a dozen other priorities as a business owner. But here’s the thing: moving from spreadsheet chaos to strategic clarity isn’t some multi-year, bank-breaking ordeal. The path forward is a lot clearer and more accessible than you might think.
Our goal is to cut through the noise and give you the confidence to take that first, crucial step. Below, we've tackled the most common questions and concerns we hear from founders and operators just like you.
How Much Does a Data Strategy Typically Cost?
This is always the first question, and the answer is simple: it depends, but it's almost certainly not the six-figure sum you might be picturing. The cost of building out a data and analytics strategy is tied directly to the complexity of your business—how many data sources you have, the state of your data, and what you actually need to see in your reports.
For most small and medium-sized businesses, the initial investment really boils down to three parts:
- Strategy & Scoping: A diagnostic phase where we map out your goals, KPIs, and data sources.
- Implementation & Build: This is the technical bit—setting up the data warehouse, connecting your systems, and building the first round of Power BI dashboards.
- Training & Handover: Making sure your team is comfortable and knows how to use the new tools.
A smaller, focused project—like automating your financial reporting from QuickBooks and a CRM—can be surprisingly affordable. The trick is to start with one high-impact area of the business. Prove the ROI there, then expand.
How Long Will This Take to Implement?
Forget what you've heard about year-long IT projects. With modern tools and a focused approach, you can go from scattered data to genuinely useful insights in a matter of weeks, not months. A solid foundational project is usually broken down into a quick, iterative process.
At Vizule, we run a three-step process—Map, Model, Mobilise—that's built to get you actionable insights within 30 days. This agile approach means you see value fast, which helps build momentum across the company. That first dashboard is just the start; from there, we keep building and refining based on what your team actually needs.
Do I Need to Hire a Full-Time Data Team?
Absolutely not. This is probably the biggest myth holding businesses back.
The whole point of partnering with a consultancy like Vizule is that you get access to a full bench of experts—strategists, data engineers, and Power BI specialists—without the overhead of full-time hires.
We handle the heavy lifting of designing the architecture, building the data pipelines, and creating the dashboards. Then, we train your existing team to become self-sufficient users of the system. It’s a model that gives you the expertise you need to get off the ground and the support to scale, all while keeping your team lean.
What Is the First Practical Step I Should Take?
The single most important thing you can do right now is to get crystal clear on one specific business problem you want to solve. Don't try to boil the ocean. Instead of a vague goal like "we need better data," zero in on a concrete pain point.
Think about things like:
- "Our cash flow forecasting is always wrong, and it takes a full week to build."
- "We have no idea which of our marketing channels are actually bringing in profitable customers."
- "Our sales and operations teams are constantly arguing because their inventory numbers never match."
By narrowing your focus to a single, high-value problem, the whole process becomes more manageable. More importantly, it ensures your initial investment delivers a clear, measurable return. That first win builds the business case—and the internal enthusiasm—you need to tackle the next challenge.
Ready to stop guessing and start making decisions with confidence? The team at Vizule specialises in designing and implementing data strategies that are tailored to your business. Let's start connecting the dots.


