


A data model for a data warehouse is your architectural blueprint for turning business data into clear, reliable insights. Think of it as the structured floor plan that transforms a chaotic pile of information from your apps and spreadsheets into a logical, accessible library, making it simple to find exactly what you need for analysis and reporting.
For non-technical founders, this means finally getting trustworthy answers to critical business questions without the manual, error-prone grind of stitching together Excel files.
Why Your Data Feels Chaotic and Lacks Insight
If you’re like most founders, you’re sitting on a goldmine of information. Data flows in from Stripe, your marketing automation platform, your accounting software, and countless spreadsheets. Yet, when it’s time to pull a simple monthly performance report, it feels like a painful, manual chore.
This common frustration—being data-rich but insight-poor—isn’t a sign that your data is bad. It’s a sign that it lacks structure.

The Familiar Grind of Manual Reporting
Does this scenario sound familiar? You’re running a growing business, and at the end of the month, you need to understand your customer acquisition cost (CAC) versus lifetime value (LTV). To get that number, you have to:
- Export ad spend data from Google Ads and Meta.
- Pull sales transaction history from Stripe.
- Download customer interaction data from HubSpot.
- Manually stitch it all together in a monstrous Excel file, held together by fragile VLOOKUPs that threaten to crash your computer.
Each step is a time sink and a magnet for human error. One copy-paste mistake can skew your numbers, leading to bad decisions based on faulty information. You end up spending 90% of your time just collecting and cleaning data, and only 10% on analysis. This isn’t just inefficient; it’s a massive strategic risk.
That feeling of drowning in “oceans of data but still struggle to answer simple questions” is a classic symptom of this problem. It’s about moving past data collection and toward freeing your data for collective intelligence.
A business running on disconnected spreadsheets is like navigating a city without a map. You might eventually get where you’re going, but you’ll waste a lot of time and energy on wrong turns and dead ends.
From Messy Garage to Organized Workshop
Here’s the thing: this chaos isn’t a data problem; it’s a structure problem. The solution is a data model data warehouse. Let’s break that down with a simple analogy.
Imagine your business data is a collection of high-end tools. Right now, they’re all just thrown into a messy garage. You know you have a 10mm socket somewhere, but finding it means digging through piles of unrelated junk. It’s frustrating and kills your momentum.
- A data warehouse is the organized workshop itself—a clean, central space to store all your tools.
- The data model is the pegboard, the labelled drawers, and the toolbox layout. It’s the system that dictates exactly where each tool goes so you can grab it instantly when you need it.
This structured approach is what finally unlocks clear, trustworthy answers from your data. Instead of wasting hours hunting for the right information, you can ask critical questions and get immediate, accurate insights. This foundation sets the stage for a practical way out of the reporting grind and toward genuine, insight-led decision-making.
Your Blueprint for a Business-First Data Model
Let’s get one thing straight: building a solid data model for a data warehouse is a business strategy exercise, not some convoluted IT project. The goal isn’t to hoard every single byte of data you own. It’s about starting with the questions you need to answer to actually grow the business.
Forget the technical jargon for a minute. Think about your core operations—sales, marketing, finance. What metrics, if you could track them perfectly, would genuinely move the needle? The secret is designing a model that mirrors how you already think about your business. This business-first approach ensures the technology serves your strategy, not the other way around.
Starting with Your Business Questions
Before you even think about software, grab a whiteboard. The most effective data models we’ve ever built started with simple, high-value questions that the business was struggling to answer efficiently.
Things like:
- “Which of our marketing channels are actually bringing in our most profitable customers?”
- “What’s our true customer lifetime value, broken down by the first product they ever bought?”
- “How is our sales cycle length changing across different regions or even between sales reps?”
Answering any of these means you have to connect the dots between different data sources. This is exactly where the core concepts of a data model come into play.
The Two Building Blocks: Facts and Dimensions
Every data model, no matter how complex, is built on two simple ideas: facts and dimensions. Getting your head around these two concepts is the key to organizing your data in a way that makes sense.
- Facts are your numbers—the quantifiable metrics right at the heart of your business. Think of them as the events you want to measure, like a sale being completed or an invoice getting paid.
- Dimensions provide the context—the crucial “who, what, when, and where” that gives those facts meaning. They’re the descriptive details you use to slice and dice your data for real analysis.
A sales transaction is a great example of a fact. But that number is pretty useless without its dimensions: which customer bought what product, on what date, and through which sales channel?
More and more businesses are catching on to the power of this structure as they try to manage massive amounts of data. You can dig deeper into the market growth in this research report.
To make this crystal clear, especially for non-technical founders, here’s a simple breakdown of how facts and dimensions work in a real-world small business context.
Fact vs Dimension Table Examples for an SMB
| Concept | What It Is (Simple Terms) | Business Example |
|---|---|---|
| Fact Table | The table of numbers and events. It holds what you’re measuring. | SalesTransactions table with columns like Revenue, QuantitySold, DiscountAmount. |
| Dimension Table | The “who, what, when, where” tables. They describe the things involved in the events. | Customers table with Name, City. Products table with ProductName, Category. |
These two table types work together to give you the full picture. The Fact table gives you the “what happened,” and the Dimension tables give you the “details about what happened.”
Visualizing Your Data Flow
It’s incredibly helpful to think about how data actually moves from your various apps into a structured warehouse. The diagram below shows a simplified version of this flow, illustrating how raw data gets transformed into an organized warehouse, ready for analysis.
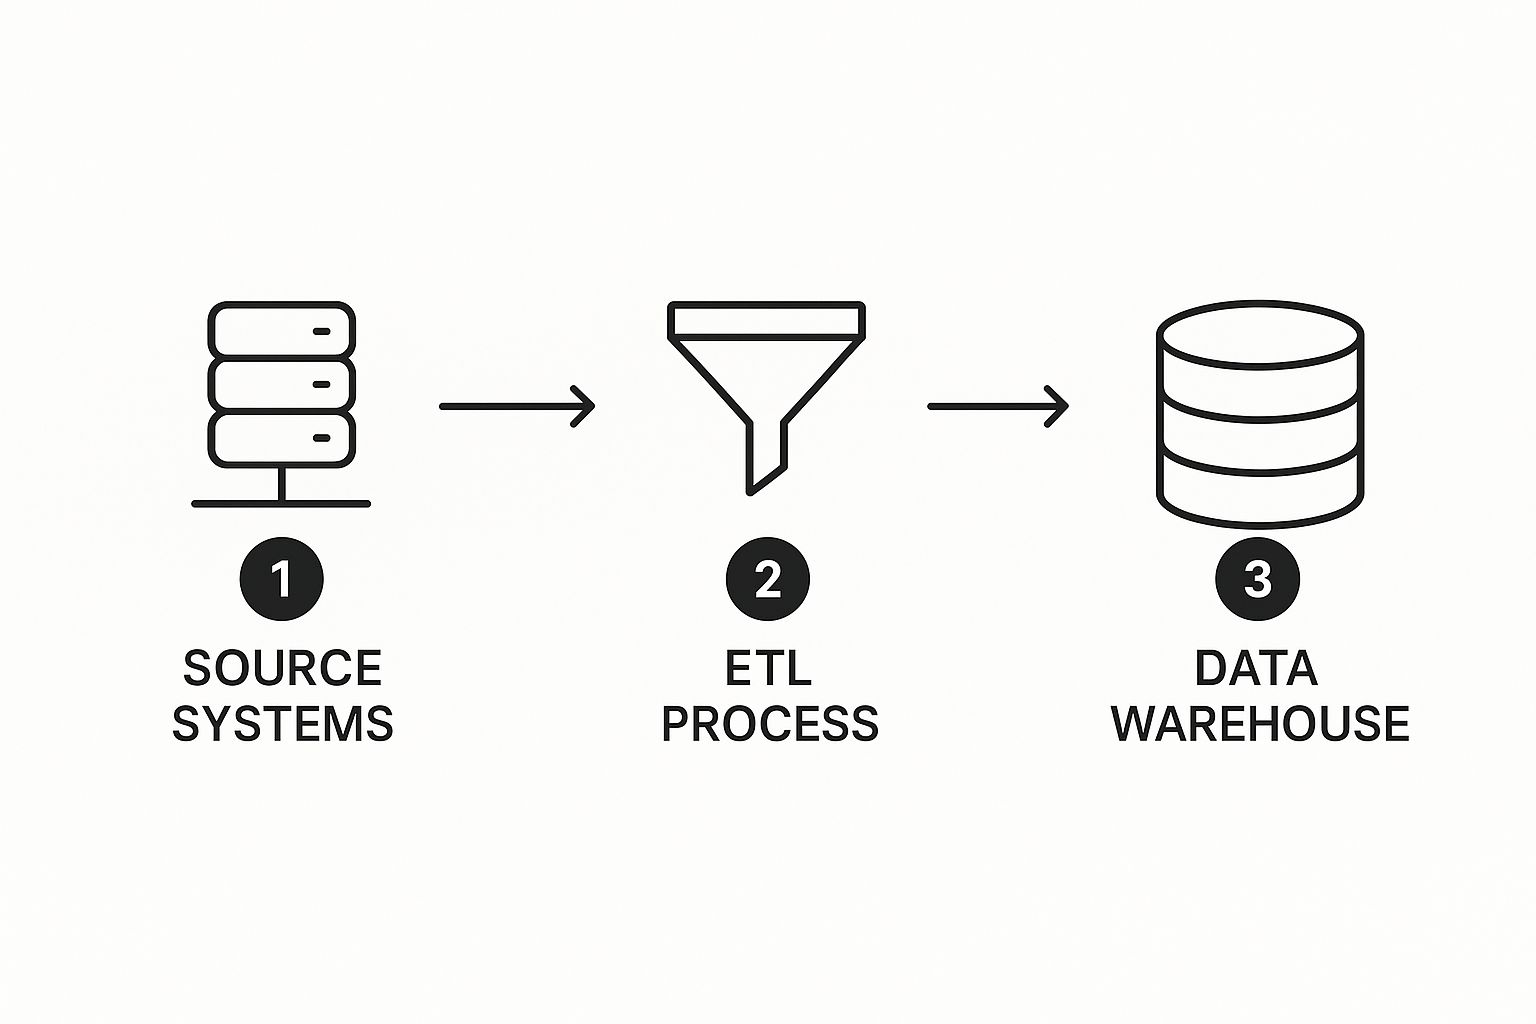
This process is all about taking fragmented data from places like your CRM and accounting software, cleaning it up, and putting it all in one central place—your data warehouse becomes the single source of truth.
A Practical Example: Sketching a Sales Model
Let’s go back to that whiteboard and sketch out a basic sales model for an e-commerce company. The main fact table would be something like SalesTransactions.
Key Takeaway: The fact table is the center of your universe. It holds your core performance metrics and the keys that link out to all your descriptive dimension tables.
This SalesTransactions table would contain your core numbers like Revenue, QuantitySold, and DiscountAmount. Critically, it also holds unique IDs that connect to your dimension tables.
Here’s a quick sketch of how you’d map it out:
- Sales Fact Table: This is your core, holding all the metrics you want to track.
- Customer Dimension: This table has all the info about your customers (Name, Location, Signup Date). It connects to the fact table using a
CustomerID. - Product Dimension: This holds all the details about your products (Product Name, Category, SKU). It connects via a
ProductID. - Date Dimension: A simple but incredibly powerful table that lists every single date. This lets you analyze trends by day, week, month, or quarter. It connects via an
OrderDate.
By sketching out this simple star-like structure—one central fact table with dimensions branching off—you’ve created a logical map of your business. This is the exact kind of blueprint a consultant can take and turn into a powerful, automated reporting system using tools like Power BI.
Ready to turn your business questions into a clear data blueprint? Book your free BI consultation, and we’ll help you design a data model that delivers the insights you need to scale.
How to Choose a Data Warehouse Without Overspending
For a growing business, the term “data warehouse” can sound intimidating. Expensive. Frankly, like total overkill. We’ve seen it time and again: founders stick with chaotic spreadsheets for far too long because they’re haunted by the outdated image of giant, humming server rooms and million-dollar IT projects.
But the game has completely changed. Modern, cloud-based data warehouses have made this powerful technology accessible and affordable for businesses of any size.

Here’s a better way to think about it: you don’t need to buy an entire industrial warehouse just to store your company’s important assets. Instead, you can rent a secure, flexible, and perfectly-sized storage unit that grows right along with you. This is exactly what platforms like Google BigQuery and Snowflake offer.
Shifting from Ownership to Access
The biggest mental shift you need to make is moving from a mindset of owning infrastructure to one of accessing a service. The real beauty of these cloud platforms is their pay-as-you-go pricing.
This flexibility is a massive advantage for small and medium-sized businesses. You’re not locked into a huge upfront investment. Instead, your costs are directly tied to your actual usage—how much data you store and how many queries you run.
What Matters Most to a Founder
When you start comparing platforms, it’s easy to get lost in a sea of technical features. As a business owner, you need to cut through the noise and focus on three practical things that directly impact your bottom line and efficiency.
- Flexible Pricing: Can you start small? Can you scale your costs predictably as your data and analysis needs grow? You’re looking for transparent pay-per-query or pay-per-storage models that don’t trap you in long-term, expensive commitments.
- Seamless Integration: How easily does it plug into the tools you already use, especially reporting platforms like Power BI? A good data warehouse should be a central hub, effortlessly feeding clean data into your dashboards without needing a bunch of complex, manual workarounds.
- Scalability on Demand: Will the platform handle your data needs today and two years from now? The right solution scales automatically, so you never have to worry about performance grinding to a halt as your business expands.
Don’t choose a data warehouse based on a laundry list of technical features. Choose it based on how well it solves your immediate reporting headaches and supports your future growth ambitions without breaking the bank.
Comparing the Top Cloud Contenders
While there are many players out there, three platforms consistently stand out for their power and accessibility, making them excellent choices for small and medium-sized businesses. To get a handle on where these services fit, it helps to understand concepts around online data warehouse solutions.
Here’s a quick, business-focused breakdown:
| Platform | Best For | Key Advantage for Founders |
|---|---|---|
| Google BigQuery | Businesses already in the Google ecosystem (e.g., Google Analytics, Google Ads). | Incredible speed and a very generous free tier to get started, making it low-risk to experiment with. |
| Snowflake | Companies needing flexibility to run on different cloud providers (AWS, Azure, Google Cloud). | Its unique architecture separates storage from compute, meaning you only pay for processing power when you’re actively running queries. |
| Azure Synapse | Businesses heavily invested in the Microsoft stack (e.g., Office 365, Azure services). | Tight integration with Power BI and other Microsoft tools, creating a very cohesive analytics environment. |
The right choice isn’t about which technology is “best” in a vacuum. It’s about which one aligns with your existing tech stack, your budget, and your goals for the future.
Making an informed decision here is a critical step in moving from reactive reporting to proactive, insight-led decision-making. You don’t need to become a technical expert, but understanding these core principles empowers you to have the right conversations and make the right call for your business.
From Warehouse to Insightful Power BI Dashboards
This is where all the upfront strategic work really starts to shine. You’ve painstakingly defined your business questions, mapped out a logical data model, and picked a data warehouse that can grow with you. Now it’s time to connect the pieces and watch how that solid foundation powers the kind of automated, insightful reporting you’ve been aiming for.
We’re moving past the theoretical and into tangible business value. It’s that moment you see your once-scattered data from Stripe, HubSpot, and your finance tools all lined up in clean, organized tables inside a tool like Power BI, ready for some real analysis.
The Magic of a Direct Connection
Picture this: you open Power BI and point it directly to your new data warehouse. Instead of staring at a chaotic mess of Excel files and CSV exports, you see a perfectly structured set of tables: DimCustomer, DimProduct, FactSales. They make immediate sense because they’re a direct reflection of the business logic you designed earlier.
There’s no more manual exporting. No more copy-pasting. The connection is live. This means your reports can be set to refresh on their own schedule—hourly, daily, whatever you need. The days of spending the first week of every month just trying to piece together last month’s data are officially over.
This direct link between your data model data warehouse and Power BI creates a single source of truth. When everyone from finance to sales is looking at the same dashboard, they are all working from the same trusted, up-to-the-minute numbers.
From Raw Data to Actionable Insight in Minutes
With your data so neatly organized, building a report that used to take days of spreadsheet gymnastics becomes a simple drag-and-drop affair.
Let’s jump back to our e-commerce example. You want to see sales trends broken down by product category and customer region. In Power BI, hooked up to your warehouse, here’s what that looks like:
- Drag the
Revenuefield from yourFactSalestable onto the report canvas. - Pull in the
Categoryfield fromDimProductto slice the data. - Add the
RegionfromDimCustomerto create a map visualization.
In under five minutes, you have an interactive dashboard answering a crucial business question. And this isn’t just some static picture; it’s a dynamic tool for exploration. You can click on a specific region on the map and watch the product sales figures update instantly for just that area.
Here’s a glimpse of what a finished Power BI dashboard can look like, bringing together key metrics into one clear, consolidated view.
This is the end goal: having your most important business metrics, from sales figures to marketing performance, available at a glance so you can spot trends and make decisions without delay.
Answering Questions on the Fly
Here it is—the ultimate payoff. A board member casually asks about the performance of a new product line launched last quarter. Instead of the classic, “I’ll have to get back to you on that,” you can filter the dashboard right there in the meeting and give them a data-backed answer in seconds.
This ability to explore data and follow your curiosity is exactly what helps build an agile, responsive business. The true power of this setup isn’t just the automated reports it churns out, but the new questions it empowers you to ask—and answer—on the spot. You can finally drive growth with effective data analysis for your business because the frustrating barriers to getting that analysis done have been torn down.
The confidence that comes from actually trusting your numbers is immense. You’re no longer second-guessing if the data is accurate or complete. You’re free to focus on what the numbers are telling you and, more importantly, what you should do about it.
Common Data Warehouse Mistakes to Avoid
Building a robust data model data warehouse is one of the most powerful moves a growing business can make to unlock genuine insights. But like any major project, the path is littered with potential traps that can completely derail your efforts and, worse, erode trust in your data.
From our time in the trenches with founders and operators, we’ve seen a few common, costly mistakes trip up even the most well-intentioned teams. Knowing what to watch for is half the battle.

The “Boil the Ocean” Approach
The mistake we see most often is trying to do way too much, too soon. Founders get excited about the possibilities and immediately set out to model their entire business—sales, marketing, operations, finance, and HR—all in one go.
This “boil the ocean” strategy almost always backfires, leading to a bloated, delayed project that never actually delivers tangible value.
The reality? A focused, incremental approach wins every single time. Instead of trying to wrangle everything at once, pick one high-impact area where reporting is causing the most headaches.
- Start with Finance: This is usually the best place to begin. Financial data is naturally structured and touches nearly every other part of the business.
- Solve One Problem: Focus on a single, critical report, like an automated P&L statement or a cash flow forecast.
- Build Momentum: When you deliver a quick win, you build trust and prove the system’s value. That makes it a whole lot easier to get buy-in when you’re ready to expand into other departments.
Letting the Technical Team Lead Blindly
Here’s another classic misstep: handing the entire data model design over to a purely technical team that lacks deep business context. While their expertise is absolutely essential for the build, they don’t live and breathe your business operations day in and day out.
This disconnect often results in a data warehouse that is technically perfect but completely fails to answer the questions that actually matter to leadership. The model ends up mirroring the source data’s structure, not the business’s logic.
Your business strategy must drive the technology, not the other way around. The most successful projects are true partnerships. Business leaders define the “what” and “why,” and the technical team executes the “how.”
Neglecting Data Quality Until It’s Too Late
The final—and perhaps most damaging—mistake is treating data quality as an afterthought. So many businesses push forward with building their warehouse, assuming they’ll just “clean up the data later.” This is a fast track to a “garbage in, garbage out” system that nobody trusts.
If your source systems are plagued with duplicate customer records, inconsistent product names, or missing sales data, your shiny new warehouse will only centralize and amplify those problems. Reports will be inaccurate, dashboards will be misleading, and leadership will quickly lose faith in the whole initiative.
A solid data warehouse project includes a dedicated process for cleaning, standardizing, and validating data before it ever enters the system. This proactive approach is the only way to build a reliable single source of truth. For a deeper look at turning raw data into strategic assets, check out our guide on what business intelligence and analytics can do for SMBs.
Frequently Asked Questions
When you’re focused on running your business, diving into the world of data warehousing can bring up a lot of questions. That’s completely normal. Here are some straightforward answers to the most common queries we get from founders and operators just like you.
Is a Data Warehouse Overkill for My Small Business?
Not anymore. This is a common and totally understandable concern, but the technology has changed in a big way. With modern cloud platforms like Google BigQuery or Snowflake, you can start small and pay only for what you use. The days of needing a massive upfront investment are long gone.
Think of it as laying a scalable foundation. It’s about preventing the reporting chaos and technical debt that inevitably build up when you rely only on spreadsheets as you grow. You’re building for the business you want to become, not just the one you have today.
How Long Does This Process Actually Take?
We’re talking weeks, not years. The old “boil the ocean” approach is a classic recipe for failure. Instead, we pinpoint your most urgent reporting pain point first—like getting a clear, automated sales and marketing dashboard up and running—so you can see a real return on your investment, fast.
Our agile approach is all about delivering rapid, iterative value. We solve one critical problem, prove the concept works, and then we build from there, expanding the data model to other business areas based on your priorities.
Can I Still Use Excel with a Data Warehouse?
Absolutely, and your relationship with it will improve dramatically. Instead of being a clunky, manual database, Excel becomes what it was always meant to be: a powerful, flexible analysis tool that connects directly to your new single source of truth—the data warehouse.
You get to keep using the familiar interface of Excel for ad-hoc analysis and financial modeling. The difference? You’ll have complete confidence that the underlying data is clean, governed, and consistent for everyone in the company. No more version control nightmares.
What Is the Best First Step to Get Started?
The best first step is simply having a conversation about your business goals and current reporting frustrations. You don’t need to be a technical expert or have everything figured out. Our first discovery call is all about understanding what questions you’re trying to answer and what decisions you’re struggling to make with your current setup.
From that conversation, we can map out a practical, phased approach that delivers immediate value and sets you up for long-term success. The journey from data chaos to clarity starts by defining the problem from a business perspective, not a technical one.
Ready to stop wrestling with spreadsheets and finally trust your data? The team at Vizule is here to help you connect the dots. We build the automated reporting stacks that empower founders to make smarter, faster decisions.
Book your free BI consultation today and let’s design a solution that actually fits your business.


