


For small and medium-sized business (SMB) owners and founders, financial forecasting can often feel like navigating a maze blindfolded. You're bogged down in a tangled web of spreadsheets, wasting hours on manual data entry, and constantly second-guessing the accuracy of your numbers. This 'Excel chaos' isn't just a source of frustration; it's a significant barrier to scaling your business effectively. It prevents you from gaining clear visibility into performance, aligning your finance and operations teams, and making the confident, insight-led decisions that drive growth.
The solution isn't another complex, layered spreadsheet. It's about adopting a structured, professional approach to your data. A robust financial model serves as the central nervous system for your business, connecting operational drivers to financial outcomes and enabling proactive, rather than reactive, management. Without this foundation, strategic planning becomes guesswork, and opportunities are missed.
In this guide, we'll break down the eight crucial financial modelling best practices that separate high-growth companies from the rest. Following these principles will help you transform your reporting from a time-consuming chore into a powerful strategic asset. We will move beyond generic advice and provide actionable steps to build models that are transparent, flexible, and reliable.
You will learn how to:
- Structure models with a clear and logical flow.
- Implement robust scenario and sensitivity analysis.
- Maintain dynamic links between financial statements.
- Standardize formatting for clarity and auditability.
These principles are the first step toward automating your reporting stack and finally trusting your data. By mastering them, you can escape the spreadsheet trap and build a solid foundation for sustainable, data-driven growth.
1. Structure Models with Clear Logic Flow and Documentation
A well-structured financial model is the bedrock of reliable analysis. Its primary purpose is not just to produce a number, but to tell a clear, defensible story about your business's financial future. This foundational best practice involves organizing your model into distinct, logical sections for inputs, calculations, and outputs. This separation prevents confusion and makes the model significantly easier to audit, update, and understand for anyone who wasn't involved in its creation.
Think of it as the architectural blueprint for your finances. Just as a building needs a solid foundation and a logical floor plan, a model needs a clear structure to remain stable and functional. This disciplined approach ensures that any user—from your finance lead to a potential investor—can quickly trace how a key output, like Net Income, is derived from its source assumptions.
Key Implementation Steps
Implementing a logical flow is straightforward and pays dividends in clarity and error reduction.
- Separate Worksheets by Function: Dedicate individual sheets for key components. A typical setup includes sheets for
Assumptions & Drivers,Historical Financials,Calculations(e.g., debt schedule, depreciation),Financial Statements(IS, BS, CFS), andOutputs & Charts. - Use Consistent Formatting: Color-coding is a simple yet powerful tool. A common convention is to use blue text for hard-coded inputs or assumptions, black text for formulas and calculations, and green text for links to other worksheets. This visual system instantly tells a user the nature of any given cell.
- Document Everything: Every critical assumption should be annotated. Use comments or a dedicated "Assumptions Log" to explain the rationale behind key drivers, like a 5% year-over-year revenue growth rate. This transparency is crucial for defending your model's conclusions.
The infographic below illustrates the fundamental flow that a well-structured model should follow, moving from inputs to outputs in a clear sequence.
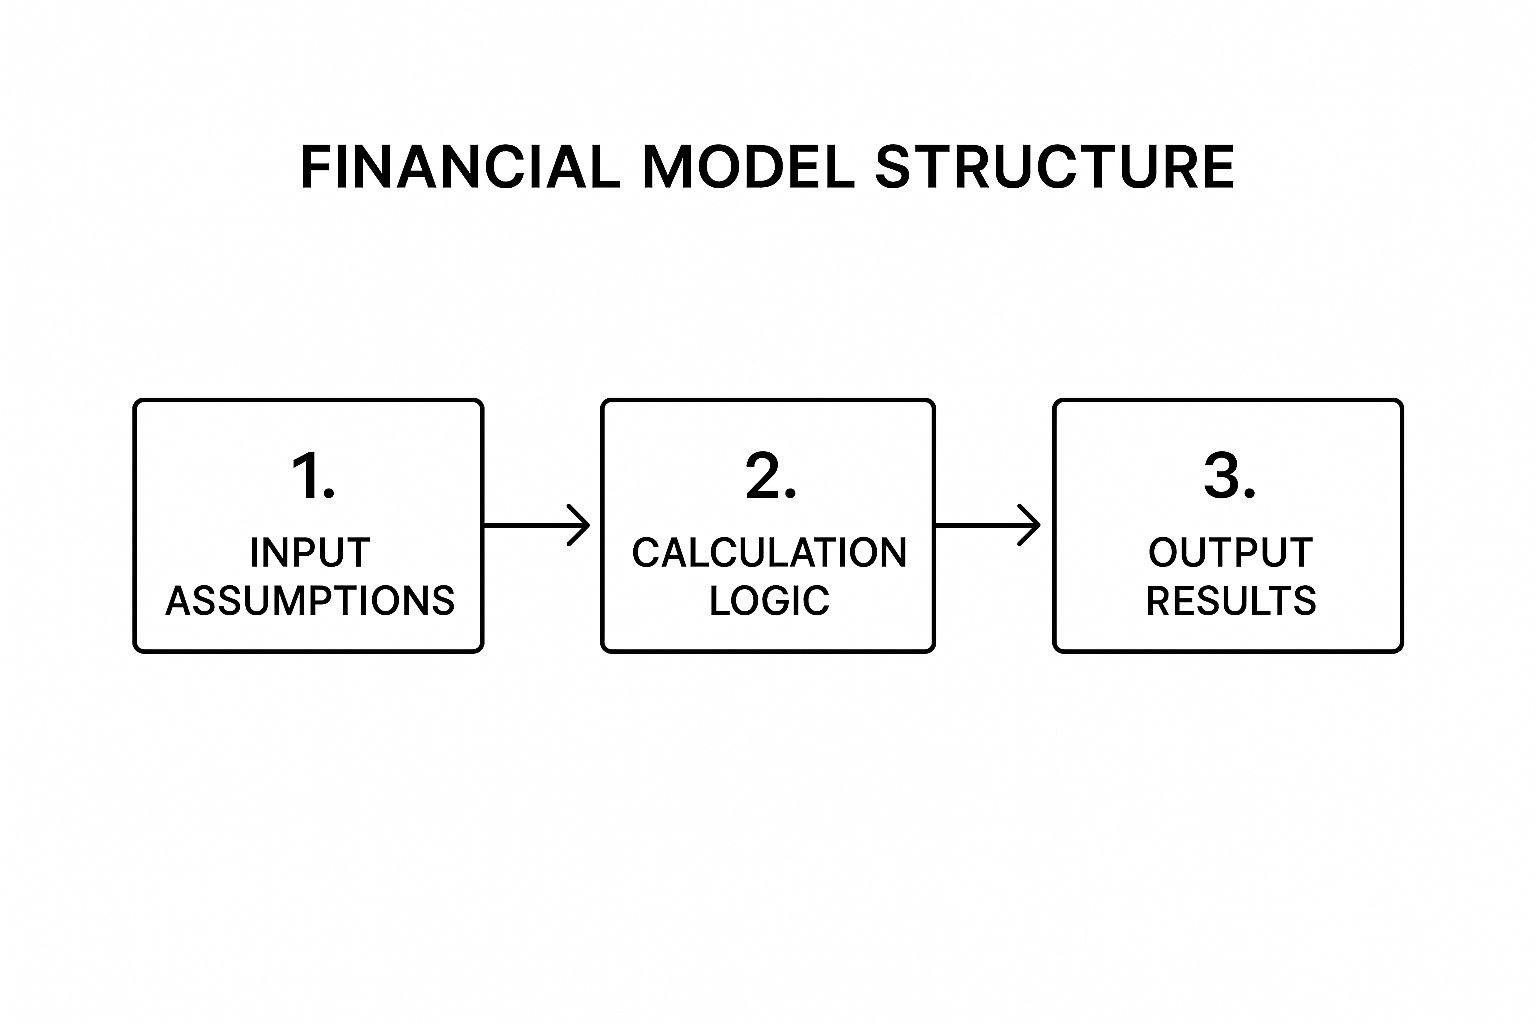
This process ensures that any change to an input assumption logically flows through the calculation engine to update the final results, maintaining model integrity. Building a robust model from the ground up prevents the common "Excel chaos" that frustrates many business operators.
2. Implement Robust Scenario and Sensitivity Analysis
A financial model's true power isn't just in producing a single forecast; it's in its ability to answer "what if?" questions. Building a model that can easily test multiple scenarios and analyze how changes in key variables impact outcomes is a critical financial modelling best practice. This involves creating a flexible framework to understand the full spectrum of potential business futures, moving beyond a static, single-point prediction.
For an SMB founder, this practice transforms a financial model from a simple calculator into a strategic decision-making tool. Instead of a single "base case," you can model an "upside," "downside," or other specific situations, like a key competitor entering the market or a shift in supply chain costs. It provides a clear view of which assumptions drive the most value and where the biggest risks lie.

Key Implementation Steps
Integrating dynamic analysis into your models is essential for stress-testing your strategy and making informed decisions under uncertainty.
- Isolate Key Drivers: Identify the 3-5 most critical variables that create the most significant value variation in your model. For a SaaS company, this might be customer acquisition cost (CAC) and churn rate. For an e-commerce business, it could be conversion rate and average order value.
- Build a Scenario Manager: Use dropdowns or switches (e.g., using
CHOOSEorINDEXfunctions in Excel) to toggle between different sets of assumptions. This allows you to instantly see how the entire model, from the income statement to the cash flow, reacts to a change from a "Base Case" to a "Recession Case." - Use Data Tables for Sensitivity: For analyzing one or two variables at a time, Excel's Data Tables are invaluable. You can quickly create a matrix showing how your cash runway changes with incremental shifts in both revenue growth and operating expenses, providing a powerful visual summary of risk.
- Summarize Outcomes Clearly: Create an executive summary dashboard that neatly presents the key outputs (e.g., EBITDA, Free Cash Flow, Cash Runway) for each scenario side-by-side. This makes the results digestible for leadership and facilitates strategic conversations.
By implementing these techniques, your model becomes a living tool for navigating uncertainty. If you are struggling to build models that can handle this level of dynamic analysis, it may be time to move beyond chaotic spreadsheets. book your free BI consultation today to see how Vizule can help build a robust financial reporting stack that supports strategic scenario planning.
3. Maintain Dynamic Links Between Financial Statements
A truly powerful financial model is more than a collection of separate forecasts; it's an integrated ecosystem where every piece communicates. This best practice involves dynamically linking the three core financial statements: the income statement, balance sheet, and cash flow statement. When linked correctly, a change in one statement automatically and accurately flows through the others, ensuring the entire model remains balanced and logically consistent.
This three-statement model provides a holistic and dynamic view of your company's financial health. The core principle is that the balance sheet must always balance (Assets = Liabilities + Equity), and the cash flow statement serves as the bridge between the income statement and balance sheet from one period to the next. Achieving this dynamic link is a crucial step in moving from basic spreadsheets to professional-grade financial modelling best practices.

Key Implementation Steps
Building an integrated three-statement model requires precision and a clear, sequential process to avoid errors and ensure everything balances.
- Follow a Logical Build Order: Start with the income statement to calculate Net Income. Then, build the supporting schedules (e.g., debt, depreciation, working capital) that will feed into the other statements. Next, project the balance sheet, linking in Net Income to Retained Earnings. Finally, construct the cash flow statement, which reconciles the changes in balance sheet accounts and should ultimately link to the cash balance on the balance sheet.
- Implement Balance Checks: Create a dedicated row at the bottom of your balance sheet that calculates
Total Assets - (Total Liabilities + Equity). This cell should always equal zero. If it doesn't, an error flag (e.g., a cell that turns red or displays "ERROR") can immediately alert you to a problem in your model's logic. - Manage Circular References: The link between interest expense (on the income statement) and the average debt balance (on the balance sheet) often creates a circular reference. While Excel can handle these, they can slow down the model and mask errors. A best practice is to use a "circuit breaker" or a simple toggle switch that allows you to turn the circularity on and off during model construction.
This interconnected structure is essential for any scenario analysis. For instance, if you model an increase in marketing spend, the dynamic links will automatically update expenses on the income statement, cash on the balance sheet, and cash flow from operations, providing an immediate, comprehensive view of the decision's impact. If you're tired of manually reconciling statements, it may be time to professionalize your financial reporting. Connect with us to design your financial dashboard in Power BI.
4. Use Consistent and Logical Cell Referencing
A model's internal plumbing—its system of cell references—is just as critical as its high-level structure. Inconsistent or illogical referencing creates a "spaghetti junction" of formulas that are impossible to audit, scale, or debug. This financial modelling best practice is about creating a clean, predictable, and transparent web of calculations that can be easily understood and expanded upon. It ensures that formulas can be copied across rows and columns without breaking, dramatically speeding up development and reducing the risk of manual error.
Think of it as establishing a clear set of traffic rules for your data. When every formula follows the same referencing logic, information flows predictably from one calculation to the next. This discipline prevents the kind of hidden errors that can undermine an entire forecast, such as a formula accidentally pointing to the wrong period's growth rate. Mastering referencing is a core skill that separates amateur spreadsheets from professional-grade financial models.
Key Implementation Steps
Adopting a systematic approach to cell referencing is essential for building robust and easily auditable models.
- Use Mixed References Strategically: This is the cornerstone of efficient model building. By using the
$sign to "lock" either a column (e.g.,$A1) or a row (e.g.,A$1), you can write a single, elegant formula that can be dragged across an entire schedule. For example, in a revenue forecast, you might lock the column for the unit price ($B5) but allow the row for the time period (C$4) to change. - Create Named Ranges for Key Inputs: Assigning plain-English names (e.g.,
Revenue_Growth_Rate,Tax_Rate) to key assumption cells via the Name Manager makes formulas instantly readable. A formula like=B22*(1+Revenue_Growth_Rate)is far more intuitive and less error-prone than=B22*(1+$C$5). - Avoid Hardcoding Within Formulas: Never type a numerical assumption directly into a formula (e.g.,
=A1*1.05). This is a cardinal sin of financial modelling. Always link to a dedicated input cell. This practice centralizes all assumptions, making scenario analysis and updates simple and transparent. - Use Dynamic Referencing for Flexibility: Functions like
INDEX/MATCHorOFFSETare powerful tools for building dynamic models that can handle changes in scope, such as adding new business segments or time periods, without requiring a complete formula overhaul.
5. Implement Comprehensive Error Checking and Validation
Even the most logically structured model can fail if it contains hidden errors. A robust financial model must be self-auditing, with built-in mechanisms to flag inconsistencies and mistakes before they can impact critical business decisions. This best practice involves embedding a comprehensive system of checks and validations directly into the model to ensure its accuracy, integrity, and reliability. Without these safeguards, small calculation errors or broken links can compound, leading to flawed conclusions and a loss of confidence in your numbers.
Think of this as your model's immune system, designed to identify and isolate problems automatically. The most fundamental check is ensuring the balance sheet balances; if it doesn't, it's an immediate signal that something is fundamentally broken within the model's logic.
Key Implementation Steps
Integrating validation layers transforms a static spreadsheet into a dynamic, self-regulating tool. This is a core tenet of professional financial modelling best practices that prevents costly mistakes.
- Create a Central Error Check Dashboard: Dedicate a specific section or an entire worksheet to summarizing all validation checks. This dashboard should provide a clear, at-a-glance view of the model's health. Use simple formulas like
IF(Balance_Sheet_Check=0, "OK", "ERROR")to create status indicators. - Use Conditional Formatting: Make errors impossible to ignore by using conditional formatting to highlight problem cells. For instance, you can set a rule that turns a balance check cell bright red if its value is anything other than zero. This visual cue is far more effective than relying on someone to manually scan for small numbers.
- Implement Both Mathematical and Logical Tests: Go beyond simple arithmetic. A balance sheet check is mathematical (
Assets - Liabilities - Equity = 0). A logical reasonableness test might check if revenue growth exceeds a plausible ceiling (e.g., 100% year-over-year) or if gross margin turns negative, flagging assumptions that may be overly optimistic or incorrect.
By building these checks into your model from the start, you create a more resilient and trustworthy tool. This discipline ensures that as the model evolves, its core integrity remains intact, preventing the kind of "Excel chaos" that plagues so many growing businesses.
6. Design for Flexibility and Scalability
A static financial model is a liability in a dynamic business environment. The best models are not just accurate at a single point in time; they are built to evolve. Designing for flexibility and scalability means creating a model that can easily accommodate changes in assumptions, time periods, or business segments without requiring a complete structural overhaul. This forward-thinking approach is fundamental to creating a lasting and valuable analytical tool.
Think of your model as a living document rather than a one-off calculation. As a founder, your strategies pivot, new product lines are launched, and market conditions change. A flexible model allows you to test these new realities quickly and efficiently, ensuring it remains a relevant decision-making tool long after its initial creation and saving countless hours on future rebuilds.
Key Implementation Steps
Building a scalable model involves using dynamic formulas and modular design principles from the outset.
- Use Dynamic Formulas: Avoid hard-coding time periods or ranges. Instead, use functions like
INDEX/MATCH,OFFSET, andSUMIF. For example, instead of summingC5:N5for a 12-month period, use aSUMIFbased on a "Year" row, allowing you to easily add or remove periods without breaking formulas. - Create Flexible Input Tables: Structure your assumption sheet with clear, well-defined tables. This modular approach allows you to add a new business segment or product line by simply adding new rows to the table. The calculation engine can then be built to dynamically reference these tables, automatically incorporating new data.
- Design Replicable Calculation Blocks: Ensure that calculation logic for one item (e.g., a single product's revenue forecast) can be easily dragged or copied for new items. Avoid creating bespoke, one-off formulas for each line item, as this creates a maintenance nightmare when you need to expand the model.
By embedding these techniques, you ensure the model can handle your company's growth and strategic shifts. This is a core component of advanced financial modelling best practices that separates a good model from a great one. Building a robust, scalable model is the first step toward automating your financial reporting and gaining deeper business insights.
7. Standardize Formatting and Visual Design
A financial model's credibility is judged not just on its accuracy, but also on its presentation. Standardizing formatting and visual design is a critical best practice that transforms a functional spreadsheet into a professional, intuitive, and trustworthy analytical tool. This practice involves creating and adhering to a consistent set of rules for colors, fonts, number formats, and layout, making the model significantly easier for any user to navigate and interpret.
Think of it as the user experience (UX) design for your financial analysis. A well-formatted model guides the user's eye and reduces cognitive load, allowing them to focus on the insights rather than deciphering the spreadsheet. This approach ensures your financial story is communicated with professionalism, whether you're presenting to your internal team, a bank, or potential investors.
Key Implementation Steps
Implementing consistent visual standards is a high-impact, low-effort way to elevate your financial modelling best practices and reduce errors born from misinterpretation.
- Create a Formatting Guide: Document a clear set of standards. A common convention, as mentioned earlier, is using blue text for inputs, black for formulas, and green for links to other sheets or files. This guide should also specify number formats (e.g., one decimal for percentages, comma separators for thousands), font choices, and cell-fill colors for headings and totals.
- Leverage Excel's Built-in Tools: Use Cell Styles and Themes in Excel to apply your standards consistently with a single click. Instead of manually formatting each cell, you can create styles like "Input," "Calculation," or "Heading" that contain all your predefined formatting rules. This saves time and prevents inconsistencies.
- Design for Presentation: Always build your model with the end-user in mind. Consider how it will look when printed or pasted into a presentation. Use print-friendly layouts, clear headers and footers, and ensure charts and tables are easily readable without their surrounding Excel grid. A model that is easy to present is often one that is easy to understand.
This disciplined approach to design ensures your model communicates its story effectively, reflecting the same level of professionalism and care that went into the underlying analysis. For businesses tired of wrestling with inconsistent and confusing spreadsheets, establishing these standards is a foundational step toward clarity.
8. Build Models with Audit Trails and Version Control
A financial model is a living document, evolving with new data, shifting assumptions, and multiple stakeholder inputs. Without a systematic way to track these changes, a model can quickly become a "black box" where modifications are untraceable and errors are impossible to pinpoint. Implementing audit trails and version control is a critical financial modelling best practice that brings accountability and transparency to your financial planning.
Think of it as the model's official logbook. As a founder, you must document the evolution of your financial story. This practice ensures that every version is preserved and every major change is justified. It provides a rollback capability, allowing you to revert to a previous state if an error is introduced, and creates a clear history for auditors or new team members to follow. This traceability is essential for building trust with investors and your leadership team.
Key Implementation Steps
Establishing a robust versioning system protects the integrity of your work and streamlines collaboration.
- Implement a File Naming Convention: The simplest and most effective step is a consistent naming system. A common format is
ModelName_YYYY-MM-DD_vX.X.xlsx(e.g.,Q4_Forecast_2024-10-15_v2.1.xlsx). This instantly communicates the model's purpose, date, and version. - Create a Change Log: For major updates, maintain a dedicated "Change Log" or "Version History" tab within the model itself. This log should detail the version number, date of change, the author, and a clear description of the modifications made.
- Use Excel's Collaboration Features: For real-time teamwork, leverage features like Track Changes or Comments to highlight modifications and ask questions directly within the spreadsheet. This keeps the audit trail tied to the specific cells being adjusted.
- Maintain Backup Copies: Before making significant structural changes, always save a backup copy of the current working version. This acts as a safety net, ensuring you can always restore a stable, functional model if needed.
Adopting these habits transforms your model from a static file into a well-documented, auditable asset. This level of organization is a cornerstone of strong data governance, ensuring that your financial reporting is both accurate and defensible.
Financial Modelling Best Practices Comparison
| Item | Implementation Complexity 🔄 | Resource Requirements ⚡ | Expected Outcomes 📊 | Ideal Use Cases 💡 | Key Advantages ⭐ |
|---|---|---|---|---|---|
| Structure Models with Clear Logic Flow and Documentation | Medium – upfront planning and detailed documentation needed | Moderate – time investment for clear structure and annotation | Reduced errors, easier audits, better collaboration | Investment banking, private equity, corporate budgeting templates | Error reduction, maintainability, transparency |
| Implement Robust Scenario and Sensitivity Analysis | High – complex frameworks and simulation tools required | High – needs multiple scenario setups and tools like Monte Carlo | Comprehensive risk assessment, improved decision-making | Commodity price evaluation, real estate, SaaS churn analysis | Risk insight, decision support, stakeholder confidence |
| Maintain Dynamic Links Between Financial Statements | High – advanced linking and balancing skills needed | High – integrated statements with error-checking | Consistent, balanced financial statements | LBOs, mergers, corporate forecasting | Mathematical consistency, valuation accuracy |
| Use Consistent and Logical Cell Referencing | Medium – disciplined formula and naming conventions needed | Low to Moderate – initial setup of named ranges | Reduced formula errors, scalable model formulas | Revenue models, depreciation schedules, multi-segment analysis | Error minimization, auditability, flexibility |
| Implement Comprehensive Error Checking and Validation | Medium to High – multiple error checks and validations | Moderate – requires adding checks and automated flags | Prevents costly errors, increases confidence | Investment banking, credit risk, corporate budgeting | Error prevention, audit readiness, debugging efficiency |
| Design for Flexibility and Scalability | High – advanced dynamic formulas and modular design required | High – ongoing updates for dynamic inputs and segments | Adaptable models that support growth and change | Strategic planning, M&A, product portfolio modeling | Longevity, scenario adaptability, multiple use cases |
| Standardize Formatting and Visual Design | Low to Medium – consistent formatting standards to enforce | Low – mainly design and style application | Improved readability and professionalism | Investment banking pitchbooks, consulting deliverables | Usability, faster reviews, consistent user experience |
| Build Models with Audit Trails and Version Control | Medium – process discipline and documentation needed | Moderate – setup of tracking and control systems | Accountability, rollback ability, regulatory compliance | Regulated institutions, SOX compliance, multi-stakeholder projects | Transparency, error recovery, collaboration support |
Turn Your Data into Your Most Powerful Asset
Moving from chaotic spreadsheets to a sophisticated, dynamic financial model is not merely an upgrade; it's a fundamental business transformation. Throughout this guide, we've explored the essential pillars of financial modelling best practices. These aren't just technical tips; they are strategic principles designed to turn your financial data from a historical record into a powerful asset for future growth.
Adopting these practices means you can finally trust your numbers. A model built with a clear logic flow, standardized formatting, and comprehensive error checking becomes your single source of truth. It eradicates the doubt and second-guessing that plague decisions made from unreliable, manually updated spreadsheets. You gain the confidence to act decisively, backed by data you know is accurate and transparent.
From Reactive Reporting to Proactive Strategy
The true power of mastering these techniques lies in shifting your finance function from a reactive, backward-looking role to a proactive, forward-looking strategic partner.
- Strategic Foresight: Implementing robust scenario and sensitivity analysis, as we discussed, allows you to game-plan for the future. Instead of just asking "What happened?", you can now ask "What if?". What if a key supplier increases prices by 10%? What if our new marketing campaign doubles lead generation? A well-built model gives you instant answers, stress-testing your strategy against real-world possibilities.
- Operational Agility: Designing for flexibility and scalability ensures your model grows with your business, not against it. As you launch new products, enter new markets, or change your operational drivers, a dynamic model adapts seamlessly. This agility is a significant competitive advantage, allowing you to pivot faster than competitors who are still wrestling with broken formulas in static Excel files.
- Enhanced Stakeholder Confidence: A model with clear documentation, version control, and an audit trail is not just easier for your team to use; it's also more credible to investors, lenders, and board members. When you can clearly articulate your assumptions and demonstrate the integrity of your financial projections, you build the trust necessary to secure funding and gain strategic alignment.
The overarching theme connecting all these best practices is the transition from manual, time-consuming data wrangling to automated, insight-driven decision-making. Imagine reclaiming the countless hours your team spends copying, pasting, and correcting data. Instead, that time is invested in analysing trends, identifying opportunities, and charting a clear course for the business. This is the ultimate goal: to spend less time managing data and more time using it to drive value.
However, we understand the reality for most SMB owners and operators. Knowing what to do is one thing; finding the time and technical expertise to implement it consistently is another. The day-to-day pressures of running a business often push these critical infrastructure projects to the back burner, leaving you stuck in a cycle of inefficient reporting. This is where dedicated expertise becomes a game-changer.
Ready to Build a Financial Reporting Engine That Drives Growth?
Implementing these financial modelling best practices can feel overwhelming, but you don't have to do it alone. At Vizule, we specialize in transforming siloed data and cumbersome spreadsheets into automated, insightful Power BI dashboards that give you a real-time view of your business. If you're ready to stop fighting with Excel and start making confident, data-driven decisions, book your free BI consultation today and discover how we can build a single source of truth for your business.


