


Staring at a tangled Excel sheet, wondering if the numbers are even right? It’s a familiar, frustrating cycle for countless small business owners and founders. You're bogged down by manual data entry, haunted by broken formulas, and relying on static reports that are obsolete the moment they’re finished. This dependence on spreadsheets isn't just clunky; it's a huge risk to your growth.
Financial forecasting software for small business automates this process, replacing manual guesswork with a live, accurate view of your financial health. These tools connect directly to your accounting, sales, and operational systems to create a single source of truth, empowering you to make strategic decisions with confidence.
Moving Beyond Risky Spreadsheet Forecasts
You didn't start a business to become a full-time spreadsheet administrator. Yet, here we are. Hours get torched every month trying to wrangle data, fix those dreaded #REF! errors, and hunt down the actual latest version of a file named Forecast_v4_FINAL_use_this_one.xlsx.
This manual grind is more than just a time-sink. It’s a strategic liability that breeds flawed decisions and puts your business at a disadvantage.

When your financial forecasting is built on a patchwork of spreadsheets, you’re gambling with your cash flow, hiring plans, and your entire growth trajectory.
The Hidden Dangers of Spreadsheet Forecasting
Relying solely on Excel or Google Sheets builds your most critical business decisions on a fragile foundation. The cracks really start to show as your business grows and your data gets more complex.
A study from the University of Hawaii found that nearly 90% of spreadsheets contain errors. That’s a terrifying statistic for any founder making payroll or investment decisions based on these docs.
The most common culprits are pains we’ve all felt:
- Manual Data Entry Errors: A single typo or a copy-paste mistake can poison your entire model, leading to wildly inaccurate projections. This is ground zero for miscalculating your cash flow.
- Broken Formulas and Links: As spreadsheets get more complicated, formulas inevitably break and links to other files get corrupted. Suddenly, you're looking at a "black box" where you can't trust the output anymore.
- No Single Source of Truth: With multiple versions of a forecast floating around on different devices and in email chains, it's impossible to know which numbers are right. This chaos breeds confusion and kills team alignment.
The real cost of spreadsheet chaos isn't the time wasted on manual updates; it’s the flawed strategic decisions made with unreliable data. From hiring too quickly to underpricing a major contract, these errors have long-term consequences.
Ultimately, spreadsheet-based forecasting locks you in a reactive loop. You're constantly fixing yesterday's data instead of proactively planning for tomorrow. The only way out is to ditch this manual, error-prone process for an automated, reliable system.
Dedicated financial forecasting software for small business creates a single, trustworthy source of truth. By automatically pulling data from your accounting, sales, and operational systems, these tools give you a live, dynamic view of your financial health. It’s about finally moving from reactive guesswork to confident, insight-led strategy.
Ready to automate your reporting and finally trust your data? Book your free BI consultation and let Vizule show you how to leave spreadsheet chaos behind for good.
Decoding Must-Have Software Features
When you start digging into financial forecasting software, the feature lists can feel like they're written in another language. "Driver-based modeling," "multi-scenario analysis," "automated consolidations"—what do these buzzwords actually do for your business? Let's cut through the jargon.
The goal isn't to find the software with the most bells and whistles. It's about finding a tool that solves your specific headaches and helps you hit your strategic goals. Think of it less as buying software and more as hiring a tireless financial analyst for your team.
For instance, automated data integration is your non-negotiable starting point. This means no more late nights manually exporting CSVs from your accounting software or CRM. It creates a live, direct pipeline from your data warehouse, ensuring your forecast is always built on the latest, most accurate financial picture.
Core Capabilities That Drive Real Results
Beyond just pulling in data, a few key capabilities separate the truly useful tools from glorified spreadsheets. These are the features that actually unlock strategic insight and, most importantly, give you back your time.
First up is scenario and what-if analysis. This is where you finally get to be proactive. Instead of just tracking what happened, you can model what could happen.
- Hiring Decisions: Instantly see the financial impact of bringing on a new salesperson—factoring in salary, commissions, and their projected revenue.
- Pricing Adjustments: Model how a 10% price increase might affect your cash flow and bottom line, even if sales volume dips a bit.
- Market Changes: Simulate what happens if a key supplier raises prices or a new competitor enters the market.
This feature transforms your forecast from a static report into a dynamic strategic sandbox.
Next, you need three-way forecasting. This is a big one. It means the software automatically links your Profit & Loss (P&L), Balance Sheet, and Cash Flow Statement. When a big sale boosts your P&L, this feature ensures your cash and balance sheet update correctly and instantly. It’s critical for avoiding that classic small business trap: being profitable on paper but running out of cash. For a deeper dive, check out our guide on how to improve forecast accuracy.
Visualizing the Impact of Automation
The difference between wrestling with spreadsheets and using dedicated software is night and day. It impacts everything from accuracy to the sheer amount of time you spend on grunt work. This comparison really highlights the gains.
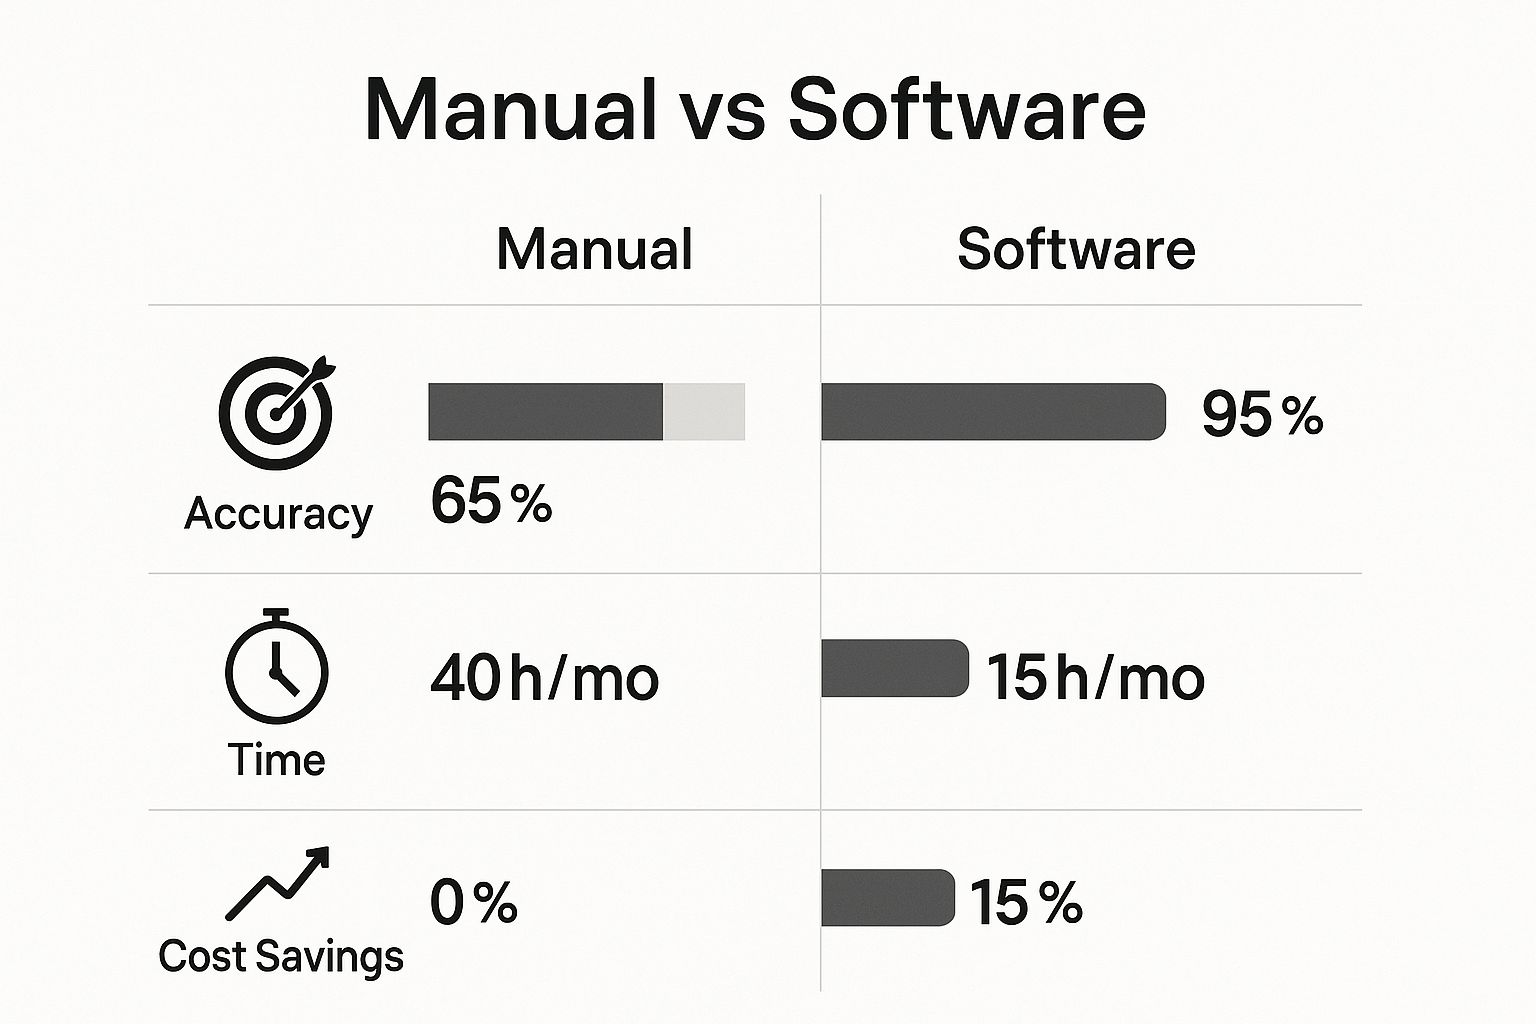
As you can see, this isn't just a small improvement; it's a fundamental shift in how efficiently and reliably you can run your financial operations.
To help you cut through the noise when talking to vendors, here's a quick cheat sheet connecting key features to the tangible business value they provide.
Essential Software Features and Their Business Impact
This table breaks down what to look for and, more importantly, why it matters for your day-to-day operations.
| Key Feature | What It Delivers for Your Business | Question to Ask Vendors |
|---|---|---|
| Automated Data Integration | Ends manual data entry and ensures your forecast is always based on real-time numbers. | "Which accounting systems, CRMs, and payment processors do you integrate with directly?" |
| Scenario & What-If Analysis | Lets you model different business decisions (like hiring or price changes) to see the financial impact before you commit. | "Can you walk me through how I would model the impact of a new hire or a potential marketing campaign?" |
| Three-Way Forecasting | Provides a complete, interconnected financial picture (P&L, Balance Sheet, Cash Flow) so you don't have cash flow surprises. | "How does your system ensure the P&L, Balance Sheet, and Cash Flow Statement are always in sync?" |
| Customizable Dashboards | Allows you to track the specific KPIs that matter to your business, not just generic metrics. | "How easily can I build and modify a dashboard to track my unique business drivers?" |
| Consolidated Reporting | For businesses with multiple entities or locations, this rolls all financial data into one master view. | "Do you support multi-entity consolidation, and how does it handle intercompany transactions?" |
Thinking in terms of problems and solutions, rather than just features, will lead you to the right tool much faster.
Finally, look for customizable dashboards and reporting. A one-size-fits-all dashboard is pretty much useless. You need the power to track the Key Performance Indicators (KPIs) that actually drive your business—whether that's customer acquisition cost, monthly recurring revenue, or inventory turnover.
When you can see your most important metrics in one place, updated in real time, you can finally stop guessing and start running your business by the numbers with confidence.
Choosing the Right Tool for Your Growth Stage
Let’s be honest: the perfect financial forecasting software for a small business simply doesn’t exist in a one-size-fits-all package. The simple, lightweight tool that a solo founder needs to pitch for pre-seed funding is a completely different beast from what a 50-person company requires to manage its growing operational complexity.
Getting this right means matching your software choice to where your business is right now. It's the key to making a smart investment instead of a frustrating one.
For any early-stage startup, the financial world really boils down to one thing: cash runway. Founders need a straightforward, no-fuss way to project cash flow, model their burn rate, and tell a compelling financial story to investors. The focus isn't on granular operational details; it's all about high-level viability.

At this point, you're looking for user-friendly tools that get the job done quickly. Think lightweight platforms that can integrate with your accounting software to give you essential cash flow reporting without the intimidating complexity—or the hefty price tag—of an enterprise-grade system. The goal here is clarity and speed, not getting bogged down in overwhelming detail.
As Your Business Matures
Once you’ve found your footing, built a team, and have consistent revenue coming in, your forecasting needs will change—dramatically. The conversation shifts from just projecting cash to truly understanding what drives your performance. This is where more sophisticated platforms become non-negotiable.
An established SMB needs a tool that can handle a few key things:
- Driver-Based Forecasting: This is a game-changer. It means your forecasting model understands how a tweak to a core business metric—like your website's conversion rate or a sales rep's quota—directly ripples through your revenue and expenses. You stop guessing and start calculating.
- Detailed Scenario Analysis: You've moved beyond the simple "best case" and "worst case" models for VCs. Now you need to model the real-world impact of opening a new office, launching a product, or dealing with a sudden supply chain mess.
- Departmental Budgeting: As your teams grow, you need a system that allows department heads to own their budgets. This data should feed into a consolidated, company-wide forecast without creating a nightmare of endless email chains and spreadsheet version control issues.
Choosing a tool that can't scale with you is a classic mistake. The software that feels perfect today could become a frustrating bottleneck in just 12-18 months, forcing you into a costly and disruptive migration process.
Finding the Right Fit for Tomorrow
Modern small business financial management is leaning heavily on robust scenario planning and rolling forecasts. The newer software tools are built to model future financial states from the ground up and automate a huge chunk of the work.
For instance, a platform like Jirav gives small to mid-sized businesses the power of driver-based forecasting for their P&L, balance sheets, and cash flow. It uses structured workflows to automate data reconciliation, saving a ton of manual effort. While its pricing reflects its deep capabilities, it shows where the market is heading: toward tools that help SMBs react quickly to market shifts through real-time data. You can dig deeper into these kinds of AI-powered forecasting tools and their capabilities.
Ultimately, the right choice is one that meets your current operational needs while giving you a clear path for future growth. Whether it’s an entry-level tool or a more powerful system, you’re looking for a solution that supports your long-term vision.
If you're not sure which stage your business falls into or what features you genuinely need, a more consultative approach can bring a lot of clarity. See how Vizule can help design a reporting and forecasting stack that grows right alongside you.
What a Successful Implementation Actually Looks Like
Buying new financial forecasting software for your small business feels like a huge win, but let's be honest—it's just the starting line. The real value isn't in the subscription fee you just paid; it's unlocked during a thoughtful, strategic implementation. Too many businesses get stuck right here, expecting the tool to magically fix their forecasting woes without any groundwork.
Success isn't about flicking a switch. It starts with a crystal-clear understanding of what you need your data to tell you. Before you even think about connecting a single data source, you have to define the critical business questions that are actually keeping you up at night.

This initial strategic step is the one most people skip, and it's the number one reason why expensive software ends up gathering digital dust.
From Business Questions to a Data-Driven Forecast
Let's get practical. Imagine you run a B2B service company. Your sales pipeline feels totally unpredictable, and you’re constantly surprised by which deals close and which ones just stall out.
Your core business questions might be:
- What's the true length of our sales cycle, from that first email to a signed contract?
- Which of our lead sources are actually generating our most profitable clients?
- What's the real probability of a deal closing based on its current stage in our CRM?
These questions dictate how you set up your forecasting model. They tell you exactly which data points are crucial—like lead source, deal stage, and contract value—and which ones are just noise. Without this clarity, you'll just build a generic forecast that tells you nothing you don't already know.
Once you have your questions nailed down, the next non-negotiable step is data transformation. This is where the old saying "garbage in, garbage out" becomes painfully real. A forecasting model built on messy, inconsistent historical data from siloed systems will spit out useless—or worse, dangerously misleading—projections. You've got to ensure your data is clean, standardized, and ready to go before building your KPI dashboards.
The success of any financial forecasting software implementation hinges more on your data strategy than on the software's feature list. A clear plan for defining goals, cleaning data, and modeling business drivers is what separates a powerful tool from an expensive spreadsheet replacement.
Building a Model That Reflects Reality
With clean data and clear questions, you can finally start building a forecast that mirrors how your business actually operates. For our B2B service company example, this means connecting the dots between sales activity and financial outcomes.
Instead of just forecasting a single "revenue" number, a driver-based model forecasts the components that create that revenue:
- Number of new leads coming from each marketing channel.
- Conversion rate from a raw lead to a qualified opportunity.
- Close rate for deals at each specific pipeline stage.
- Average contract value for every new client signed.
This approach transforms your forecast from a static number into a dynamic, interactive tool. Now, you can run real-world scenarios. "What happens to our revenue if we can bump our lead conversion rate by 5%?" The answer is no longer a wild guess; it’s a calculated outcome. This is the power of moving from Excel to Power BI.
Ultimately, a successful implementation means you’re not just looking at reports; you’re asking and answering strategic questions. If you need an expert hand to connect the dots in your data and build a forecast you can finally trust, that’s where we come in.
The Power BI Advantage: A Custom Forecast You Own
What if your financial forecasting software wasn't just another monthly subscription, but a permanent, flexible asset you owned outright?
That’s the fundamental difference when you step away from rigid, off-the-shelf SaaS tools and build a custom solution in Power BI. It's an approach that puts you, the business owner, squarely back in the driver's seat.
Instead of trying to jam your unique business logic into a pre-built box, Power BI becomes your central data hub. It connects directly to the sources you already rely on—your QuickBooks for financials, HubSpot for sales, Stripe for payments—and weaves them into a single, cohesive story about your business.
From there, we can build a forecasting model that is 100% tailored to your actual KPIs and business planning needs. This is how you graduate from generic reports to genuine business intelligence.
From Static Reports to Dynamic Intelligence
Imagine a financial dashboard that does more than just flash a top-line revenue number. Picture a dynamic view where, with a single click, you can dissect that revenue by individual service line, client cohort, or even the performance of a specific sales rep.
This is where you find the real story behind your numbers. It’s the difference between knowing what happened and finally understanding why.
Here’s a look at a custom financial dashboard we built for a client, freeing them from messy spreadsheets and giving them a clear, automated view of their performance.
This dashboard gives the leadership team an at-a-glance summary of revenue, gross profit, and key ratios. No more digging through multiple reports; just faster, smarter decisions.
A Scalable Asset vs. a Recurring Cost
The off-the-shelf software market is definitely heating up. By 2025, AI-powered tools like Forecastio and Fuelfinance are becoming more accessible, with some plans starting around $119 per month. These platforms use advanced time-series models to crunch historical trends, and market reports show they can improve predictive accuracy by over 20% compared to spreadsheets. You can get a deeper dive into these trends in this article on sales forecasting software and its evolution.
But this convenience often comes with recurring fees and functional ceilings.
A custom Power BI model is a one-time investment in a flexible, scalable asset. As your business grows and changes, your forecast adapts right alongside it—without forcing you to upgrade to a pricier software tier or pay for a dozen features you'll never use.
You own the model. You own the data. And most importantly, you own the insights.
This is about building a long-term capability, not just renting a short-term fix. It’s a strategic shift from being a software user to becoming a truly data-empowered business operator.
Ready to build a forecast that’s as unique as your business? Connect with us to design your financial dashboard in Power BI and see what’s possible when you finally own your data.
Got Questions About Financial Forecasting Software? We've Got Answers.
Jumping into the world of financial forecasting tools can feel overwhelming. As consultants, we hear the same questions pop up from small business owners time and again. They're good questions, too—not just about tech, but about real business hurdles.
Let's tackle the most common ones. Getting these sorted is the key to picking a tool that actually fits how you work and where you want to go.
How Long Does Implementation Really Take?
This is the classic "it depends" question, but there's more to it than that. A simple cash flow tool? You could be up and running in a few hours. A more involved SaaS platform might take a few weeks to get all your data hooked up and your team comfortable.
But the real focus shouldn't be speed—it should be time-to-value. A custom Power BI solution, for example, is built around your specific data strategy from day one. While the build time can vary, it often delivers a tailored, high-impact result faster than you’d get trying to force a generic tool to fit your unique business model.
Is This Software Actually Worth the Cost?
Without a doubt. But you have to think of it as an investment in better decision-making, not just another line item on your expenses. The return on investment (ROI) shows up in a few key ways:
- Time Saved: Think of all the hours your team sinks into manual data entry and cobbling together reports. That time gets handed right back to you.
- Errors Avoided: One bad call based on a spreadsheet mistake can easily cost more than a year's subscription to a proper tool.
- Strategic Clarity: A reliable forecast gives you the confidence to optimize cash flow, chase better loan terms, or know the exact right moment to make your next hire.
When you look past the price tag, you see the real value is in efficiency and a clear view of the future. To dive deeper into strategies that create this kind of value, check out our guide on the secrets of successful small businesses.
SaaS Tool vs. Custom Power BI: What's the Difference?
This is a big one, and your choice here really affects your flexibility down the road.
Think of it this way: a SaaS tool is like buying a high-quality suit off the rack—it offers a standard, pre-built structure that works well for many businesses. A custom Power BI solution is like getting that suit tailor-made.
A custom Power BI model is built from the ground up to match your business logic. It can connect to any data source you use and creates dashboards that answer your specific questions, not just the generic ones. This approach gives you much deeper insights and creates a scalable asset that you own, giving you a competitive edge that lasts.
Ready to ditch the frustrating spreadsheets for automated, insightful forecasting? The team at Vizule specialises in building custom Power BI solutions that give you a clear, real-time view of your business performance. Book your free BI consultation and let's design a system that finally works for you.


