


Unreliable forecasts are more than just a minor headache—they’re a direct threat to your cash flow, inventory levels, and strategic planning. As a consultant working with founders and operators, I've seen it time and again. The only way to get a real grip on your forecast accuracy is to focus on three core areas: getting all your data into one place, picking the right forecasting model for your business, and building a consistent review process into your operations.
This isn't just a technical exercise; it's a strategic imperative for any business owner who wants to scale smart and stop fighting fires.
The Real Cost of Inaccurate Forecasts

As a founder or operator, you live and die by your numbers. So, what happens when those numbers are flat-out wrong? An inaccurate forecast isn't just an inconvenience; it's a silent killer of momentum and cash. It kicks off a ripple effect of poor decisions that can drain your resources and stop growth in its tracks.
Imagine a growing e-commerce business heading into its peak season. The leadership team, working from a messy patchwork of disconnected Excel files, confidently projects a 40% jump in sales. Based on that number, they go all-in: they ramp up inventory, hire temporary staff, and pour cash into marketing.
But their forecast was built on a foundation of sand. It failed to account for a new competitor’s aggressive pricing or a dip in performance on a key marketing channel. The reality? Sales only grew by 15%. Now, the warehouse is bursting with unsold products, cash is tight from paying underworked staff, and the marketing budget is gone with little to show for it.
The Domino Effect of Bad Data
This scenario is painfully familiar for many SMBs. That single mistake—the bad forecast—sets off a cascade of expensive problems. It's a classic case of "garbage in, garbage out," where any decision built on a shaky data foundation is doomed from the start.
The pain isn't just on the P&L. Inaccurate forecasting tanks morale and confidence. It creates friction between sales, finance, and operations, as each team defends their own version of the "truth" from siloed spreadsheets.
This constant cycle of missed targets and reactive firefighting is exhausting. It keeps you bogged down in crisis mode instead of steering the ship. The good news? You can break free from this chaos.
Shifting from Guesswork to Insight
Improving your forecast accuracy isn't about finding a crystal ball. It’s about building a robust system that turns your own historical data into a reliable guide for the future. This guide will walk you through the three pillars that form the foundation of that system.
Before we dive in, here's a quick overview of the core strategies we'll be covering.
Three Pillars for Improving Forecast Accuracy
| Pillar | Core Pain Point it Solves | Key Action for SMBs |
|---|---|---|
| Data Foundation | "Dueling spreadsheets" and inconsistent numbers across teams. | Unify data from sales, finance, and operations into a single source of truth. |
| Modeling & Analytics | Using overly simplistic or incorrect forecasting methods. | Select and apply the right analytical model for your specific business type. |
| Process & Review | "Set it and forget it" forecasting with no accountability. | Create a structured routine to measure forecasts against actuals and refine assumptions. |
By focusing on these three core areas, you can transform forecasting from a dreaded, error-filled chore into one of your most powerful strategic assets. It’s the difference between navigating with a hand-drawn map and having a real-time GPS.
Ready to stop guessing and start making confident, data-driven decisions? The first step is to build that solid data foundation. If your data is scattered everywhere and you're tired of manual reporting, book a free discovery call with our BI consultants. We can help you connect the dots.
Pillar 1: Build Your Forecast on a Foundation of Trusted Data

Every business leader has felt the pain of a forecast built on shaky ground. You present your numbers with confidence, only to discover the sales team was using one spreadsheet, finance another, and operations was tracking inventory on a completely different system. This "Excel chaos" is exactly why most forecasts fail.
Improving your forecast accuracy doesn't start with a complex statistical model. It starts with a foundational principle: build on data you can actually trust. This means creating a framework for lasting data integrity.
Diagnosing Your Data Disconnect
For most SMBs, critical data lives in a few key places. The challenge is that these systems rarely talk to each other, leaving you with a fragmented view of your own company.
Your most important data sources typically include:
- CRM System: Your sales pipeline—tracking leads, opportunities, deal sizes, and close dates.
- Accounting Software: The ground truth for revenue, expenses, and cash flow (think platforms like Xero or QuickBooks).
- Inventory or Ops Platform: Where you track stock levels, production schedules, and fulfilment data.
When these sources are siloed, they create massive blind spots. You might forecast strong sales based on CRM data, but without visibility into your inventory, you can’t see the stockout that’s about to derail your entire quarter.
The Silent Saboteurs of Your Forecast
The problems hiding in your data are often small, but their cumulative impact is huge. These silent saboteurs quietly undermine your numbers without you even realizing it.
We see the same culprits time and again:
- Duplicate Records: A single customer listed multiple times can artificially inflate your sales pipeline.
- Inconsistent Formatting: "United Kingdom," "UK," and "U.K." are seen as three different countries by a forecasting model, completely skewing regional analysis.
- Missing Values: Gaps in critical fields, like deal size or expected close dates, make accurate projections impossible.
The impact of this low-quality data is far from trivial. Recent findings show that companies with clean, high-quality pipeline data can improve their forecast accuracy by up to 25%. That's a massive leap, highlighting just how critical this foundational step is. You can learn more about the findings on sales forecasting from Forecastio.
From Silos to a Single Source of Truth: A Client Story
We recently worked with a direct-to-consumer brand that was constantly fighting this exact problem. Their sales forecasts, pulled straight from their CRM, looked fantastic. But they were consistently missing targets and frustrating customers with delayed orders.
The problem? Their sales and inventory data were completely disconnected.
By connecting their sales platform and inventory system into a central Power BI data model, we created a single source of truth. For the first time, they could see their sales pipeline alongside real-time stock levels. The result was transformative.
They immediately identified that 30% of their forecasted sales were for products that were out of stock. This single insight allowed them to adjust their marketing, manage customer expectations, and build a far more realistic operational plan. This is the power of a unified data foundation.
Achieving this doesn't require a massive IT department. It's about implementing simple data governance—clear rules for how data is entered, managed, and maintained. The goal is to make data hygiene an ongoing discipline, not a one-off project.
Ready to stop fighting with disconnected spreadsheets and build a data foundation you can finally trust? Book your free BI consultation, and we'll show you how to unify your data and unlock reliable, accurate forecasting.
Pillar 2: Choose the Right Model for Your Business
Once your data is clean and consolidated, you face the next big question: what do you actually do with it?
Choosing the right forecasting model can feel intimidating, but the "best" model is simply the one that answers your most important business questions clearly and reliably.
Many businesses we see are stuck in the past, using methods that are too simple or just plain wrong for their needs. The most common culprit? The simple moving average. You know the one—averaging the last three months of sales to guess the next. It’s easy to do in Excel, sure, but it's like driving a car by only looking in the rearview mirror. It completely ignores seasonality, market trends, and the deals your sales team actually has in the pipeline.
From Simple Averages to Smarter Predictions
Thankfully, modern business intelligence tools have put much more effective models within reach of business operators, not just data scientists. Tools like Power BI help you move away from fragile, error-prone spreadsheets by automating the heavy lifting.
Let's walk through a common scenario for a subscription business. You need to forecast two very different things: future revenue and customer churn. A moving average is useless here. You need distinct tools for each job:
- For Revenue: A regression analysis model is often a great fit. This technique finds the relationship between different variables. For instance, it can look at how your marketing spend, website traffic, and trial sign-ups all connect to your final monthly recurring revenue (MRR).
- For Churn: Here, a classification model would work better. This model is great at analysing customer behaviours—like a drop-off in product usage or a sudden silence in support tickets—to flag which accounts are at high risk of cancelling.
The beauty of a tool like Power BI is that it has these functions ready to go. You don't have to code the algorithm; you just need to feed it good data and know what questions to ask.
The chart below shows the accuracy gains businesses typically see when they switch from manual guesswork to more advanced statistical and machine learning models.
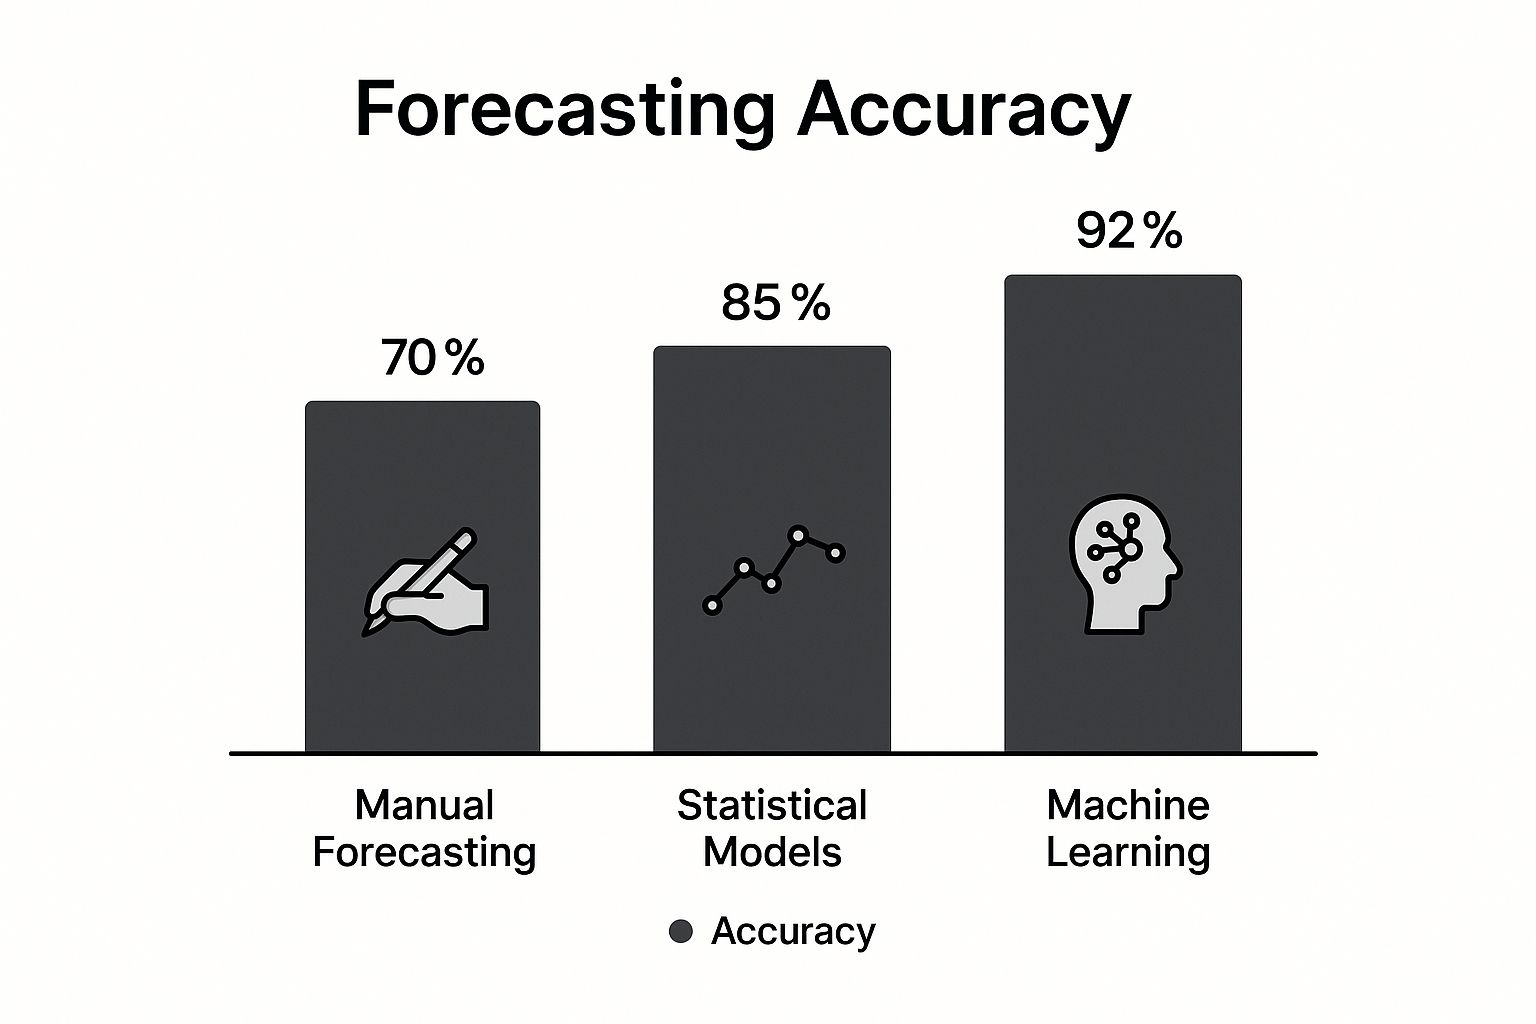
As you can see, embracing automated models isn't a small step—it's a significant leap in accuracy. It’s the difference between a vague estimate and a precise, data-driven prediction.
Matching the Model to Your Business Reality
When it comes to forecasting models, there's no magic bullet. The key is to find the right approach that fits your specific business context. We’ve seen too many teams get bogged down trying to implement something overly complex when a simpler, more direct model would have done the job better and faster.
Here’s a quick comparison of common models we recommend to SMBs, especially those working within the Power BI ecosystem.
Forecasting Model Comparison for SMBs
| Model Type | Best For | Data Requirement | Power BI Suitability |
|---|---|---|---|
| Moving Average | Quick, stable estimates with no seasonality. | Low (short-term historical data) | Good (simple DAX formula) |
| Exponential Smoothing | Short-term forecasts where recent data is more important. | Low to Medium (historical time-series) | Excellent (built-in forecasting) |
| Regression Analysis | Understanding how different variables (e.g., ad spend) impact outcomes. | Medium (historical data for multiple variables) | Excellent (built-in visuals & DAX) |
| ARIMA | Complex forecasts with seasonality and trends (e.g., retail sales). | High (long, consistent time-series data) | Good (via R or Python script integration) |
This table should give you a starting point. Don't feel pressured to jump straight to the most complex option. Often, simply moving from a simple average to exponential smoothing in Power BI can deliver a huge improvement.
In fact, firms that implement AI-powered forecasting tools often see a 20% improvement in accuracy compared to those stuck on traditional methods. This jump happens because automated systems can process huge amounts of data and spot patterns a human could never see.
Choosing the right approach is a cornerstone of building a reliable financial engine for your business. For a deeper look at how these pieces fit together, check out our guide to supercharge your finances with smarter modelling.
Pillar 3: Measure, Refine, and Create Accountability
You can't improve what you don't measure. After you’ve selected a model and cleaned your data, the real work begins with a powerful feedback loop: forecast, measure, analyze, and refine. Without this, you’re just flying blind, never knowing if your predictions are getting better or just lucky.
Many business owners we talk to shy away from this part. It feels complex, like something reserved for statisticians. But the core concepts are surprisingly straightforward, and they're the secret to building a reliable, self-improving forecasting engine.
Key Metrics to Understand Your Performance
You don't need a dozen different metrics to get started. Focusing on a couple will give you immediate clarity on where your forecasts are going wrong. The goal isn't just to get a grade on your performance, but to understand the nature of your errors.
Two of the most valuable metrics for any business are:
-
Mean Absolute Percentage Error (MAPE): This sounds complicated, but it's just a simple way of asking, "On average, how far off are my forecasts in percentage terms?" It gives you a single, easy-to-understand number that tells you the magnitude of your error.
-
Forecast Bias: This is all about direction. Are you consistently too optimistic (over-forecasting) or too pessimistic (under-forecasting)? Identifying bias is critical because it points to a systemic issue in your assumptions, not just random chance.
We once worked with a services company that consistently underestimated project timelines. Their MAPE wasn't terrible, but their forecast bias was significant. This constant under-forecasting created a culture of rushing, burnout, and last-minute scrambles—all because of an optimistic bias baked into their initial planning.
Making Measurement an Automated Habit
The old way of tracking accuracy involved tedious spreadsheet work. You'd manually export actuals, line them up against the forecast, and run calculations. This is exactly the kind of time-consuming manual report that founders abandon.
This is where a modern BI tool completely changes the game. By connecting your forecast model directly to your actual results in a tool like Power BI, the entire measurement process becomes automated.
Here’s what that looks like in practice—a Power BI dashboard visualizing this feedback loop automatically.

This dashboard instantly highlights which products or regions have the largest variance between their forecasted and actual sales. Instead of digging through spreadsheets, a leader can see in seconds that "Product B" is consistently underperforming its forecast, signaling a need for immediate investigation.
The real power here is turning measurement from a reactive, manual chore into a proactive, insightful, and continuous process. The dashboard doesn't just give you a score; it tells you exactly where to focus your attention to make your next forecast better.
This creates a powerful feedback loop. You see the variance, you ask why, and you feed that insight back into your assumptions. Maybe a competitor's promotion hit a certain product line harder than expected. You can now adjust the model for next month. This is the essence of building a robust forecasting capability, a key component of effective financial planning. To learn more, check out our guide on how to build financial models that adapt and improve over time.
Fostering a Culture of Accurate Forecasting
Sophisticated models and clean data are essential, but they only tell half the story. The biggest leap in forecast accuracy often comes from tackling the human element. You could have the most advanced forecasting system in the world, but it's doomed to fail if your teams don’t trust it, contribute to it, or feel accountable for the results.
At its core, forecasting is a team sport, not a back-office task for finance. To build a forecast that is both accurate and genuinely useful, you have to foster a culture of collaboration that breaks down the silos between sales, finance, and operations.
Uniting Qualitative and Quantitative Insights
A classic friction point is the gap between hard numbers from a financial model and the qualitative, on-the-ground intelligence from the sales team. The model might say one thing based on historical trends, but a salesperson knows the real story behind a major upcoming deal.
Imagine your historical data suggests that deals of a certain size have a 20% close rate. Your new forecasting model, built on this data, projects revenue accordingly. But your top salesperson is adamant that a specific large deal in the pipeline has a 75% chance of closing because of a strong executive sponsor and a competitor's recent blunder.
So, who's right? The answer is that both perspectives are valuable. A culture of accurate forecasting doesn't force a choice between them. Instead, it creates a process to merge them.
This means bringing both the data and the human insight into the forecast review meeting. The conversation needs to shift from "the model is wrong" to "what does the sales team know that the model doesn't?" This collaborative approach leads to a far more realistic and defensible forecast.
Running Effective Forecast Review Meetings
The forecast review meeting is the arena where this culture is built. To make these meetings effective, you need to transform them from backward-looking report-outs into forward-looking strategy sessions.
Here are a few practical tips:
- Make Data the Centrepiece: Everyone should be looking at the same dashboard. Use a shared Power BI report as the single source of truth. This ends debates over whose spreadsheet is correct and focuses the conversation on the numbers.
- Focus on the "Why": Don't just read out the numbers. Dig into the biggest variances between the forecast and actuals. Ask questions like, "What assumptions did we get wrong here?" or "What new risks or opportunities have emerged?"
- Promote Open Communication: Create a psychologically safe environment where people can flag risks without fearing blame. A salesperson must feel comfortable highlighting a deal that's going cold—that information is crucial for an accurate forecast.
This process fosters genuine accountability. When everyone helps build and refine the forecast, they develop a shared ownership over the final number. If you're looking to explore more strategies like this, you might find our small business secrets for growth helpful.
Learning from Other Disciplines
The journey to improve forecast accuracy isn't unique to business. Look at the remarkable improvements in weather forecasting over the past 30 years. Today’s four-day weather forecasts are as precise as one-day forecasts were in the early 1990s.
This leap forward was driven by higher-resolution data, massive increases in computing power, and better modeling—the exact same principles that apply to business forecasting. You can explore more on how data transformed weather prediction accuracy on Our World in Data.
By creating a culture where data is shared freely, different perspectives are valued, and continuous improvement is the goal, you can build forecasts that are not only more accurate but also deeply trusted across your entire organization.
Common Questions About Business Forecasting
As founders and operators get serious about forecasting, a new set of questions always emerges. Moving from guesswork to a data-driven operation is a big shift, but it doesn't have to be a nightmare.
Here are direct, practical answers to the questions we hear most often, designed to clear up confusion and help you build a more predictable business.
How often should I update my business forecast?
For most SMBs, a monthly forecasting cadence is the sweet spot. It's frequent enough to stay agile and responsive to market changes, but not so often that you're just chasing numbers instead of running the business.
Of course, the "right" frequency depends on your business model:
- A fast-paced e-commerce company might need to review sales and inventory weekly to manage stock levels and ad spend.
- A project-based services firm with long lead times could find a monthly or even quarterly review is sufficient to track its pipeline and plan resources.
The goal is to match your forecast updates to your key decision-making cycles. When you have an automated system like a Power BI dashboard, updating the forecast stops being about tedious data entry and becomes a quick, strategic review.
What is a good forecast accuracy percentage?
This is the million-dollar question, and the honest answer is: there's no single magic number. While you'll hear about high-performing companies hitting 85-95% accuracy, a realistic target for your business depends entirely on your industry, model, and how far out you're looking.
Forecasting next week's sales will always be more accurate than predicting numbers for the next fiscal year. Instead of fixating on a generic benchmark, your focus should be on one thing: continuous improvement.
The objective isn't to chase an arbitrary percentage. It's about making consistent, measurable progress. Start by establishing your current accuracy as a baseline. From there, set achievable goals, like trimming your Mean Absolute Percentage Error (MAPE) by 10% over the next six months. That steady progress delivers far more value than chasing impossible perfection.
Can I really do this without a dedicated data scientist?
Absolutely. This is a huge misconception that holds many SMBs back. While data scientists have incredible expertise, modern BI platforms have made advanced analytics accessible to business operators.
Tools like Power BI have user-friendly, built-in forecasting functions that let you build powerful models without writing a single line of code.
For most businesses, the main obstacle isn't complex statistical modeling; it's the foundational work of getting all your different data sources organized and connected reliably. The classic "garbage in, garbage out" problem is what really torpedoes forecasts, not the absence of a PhD on your team.
This is exactly where a BI consultancy like Vizule is a game-changer. We build that automated data pipeline—the solid foundation—so you can skip the spreadsheet chaos and focus on what the insights mean for your business.
My sales team’s forecasts are always too optimistic. How can I fix this?
You're not alone; this is one of the most common forecasting headaches. It often stems from sales incentives or a simple lack of data-backed accountability. The solution isn't to stop trusting your sales team—their on-the-ground knowledge is vital—but to balance their qualitative insights with quantitative data.
Here's how to create a more objective review process:
- Generate a Statistical Forecast: First, use historical data from your CRM inside Power BI to create an unbiased, data-driven forecast.
- Compare and Contrast: In your next forecast meeting, put the two forecasts side-by-side. This becomes the centerpiece of the conversation.
- Ask Better Questions: Instead of pointing fingers, use data to drive a productive discussion. Ask questions like, "Our historical close rate for this deal type is 15%, but your forecast assumes we'll close at 40%. What specific factors give you confidence in that higher number?"
This data-informed approach takes emotion and bias out of the room. Over time, it helps everyone become more realistic and objective, turning your sales forecast into a tool you can actually rely on for strategic planning.
Feeling stuck between overly optimistic sales projections and unreliable spreadsheet models? You're not alone. At Vizule, we help businesses like yours build a single source of truth, automating your reporting and embedding a culture of data-driven forecasting.
Stop guessing and start planning with confidence. Book your free BI consultation and see how we can help you connect the dots in your data.


