


If you're an SMB founder, you're probably wrestling with a dozen spreadsheets, trying to piece together a clear picture of your business performance. It’s a struggle we see all the time: sales data lives in one system, marketing spend in another, and there's no simple way to connect them for a true ROI. Your reports are time-consuming, prone to error, and outdated the moment you finish them.
This is exactly where strategic data modeling for your data warehouse becomes a game-changer. Think of it as the architectural blueprint for turning all that siloed information into automated, trustworthy reports you can actually use to drive growth. It’s the permanent fix to spreadsheet chaos.
Why Your Manual Reports Are Holding You Back
Let's be honest, you didn't get into business to become a data analyst. You’re focused on your product, your customers, and your growth—not on manually copying and pasting numbers between endless Excel tabs.
Yet, you're constantly asked to make critical decisions based on numbers you can't quite trust. This manual reporting cycle isn't just a time-sink; it’s a massive business risk. When reports are built by hand, they're riddled with human error, outdated the moment they're finished, and almost never give you the complete picture.
Data modeling offers a permanent fix to this chaos. The best way to think about it is like designing a clean, organized stockroom for your information. Instead of having inventory scattered across different rooms with no labeling system, you create a logical structure where everything has a specific, designated place.
This structure, or "model," ensures that when you need to pull something—like your true customer acquisition cost—you can find it instantly and trust that it's the right number.
Why a Data Blueprint Matters for SMBs
For any growing business, a well-designed data model isn't just a "nice-to-have." It's a foundational asset that directly impacts your bottom line. It gets to the heart of the most pressing data challenges founders and operators face every day:
- It demolishes data silos. Finally, you can connect disparate sources like your CRM, accounting software, and marketing platforms into a single, unified view.
- It creates a single source of truth. By standardizing definitions, it guarantees that "revenue" means the exact same thing in every report, for every department. No more debates over which number is correct.
- It automates your manual reporting. Once the model is built, tools like Power BI can pull data automatically. This frees up countless hours your team spends on mind-numbing report creation.
- It lets you make proactive decisions. With reliable data at your fingertips, you can shift from just reacting to past performance to proactively shaping future outcomes.
The whole point of data modeling is to transform raw, messy data into a reliable asset that answers your most important business questions. It’s the bridge between having data and actually using it to drive growth.
To help you get started, it's useful to understand the language data experts use. These aren't just technical buzzwords; they represent core concepts that directly impact how you'll get insights from your data.
Key Data Modeling Terms for Business Leaders
| Technical Term | What It Means for Your Business | A Real-World Example |
|---|---|---|
| Entity | A key business object you need to track. Think of it as a noun in your business. | Customer, Product, Order, Supplier. |
| Attribute | A specific piece of information about an entity. It's the "what" or "how much." | For a Customer entity, attributes would be Name, Email, and Join Date. |
| Relationship | How different entities connect to each other. It defines the business rules. | A Customer places an Order. An Order contains a Product. |
| Schema | The overall blueprint or map of your database. It's the complete picture of all your entities and relationships. | Your e-commerce schema would show how Customers, Orders, and Products are all linked together to track a sale from start to finish. |
| Primary Key | A unique identifier for each record in a table. It ensures there are no duplicates. | The OrderID for each unique transaction. No two orders can have the same ID. |
| Foreign Key | A key that links one table to another. It's the "glue" that connects your data. | The CustomerID in the Orders table. It links a specific order back to the customer who made it. |
Getting a handle on these terms will make conversations with your technical team or consultants much more productive. It ensures everyone is speaking the same language when it comes to building a data foundation that truly serves the business.
Ultimately, a solid data modeling strategy empowers you to finally trust your numbers and make confident, insight-led decisions that scale right alongside your ambition.
Ready to build a data foundation you can rely on? Book your free BI consultation with a Vizule expert to see how we can automate your reporting stack.
The Three Essential Layers of a Data Model
Building a solid data warehouse model is a lot like designing a new office. You wouldn't just start picking out furniture, right? You'd begin with a high-level blueprint to make sure the space actually works for your team. It's the same with data modeling. An effective data warehouse model follows a structured, three-layer process that takes you from a broad business vision all the way to a detailed technical plan.
This layered approach is absolutely critical. It helps you avoid costly redesigns by making sure the business needs are what drive the technical build—not the other way around. Each layer builds on the one before it, adding more detail and transforming your business requirements into a functional data warehouse ready for analysis in tools like Power BI.
Conceptual Model: The Whiteboard Sketch
The first layer is the Conceptual Model. Think of this as the initial whiteboard sketch where you and your team hash out the core concepts that run your business. It’s completely non-technical and is all about identifying the main "nouns" of your operations.
For a small e-commerce business, these would be entities like:
- Customers who buy your products.
- Products that you sell.
- Orders that connect customers and products.
- Suppliers who provide your inventory.
The goal here is simple: alignment. You’re defining what truly matters to the business and how these core concepts relate to each other (e.g., a customer places an order). This gets everyone, from the CEO to the marketing lead, on the same page about the fundamental scope before a single line of code is ever written.
Logical Model: The Detailed Floor Plan
Next up is the Logical Model. This is where you add a layer of real detail to your conceptual sketch, turning that whiteboard drawing into a more formal floor plan. You’re still not worried about the specific technology you’ll use, but you are defining the attributes and relationships much more formally.
Using our e-commerce example, you'd start listing out specific attributes for each entity:
- Customer: Name, Email, Join Date, Location.
- Product: SKU, Product Name, Price, Category.
- Order: Order ID, Order Date, Total Amount.
You also define how these entities connect using keys. For instance, the Orders table would include a CustomerID to link each order back to the person who made it. This step is crucial for ensuring data integrity and acts as the main blueprint for the technical build. When working through these layers, it's also smart to think about specific data modeling and security capabilities from the get-go to ensure your plan is secure from the start.
Physical Model: The Final Construction Blueprint
The final layer is the Physical Model. This is the nitty-gritty technical blueprint that translates the logical model into a specific data warehouse technology, like Microsoft Azure or Amazon Redshift. Here, you define the exact table names, column data types (e.g., text, number, date), and relationships just as they will exist in the database.
This is where business logic meets technical reality. The physical model is optimized for query performance and storage, ensuring your Power BI dashboards load quickly and your reports are always responsive.
This structured progression is becoming more and more vital as businesses gather mountains of information. The global data warehousing market, valued at around $13 billion in 2018, was projected to more than double to $30 billion by 2025. This explosion is driven by the exact need for structured, actionable insights from massive datasets. If you want to dig deeper into these concepts, check out our complete guide on the data model for a data warehouse.
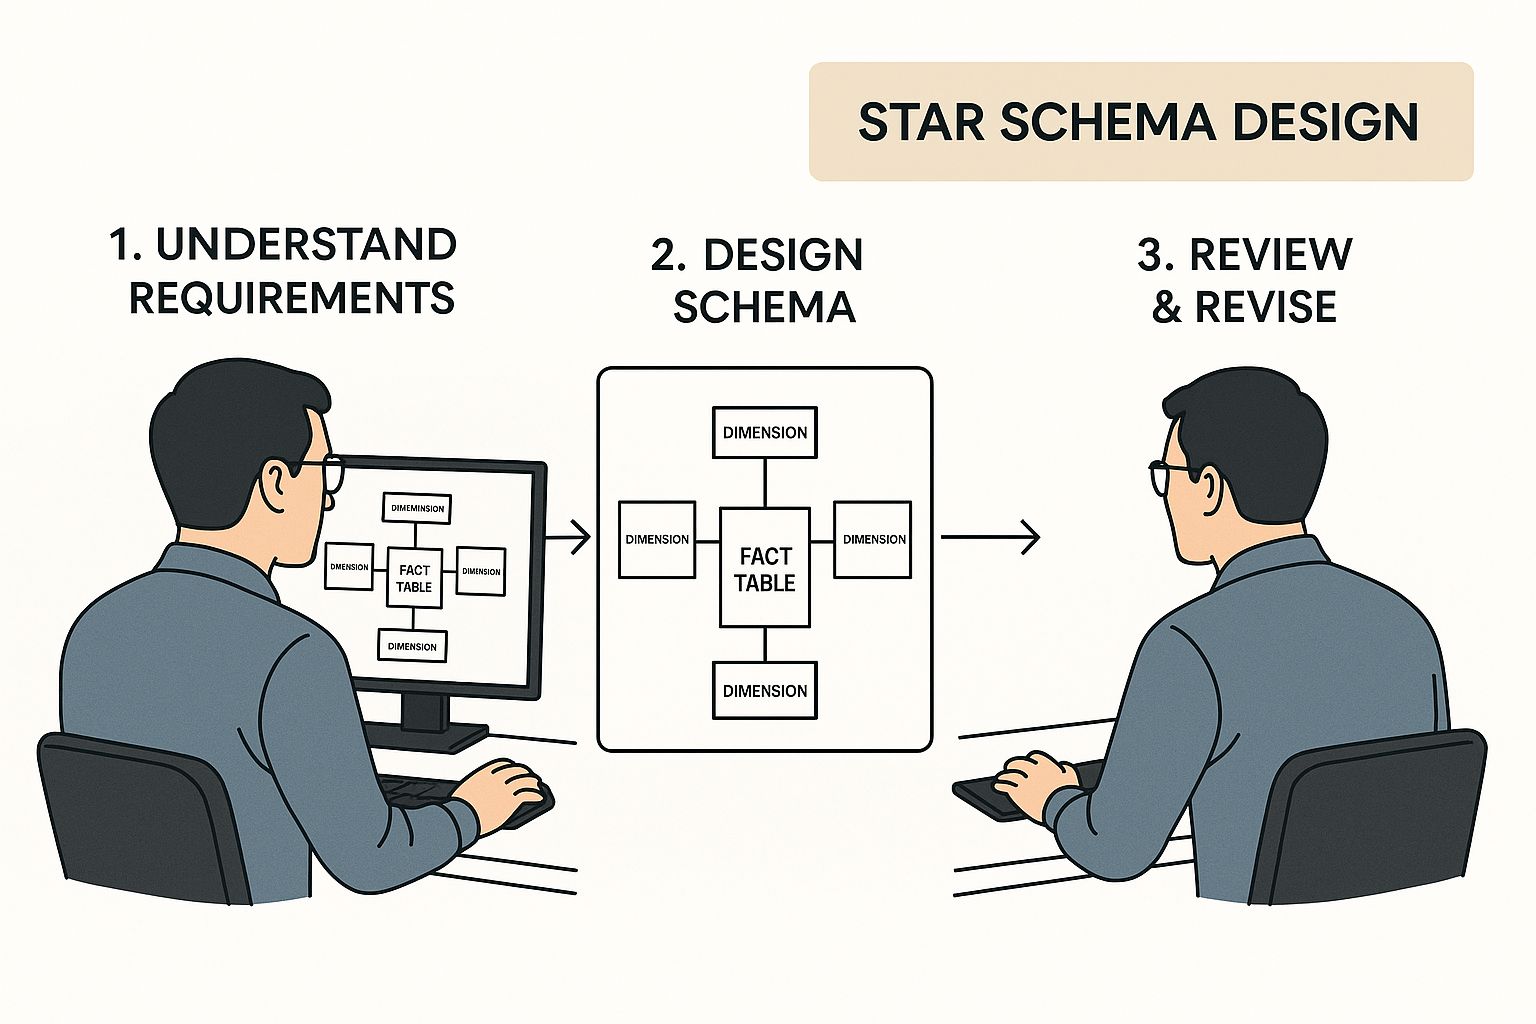
This diagram shows a Star Schema, a common physical model design that organizes data for fast and efficient reporting.
By following these three layers, you build a data warehouse that doesn’t just store your data but actually makes it truly useful for insight-led decision-making.
Choosing Your Model: Star vs. Snowflake Schemas
When you start structuring the data in your warehouse, the conversation will quickly turn to two dominant approaches: the Star Schema and the Snowflake Schema.
Don't let the names intimidate you. Think of them as two different ways to organize the shelves in your data stockroom—one is incredibly simple and direct, while the other is more detailed and broken down.
For most businesses we work with, understanding the trade-offs is the key to building a data warehouse that's both powerful and easy to use. The choice you make directly impacts how quickly you can get answers from your data and how easily your team can build reports in a tool like Power BI.

The Star Schema: Your Direct Route to Insights
The Star Schema is, by a long shot, the most popular and straightforward method for data modeling in warehouses today. It’s designed for one primary purpose: speed and simplicity in reporting.
Its structure is beautifully simple. You have a central fact table that holds your core business metrics—the numbers you actually track, like sales revenue, units sold, or marketing spend. This fact table is then directly connected to several dimension tables, which provide the context, or the "who, what, where, and when" for those numbers.
Let's take an e-commerce business. Your fact table might contain columns like:
OrderIDOrderDateSaleAmountQuantitySold
This central table is then surrounded by dimensions like Customers, Products, and Dates, all linking directly to it. This star-like shape is what gives the model its name.
The real magic here is performance. When you ask a question like, "What were the total sales for 'Product A' to customers in London last month?" Power BI only needs to make one simple "jump" from the fact table to each dimension table to get the answer. This makes queries incredibly fast.
The Snowflake Schema: A More Detailed Structure
The Snowflake Schema is essentially an extension of the star schema. Instead of keeping all the contextual information in a single dimension table, a snowflake schema breaks those dimensions down into even smaller, more specific tables. This process is called normalization.
For example, in a star schema, your Products dimension might include ProductName, Category, and SupplierName. In a snowflake schema, the Products table would link to a separate Categories table. That Categories table might then link out to a separate Suppliers table. This creates a more complex, branched structure that resembles a snowflake.
The main benefit here is storage efficiency. By breaking down dimensions, you reduce data redundancy, which can save a little bit of space. However, this comes at a significant cost to reporting simplicity and speed. To answer that same business question, Power BI now has to perform multiple complex "jumps" through several linked tables, which can seriously slow down your reports.
For the vast majority of small and medium-sized businesses, the Star Schema is the undisputed champion. Its simplicity, speed, and ease of use in BI tools like Power BI far outweigh the minor storage savings of a Snowflake Schema.
Starting with a star schema almost always provides the best foundation for turning your data into actionable business intelligence. It aligns perfectly with the goal of getting clear, fast answers to your most pressing questions.
Star Schema vs Snowflake Schema: Which is Right for You?
Deciding between a Star and Snowflake schema really comes down to what you prioritize: query speed and simplicity, or storage efficiency and data integrity. For most reporting and analytics use cases, the Star schema's performance advantages make it the go-to choice.
Here's a quick side-by-side comparison to help you choose the best data modeling technique for your reporting and analytics needs.
| Consideration | Star Schema | Snowflake Schema |
|---|---|---|
| Query Performance | Excellent. Fewer joins mean faster queries. Ideal for BI tools. | Slower. Requires multiple joins, which can slow down reporting. |
| Ease of Use | Simple. The model is intuitive and easy for analysts to understand. | Complex. The web of tables can be difficult to navigate and query. |
| Data Redundancy | Higher. Denormalized tables repeat some data, using more space. | Lower. Normalized tables reduce data duplication, saving storage. |
| Maintenance | Easier. Simpler structure makes it easier to manage and update. | More Difficult. Multiple tables mean more complex ETL processes. |
| Best For… | Most data warehouse and analytics applications, especially in Power BI. | Systems where storage is extremely limited or data integrity is the absolute top priority. |
Ultimately, while the Snowflake schema has its niche uses, the Star schema provides a more practical and performant foundation for the vast majority of business intelligence projects.
Struggling to decide on the right data structure for your business? See how Vizule can help design your Power BI data model for clarity and performance.
Future-Proofing Your Data Foundation
Your data model isn't just a blueprint for today; it’s the foundation for where your business is headed tomorrow. As an SMB owner, you're not just looking at this quarter's numbers. You're mapping out new products, bigger teams, and untapped markets. Your data infrastructure has to be ready to keep up.
This means you need a design that can welcome new data sources—like a new CRM or marketing automation tool—without forcing you to tear everything down and start over. Getting a few core principles right from the beginning will save you the massive headache of a total rebuild down the road.
Design for Scalability and Flexibility
First up is scalability. You have to build your data model with the full expectation of growth. That means thinking beyond the data sources you have right now. For instance, if you're planning to roll out a customer loyalty program next year, your model needs a structure that can easily absorb that new stream of data.
Next, you need flexibility. A rigid model can only answer the questions you already have. A truly flexible one can adapt to the new business questions that will inevitably pop up—ones you haven't even thought of yet. This is what keeps you agile in a market that's always changing.
Finally, consistency is absolutely non-negotiable. This comes down to establishing standardized naming conventions and data definitions. 'Revenue' needs to mean the exact same thing in every single report, no exceptions. This practice is crucial for building trust in your data and is a cornerstone of effective business intelligence for finance.
A truly scalable data warehouse anticipates change. It's designed not just for the business you have, but for the business you're building. This forward-thinking approach is what separates a short-term fix from a long-term strategic asset.
Practical Steps to Future-Proof Your Model
As your business expands, the sheer volume and variety of your data will explode. It's no surprise the global data warehousing market is expected to hit about $60.21 billion by 2032, driven by this exact challenge. This surge underscores just how vital solid data modeling has become for integrating all kinds of data and feeding reliable insights into BI processes.
To stay ahead of this, here are a few practical steps to take:
- Document Everything: It doesn't have to be complicated. A simple data dictionary that defines your key metrics and terms is a great start.
- Use a Modular Design: Structure your model around logical business areas—think sales, marketing, and operations. This allows you to build out each module independently without breaking everything else.
- Plan for the Right Team: As you map out your data warehouse, you have to think about the people who will build and maintain it. This includes specialized roles like Data Warehouse Developer who have the right skillset for the job.
By embedding these principles into your approach, you're ensuring your data warehouse won't just be a tool for today, but a powerful asset that provides clarity and confidence as your business evolves.
Common Data Modeling Mistakes to Avoid
Jumping into your first data warehouse project can feel like walking through a minefield. A solid data model is your map, but one wrong step can lead to costly rework and reports nobody trusts. Learning from the common pitfalls upfront will save you a world of time, money, and headaches on your way to data clarity.

One of the biggest traps we see founders fall into is designing a model based only on the data they have today. Your business isn’t static, and a model that only answers yesterday's questions will be obsolete before you know it. The real goal is to think ahead. What questions will you need to answer in six months? A year? This foresight ensures your data warehouse provides lasting value, not just a short-term snapshot.
Focusing on Tech Over Business Needs
Another classic mistake is the disconnect between the business leaders and the technical team. This communication gap often produces a model that's an engineering marvel but a commercial flop. It’s perfect on paper but can't answer fundamental questions about profitability or customer lifetime value.
The most successful data modeling for data warehouse projects are always driven by business requirements, not just what's technically possible. Start with the end in mind. What decisions are you trying to make? What are the key performance indicators (KPIs) that actually move the needle for your business?
A data model is only as good as the business questions it can answer. If your model doesn't connect directly to your commercial goals, it's just an expensive, well-organized spreadsheet.
The Danger of Over-Complication
Finally, it's incredibly easy to fall into the "boil the ocean" trap. This is where you try to model every single piece of data from every system right out of the gate. This approach almost always leads to paralysis by analysis, blowing through budgets and timelines long before delivering any real value.
For most businesses, an iterative approach is far more effective. Start small and focused. A great first project could be combining your sales and marketing data to get a crystal-clear view of your customer acquisition cost. Nail that, show the value, and then expand from there. This builds momentum and ensures your investment delivers tangible results quickly.
For a deeper look into structuring these kinds of analyses, our guide on how to build financial models offers practical steps that are a great complement to your data warehouse efforts.
By sidestepping these common mistakes, you can keep your project on track and deliver the insights needed to scale your business with confidence.
Want to automate your reporting and finally trust your data? Book a free call with our BI consultants today and let's build a data foundation that works for you.
Answering Your Data Modeling Questions
Even with a clear roadmap, it's natural for questions to pop up when you're getting started with data modeling. We work with SMB operators and founders every single day, so we've pretty much heard them all.
Let's tackle some of the most common questions we get, with straightforward answers to help you get moving.
How Long Does It Take to Build a Data Model for an SMB?
This is usually the first thing founders ask, and the answer is probably faster than you think. For most small to medium-sized businesses, we can typically design and implement a foundational data model for a data warehouse in about 4-8 weeks.
Of course, the exact timeline hinges on how complex your data sources are and how clear your business goals are from the get-go. The secret to getting early, high-impact wins is to start with a focused scope. A great starting point is connecting sales and marketing data to finally calculate your true ROI.
Do I Need a Dedicated Data Engineer to Do This?
Not necessarily. While a data engineer is a huge asset for really complex projects, it's not always a must-have to get started.
Modern cloud data warehouse platforms and BI tools like Power BI have made data modeling more accessible than ever. A tech-savvy person on your team who understands the strategy, or an external consultant, can often build a very effective initial model.
The most critical piece of the puzzle isn't a specific job title; it's having a clear, business-driven strategy. This is exactly where a consultancy like Vizule can bridge the gap, providing both the strategic guidance and the technical know-how to get it right the first time.
This move toward more accessible solutions is why the cloud data warehouse market is exploding. In 2024, the global data warehouse as a service (DWaaS) market was valued at around $6.85 billion. Projections show it soaring to an estimated $37.84 billion by 2034, all driven by the need for businesses to manage data without getting bogged down by complexity. You can learn more about these market projections and see the full analysis on this growing demand.
What's the Difference Between a Data Warehouse and a Data Mart?
This is a great question, and it's a common point of confusion. The easiest way to think about it is like a library.
- A data warehouse is the entire central library. It holds all of your company's information—sales, finance, operations, marketing, you name it. It's the single source of truth for everything.
- A data mart is like a specialized, curated section within that library. It's focused on a single business area, like "Marketing Analytics" or "Financial Reporting."
Many SMBs actually start by building a single, focused data mart to solve an immediate pain point. As their data needs grow and they become more data-mature, they can expand this foundation into a comprehensive data warehouse that serves the entire organization.
Feeling more confident about data modeling but could use a partner to help you execute? The team at Vizule specializes in turning spreadsheet chaos into strategic clarity for businesses just like yours. We build the data foundation so you can focus on growth.
Book your free BI consultation and let's map out a plan to automate your reporting and unlock the insights hiding in your data.
