


For most small business owners, "data analytics" sounds complex and expensive. But it's simpler than you think. It’s the process of taking scattered information from tools you already use—like QuickBooks and Shopify—and turning it into a clear, reliable system that helps you make better decisions.
It’s the difference between wrestling with manual spreadsheets and having automated, real-time insights at your fingertips. This shift can turn data from a recurring headache into your most powerful tool for growth, helping you finally connect the dots between your financial and operational performance.
Why Spreadsheets Are Holding Your Business Back
If you’re a founder or operator, you know the late-night spreadsheet struggle. You spend hours pulling data from different systems and building reports, only for them to be outdated the moment you hit "save." This cycle is more than just a frustration; it’s a genuine barrier to scaling your business with confidence.

The problem is, spreadsheets were never designed to be the central nervous system of a business. They demand constant manual updates, are incredibly prone to human error, and simply can't keep up with connecting data from all your different platforms—your CRM, e-commerce site, and accounting software. This creates siloed data and a fragmented view of performance.
From Manual Effort To Automated Insight
This manual grind means your most important numbers—like cash flow forecasts, customer acquisition costs, or product profitability—are always lagging. Making decisions based on old information is like driving forward by only looking in the rearview mirror. You're constantly reacting to what already happened instead of steering toward the future.
This is where a modern approach to data analytics for small businesses changes the game. It’s not about buying some massive, complicated enterprise system. It's about using smart, accessible tools like Power BI to finally connect those data silos.
The goal is to build a single source of truth, automated and always up-to-date. This shift reframes data analytics from a time-consuming chore into your most valuable asset for making smart, insight-led decisions.
The transition from clunky manual reporting to automated analytics is more achievable now than ever before. Let’s look at what this change actually means in practice.
The Shift from Manual Reporting to Automated Analytics
The table below breaks down the practical differences between sticking with old-school spreadsheets and adopting a modern business intelligence tool. It highlights how automation doesn't just save time—it fundamentally improves the quality and reliability of your business insights.
| Aspect | Manual Reporting (Excel) | Automated Analytics (Power BI) |
|---|---|---|
| Data Updates | Requires manual data entry and refresh. Prone to being outdated. | Connects directly to data sources for live, automatic updates. |
| Accuracy | High risk of human error (copy-paste mistakes, formula errors). | Minimizes human error through automated data pipelines. |
| Time Investment | Hours or days spent on report creation and maintenance. | Set up once, then reports run automatically. Frees up time for analysis. |
| Data Integration | Difficult to combine data from multiple sources (e.g., Shopify + QuickBooks). | Seamlessly integrates and visualizes data from dozens of sources. |
| Decision-Making | Based on historical, static snapshots of the business. | Based on real-time, dynamic data, enabling proactive decisions. |
Ultimately, moving to an automated system isn't just a technical upgrade; it's a strategic one. It allows you to spend less time managing data and more time using it to drive your business forward.
Tools are now available that were once only accessible to giant corporations. To truly move beyond the limits of spreadsheets, small businesses should look at adopting the best accounting software for small business that can integrate with these systems. By 2025, the wider availability of AI-driven analytics is expected to significantly boost operational efficiency and planning for small and medium-sized businesses worldwide.
Reclaiming Your Time and Trusting Your Data
Automating your reporting does more than just save you from tedious tasks like figuring out how to refresh data in a Pivot Table. It builds a foundation of trustworthy, up-to-the-minute data that gets your entire team on the same page.
When everyone from finance to operations is working from the same numbers, confusion disappears. It fosters a culture of accountability and empowers your team to make smarter choices.
Understanding Your Business Intelligence Engine
Diving into data analytics can feel a bit overwhelming, almost like you’re trying to learn a new language. But you don't need a technical degree to get the hang of it. Let's break down the key pieces that make your business intelligence work, using simple analogies.
Think about all the data your business generates—sales numbers, customer details, shipping costs, marketing results. Right now, it’s probably scattered across different places like your CRM, QuickBooks, or Shopify account. It’s like having a bunch of sticky notes and receipts all over your desk. To actually use that information, you first need to get it organized.
Your Central Data Library
This is where a data warehouse comes into play. Picture it as a massive, perfectly organized library built just for your business information. Instead of data being stuck in different software silos, a data warehouse creates one clean, central place for everything. Every bit of information has a specific, logical home, making it the single source of truth for all your reports.
So, how do all those messy notes and receipts get cleaned up and placed on the right shelves in your new library? That’s the job of a process called ETL, which stands for Extract, Transform, and Load.
The ETL process is your hyper-organized librarian. It Extracts your scattered data, Transforms it by cleaning it up into a standard format, and then Loads it neatly into your data warehouse. This is the behind-the-scenes magic that ensures the information you’re looking at is always accurate and consistent.
Once your data is neatly shelved, you're ready to start asking it interesting questions.
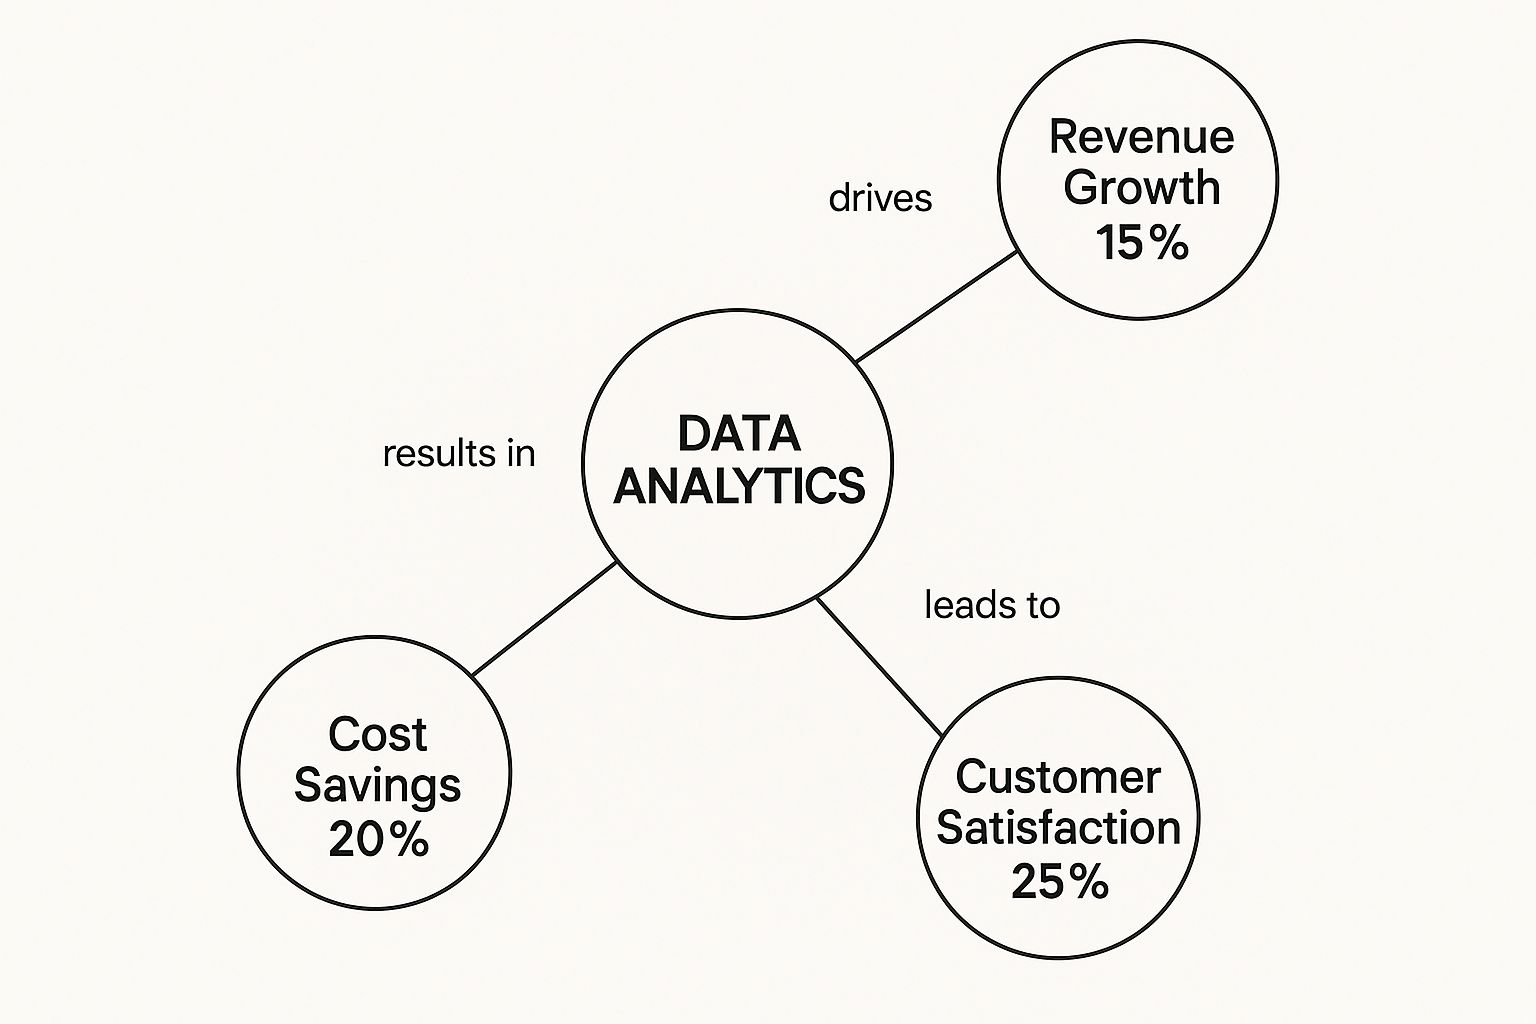
As you can see, applying analytics doesn't have to be a monumental effort to get results. Small, focused improvements can lead to real gains in revenue, cost savings, and happier customers.
Visualizing Your Performance
Finally, you need a simple way to see what's going on without getting lost in the weeds. That's the role of a business intelligence dashboard, often built using a tool like Power BI. Think of it just like the dashboard in your car—it gives you a live, visual snapshot of all your business's vital signs in one place.
- A Sales Dashboard could show your revenue (your speed), profit margins (your fuel efficiency), and customer acquisition cost (your engine temperature).
- An Operations Dashboard might track inventory levels, how quickly orders are fulfilled, and overall team productivity.
Instead of hunting through endless spreadsheets, you get an immediate, easy-to-understand picture of your business's health. For a closer look at the strategy behind these tools, check out our guide on what business intelligence and analytics involves.
These three pieces—the data warehouse, the ETL process, and the dashboard—are the core of your business intelligence engine. They work together to turn messy, raw data into a clear roadmap, giving you the confidence to talk about your numbers and make smart decisions that truly drive growth.
How Analytics Translates Into Smarter Decisions
It's one thing to talk about data analytics in theory, but it's another thing entirely to see how it actually makes a difference in the real world. This is where the rubber meets the road. When you start connecting the dots within your data, you can finally move away from gut-feel decisions and start making confident, evidence-backed moves that grow your business.
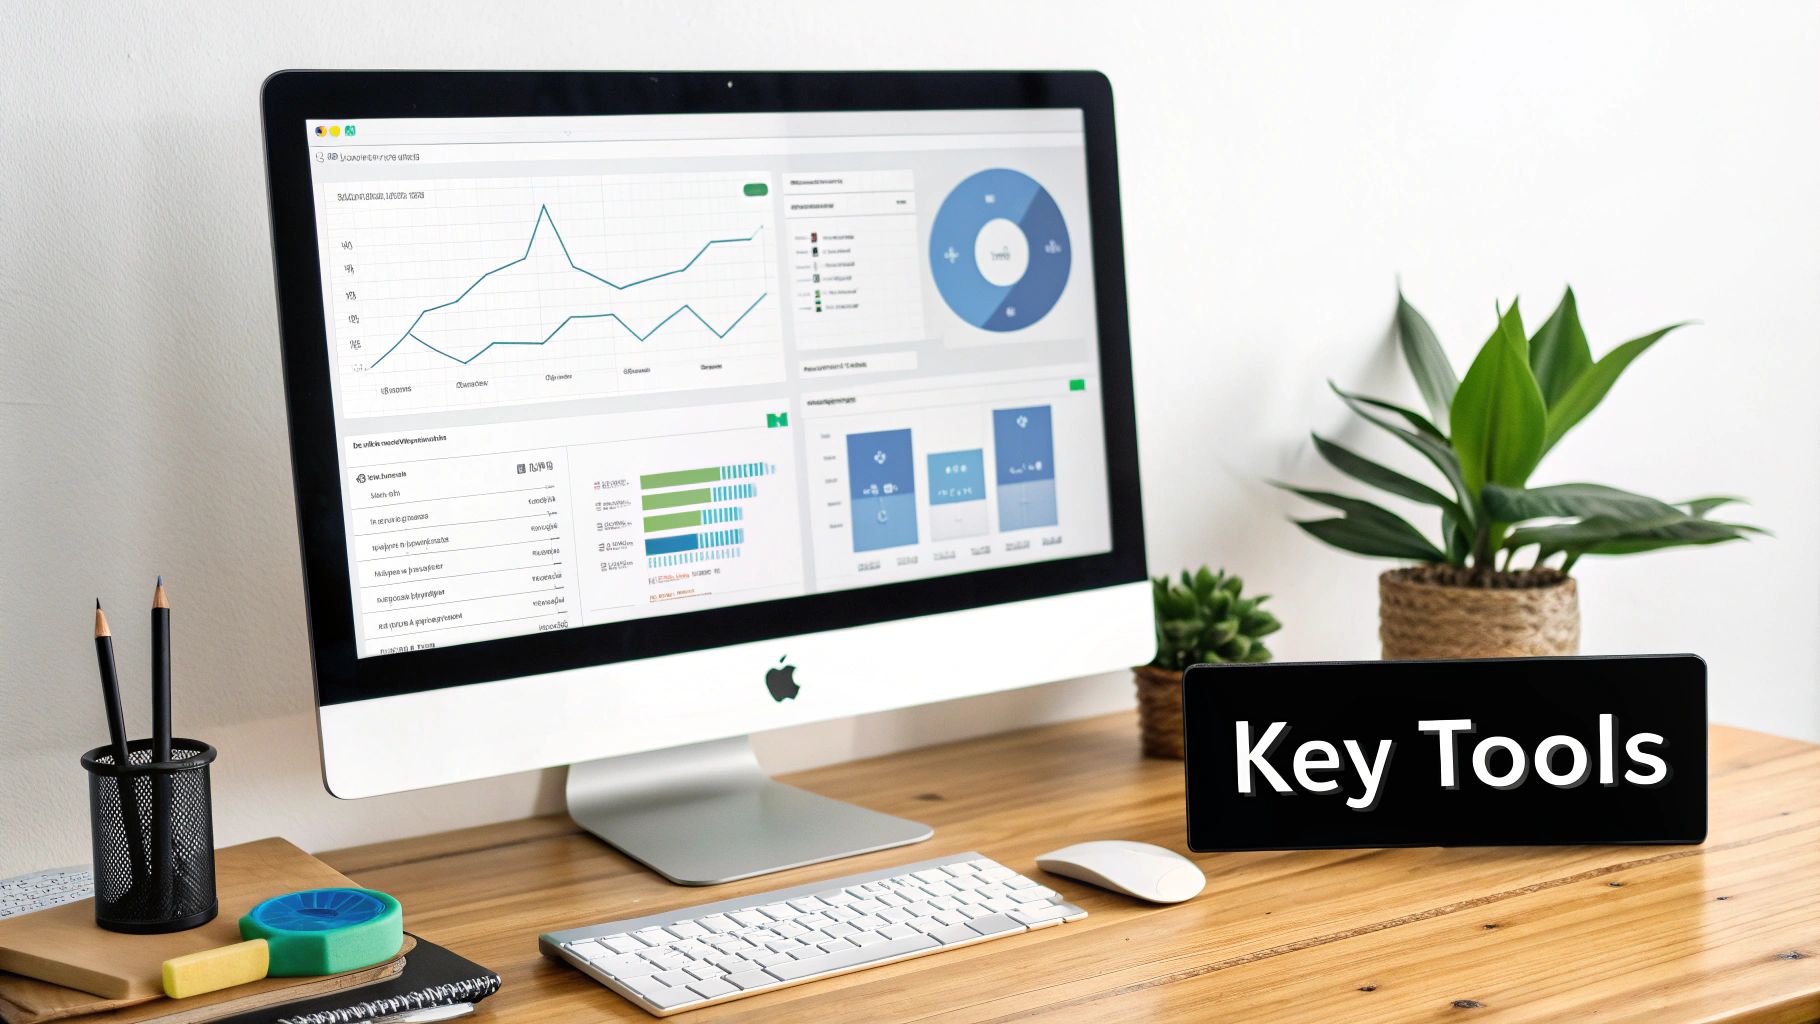
Take a look at that screenshot. It’s a dashboard from a tool called Power BI, and it perfectly illustrates this idea. Instead of juggling a dozen different spreadsheets, you get a single, interactive view that pulls together revenue, units sold, profit margins, and more. Suddenly, you're not just looking at numbers; you're seeing the complete story of your business performance, making it a whole lot easier to spot what's working and what isn't.
Let’s dig into three key areas where good data analysis can deliver serious, tangible results.
Gain True Financial Visibility
Most business owners keep a close eye on their Profit and Loss (P&L) statements and cash flow. That's business 101. The problem is, those reports often exist in their own little world, completely disconnected from your sales or operational data. This leaves a huge, and frankly, dangerous blind spot. Can you confidently say which of your products or clients are truly the most profitable?
This is where analytics changes the game. By linking your accounting software (like QuickBooks) with your sales platform (like Shopify), you can automatically connect revenue and costs to specific activities.
This unified view doesn't just show you what you sold; it reveals the true net profit of each product line, service, or even customer. After factoring in every associated cost, you might discover that your highest-revenue clients are actually your least profitable, while smaller accounts are quietly driving your bottom line.
Boost Your Operational Efficiency
Guesswork in your operations is a costly habit. If you run an e-commerce store, running out of a hot-selling item means lost sales and frustrated customers. On the flip side, overstocking a product that isn't moving just ties up cash you could be using to grow. It’s a classic Catch-22.
Data analytics breaks this cycle by turning your sales history into a reliable forecasting tool. It gives you the power to:
- Optimize Inventory: Analyze past sales trends to predict future demand, so you can stock the right amount of the right products at the right time.
- Prevent Stockouts: Set up simple alerts that tell you when your best-sellers are running low, long before you run out.
- Improve Cash Flow: Stop wasting money on inventory that just sits on the shelf, freeing up that capital for marketing or new product development.
This isn't about complicated algorithms; it's about using your own history to stop making expensive mistakes and run a leaner, more profitable operation.
Uncover Deeper Customer Insights
Your business is sitting on a goldmine of customer information—sales records, website behavior, support tickets, and feedback forms. Without analysis, they're just random pieces of information. With analysis, they become a detailed roadmap to keeping your customers happy and coming back for more.
Think about a service business. By analyzing support tickets, you might find that 80% of all customer issues stem from the same recurring problem. Fixing that one root cause doesn't just slash your support costs; it leads to happier, more loyal clients who feel heard. You shift from constantly putting out fires to proactively making your service better, which builds real, long-term value.
Want to automate your reporting and finally trust your data? Book your free BI consultation with our BI consultants today.
Using Power BI to Create a Single Source of Truth
For a growing small business, thinking of Power BI as just a fancier version of Excel is a huge missed opportunity. It’s actually a powerful engine built to pull together all your disconnected data—from your CRM and marketing platforms to QuickBooks—and merge them into one clear, reliable view. This is what we call a single source of truth.
Think about it. Right now, your sales team is likely looking at one set of numbers in their CRM, while the finance team is working from a totally different spreadsheet. This almost always leads to arguments over whose data is correct and wastes hours in meetings trying to reconcile the differences. Power BI puts an end to that chaos by creating one central, trusted dashboard where everyone is on the same page, looking at the same information, updated in real-time.
It's More Than Just Pretty Charts
The real magic of Power BI happens behind the scenes with its data modeling capabilities. This is something basic spreadsheets just weren't built to do. A data model is the blueprint for your dashboards; it organizes and connects all your raw information in a way that lets you ask complex questions and get immediate answers.
This is where getting an expert to set things up is so important. A well-built financial model lets you do sophisticated forecasting. You can see how a decision over here—like increasing your marketing budget—will actually impact your cash flow and bottom line weeks or even months from now. Your data stops being a rearview mirror and becomes a powerful tool for planning the road ahead.
With a solid data model in place, you can run "what-if" scenarios on the fly. You can stress-test business ideas without having to build a new, complex spreadsheet every single time. This is fundamental to scaling intelligently and making proactive decisions.
Putting Data in the Hands of Founders
Perhaps the biggest win for small businesses is how easy Power BI is to use once it's set up correctly. It’s designed to be interactive, which means non-technical founders and managers can finally explore the data themselves. You don't have to put in a request with an analyst and wait three days for a report anymore.
Instead, you can just click, filter, and dig into the numbers to find what you're looking for.
- Filter sales by region: Instantly see which areas are bringing in the most revenue.
- Drill down into product lines: Find out which products have the best profit margins, not just the highest sales volume.
- Track trends over time: Compare this quarter to the same time last year with a single click.
This kind of self-service access changes your whole relationship with data. It goes from being a source of frustration to a source of empowerment. To really grasp this concept, you should learn more about why establishing a single source of truth is crucial for your business data. It's the first step in getting your entire team aligned and building a company that truly runs on data.
Your Practical Roadmap to Data-Driven Operations
Feeling overwhelmed by the idea of setting up a data analytics system? You're not alone. But getting started is far more straightforward than you might think. Let's walk through a clear, actionable plan to get you from data chaos to confident decision-making.
This isn't about some massive, complex overhaul. It’s about taking logical, manageable steps.

Think of this roadmap as a filter. It helps you focus on what truly matters instead of getting lost in a sea of metrics, ensuring your efforts are tied directly to real business outcomes from day one.
Start With Your Core Business Questions
Before you even glance at a tool or a dashboard, start with the problems that keep you up at night. Great data analytics isn't about tracking every metric under the sun; it's about answering your most pressing business questions.
- What are the true drivers of our cash flow?
- Which of our products or services have the best profit margins?
- Where are our most valuable customers really coming from?
Focusing on these questions first makes sure your analytics project is grounded in real-world business needs, not just tech for tech's sake.
Map Your Key Data Sources
Next, figure out where the answers to your questions actually live. Your most valuable financial and operational data is probably scattered across a few key systems. Your job is to pinpoint these sources.
Typically, they include:
- Financial Data: QuickBooks, Xero, or whatever accounting software you use.
- Sales Data: Your CRM, e-commerce platform (like Shopify), or payment processor.
- Operational Data: Inventory management systems or project management tools.
Just knowing where your data is located is the critical first step toward bringing it all together.
Choose Your Technology Stack
With your questions defined and data sources mapped, it’s finally time to pick your tools. For most small and medium-sized businesses, the goal is to find a solution that is both powerful and user-friendly.
This is exactly where a platform like Power BI shines.
It provides a scalable foundation that can automatically connect to all your different data sources. Best of all, it grows with you, so you won’t have to switch systems just as you’re starting to see results.
Find the Right Partner
Finally, and this is important, you don’t have to build this engine alone. Partnering with a data consultancy can fast-track your journey, helping you avoid common pitfalls and ensuring your solution is built to solve your specific challenges.
This is especially true as more businesses adopt advanced tools. A recent global survey shows 75% of SMBs are investing in AI technologies, with over a third having already integrated them into daily operations for better efficiency. For a specialized look at this in action, a complete guide to automated chargeback and dispute management using AI offers a clear roadmap for operational improvements.
At the end of the day, an expert partner simply gets you from data to decisions, faster.
From Data Chaos to Data Clarity
Let's be honest, getting buried in spreadsheets is no way to run a business. The real goal is to move from that state of chaos to a place of genuine clarity, and that journey is absolutely essential if you want to grow. This isn't just a cleanup project; it’s about forging a new operational backbone that can actually support your ambitions.
Think about what you gain when you finally put the right data analytics in place. You get back countless hours thanks to automated reporting. You build unshakable confidence in your decisions because they’re based on insights you can actually trust. Most importantly, you empower your entire team to think and act based on what the data is telling them.
This is the shift that lets you finally work on your business instead of just in it. It’s how you get your finance and operations teams on the same page, stop reacting to last month’s numbers, and start steering your company where you want it to go.
Stop guessing and start knowing. Data clarity provides the foundation to scale smarter, align your team, and focus on strategic growth, leaving manual report-building behind for good.
Making this change is how you build a more resilient, predictable, and ultimately more profitable business. It’s how you turn ambition into real, measurable achievement.
Ready to build a business that scales on insight, not intuition? Book your free discovery call with a Vizule BI consultant today.
Frequently Asked Questions About Small Business Data Analytics
Jumping into data analytics brings up a lot of questions for business owners, and that's completely normal. Most of the time, the concerns boil down to cost, complexity, and whether it's the right time. Let's tackle some of the most common questions we hear from founders who are ready to get smarter with their data.
Is My Business Too Small for Data Analytics?
Not at all. In fact, establishing good data practices early is one of the smartest moves you can make. Starting with data analytics for small businesses from day one helps you build good habits and avoid the "Excel chaos" that trips up so many growing companies.
Modern tools like Power BI are surprisingly affordable and designed to grow right alongside you. The key is to begin with your most pressing business questions. Focus on solving those first, and you'll get immediate value out of your setup.
How Much Does a Power BI Solution Cost?
The cost depends on the complexity of your data and your specific reporting needs. However, it’s almost always significantly less than the cost of hiring a full-time data analyst.
At Vizule, we approach it in phases, focusing on delivering a high return on investment by tackling your biggest pain points first. It’s better to think of it not as an expense, but as an investment in making your business more efficient and your decisions more accurate. The solution often pays for itself quickly through time saved and smarter growth.
Can We Use Analytics Without a Technical Team?
Absolutely. That's exactly why specialist consultancies like Vizule exist. Our mission is to empower non-technical founders and their teams to make data-driven decisions without needing a computer science degree.
We handle all the technical heavy lifting—connecting your data sources, building a robust data model, and designing dashboards that are easy to understand and use. We build the engine so you can focus on driving the business forward with clear insights, not gut feelings.
You get all the upside of powerful analytics without having to write a single line of code.
Ready to stop wrestling with spreadsheets and start making decisions with confidence? Vizule can help you connect the dots in your data and build a reporting system that fuels your growth.


