


If your business forecasts feel more like guesswork than strategy, you’re not alone. For many SMB founders and operators, financial projections often miss the mark, creating real-world problems that ripple far beyond a dodgy spreadsheet. Why are my forecasts always wrong? It's a question we hear constantly. The answer is that a flawed forecast isn’t just a numbers problem; it’s an operations, finance, and strategy problem all rolled into one. When your predictions are unreliable, the entire business is operating on shaky ground.
The Hidden Costs of Flawed Business Forecasts
Seemingly small inaccuracies can trigger a costly domino effect. A forecast that’s off by even a small margin can lead to serious operational friction, undermining growth and stability at every turn. We see the same pain points crop up time and again with our clients, and they’re almost always tied directly to these flawed predictions.
The Domino Effect of a Bad Call
Think about a growing e-commerce brand gearing up for its peak holiday season. They're feeling optimistic—maybe a little too optimistic—and their sales forecast reflects that. They go all-in and invest heavily in inventory.
But the sales don't materialize as predicted. That one miscalculation sets off a chain reaction:
- Cash Flow Gets Strangled: All that capital is now sitting on warehouse shelves as unsold stock. This creates a cash crunch, making it tough to pay suppliers or fund the next marketing campaign.
- Resources Go Down the Drain: They've overspent on warehouse space and extra staff to manage inventory that isn't moving. Operational costs balloon, and profit margins shrink.
- Forced Into Deep Discounts: To clear out the excess stock after the season, they have no choice but to run massive sales. This not only eats into revenue but can also cheapen the brand in the eyes of their customers.
And it’s just as damaging the other way around.
Imagine the same brand gets too conservative and underestimates demand. They don’t order enough product and run out of their best-sellers in the middle of December. Now they're dealing with stockouts, missed revenue, and frustrated customers who will happily buy from a competitor. It's a massive missed opportunity right when demand was at its highest.
From Reactive Chaos to Proactive Strategy
These scenarios aren't just hypotheticals; they happen every day. They highlight a fundamental truth for any growing business: inaccurate forecasting is a direct threat to your survival.
When you're constantly overstocking, under-hiring, or misallocating your marketing budget, you're stuck in a reactive state. You're always putting out fires instead of building for the future.
The goal is to transform your forecast from a static, historical report into a dynamic strategic tool. When you can confidently predict future outcomes, you can make proactive decisions about inventory, hiring, and capital allocation that align perfectly with your growth objectives.
Moving away from this chaos requires a structured, data-driven approach. It’s about digging in to understand what truly drives your business and building a forecasting model that reflects those realities. This isn't a luxury reserved for massive corporations; it's an essential discipline for any founder who wants to scale intelligently.
Ready to stop guessing and start building a forecast you can actually trust? The first step is to diagnose the foundational issues hiding in your data.
Book your free BI consultation today and let our experts help you connect the dots in your data.
Building a Foundation on Trustworthy Data
You can't build a reliable forecast on a shaky data foundation. It’s the classic "garbage in, garbage out" problem, and it quietly undermines so many SMBs' efforts to improve forecasting accuracy. They get stuck in a cycle of Excel chaos, siloed data, and time-consuming manual reports, forcing them into reactive decisions.
The real culprit behind most forecasting errors isn't some flawed algorithm; it’s corrupted, incomplete, or siloed data. Before you can even think about fancy models, you have to get your hands dirty and diagnose the health of your foundational inputs.
Mapping Your Disparate Data Sources
For most growing businesses, critical data is scattered everywhere. Your sales pipeline lives in a CRM, revenue is tracked in accounting software like Xero or QuickBooks, and operational metrics are often trapped in random spreadsheets across different departments.
Every one of these systems is a potential point of failure. The first real step is to map them all out and figure out where the information for your forecast actually comes from. This simple diagnostic exercise often shines a light on the silent killers of forecasting accuracy.
- Data Silos: When your sales and inventory systems don't talk to each other, you have zero visibility into how product availability is impacting sales potential. This disconnect makes accurate demand forecasting nearly impossible.
- Inconsistent Formatting: One system might list a region as "UK" while another uses "United Kingdom." These tiny discrepancies create duplicates and stop you from getting a clean, consolidated view of performance.
- Manual Entry Errors: Every single time a person has to copy and paste data from one place to another, there's a risk of error. A single misplaced decimal can throw an entire forecast off course.
These issues are incredibly common, but their impact is massive. Just look at the case of Atlassian. They were dealing with a forecast accuracy of just 65% and discovered that nearly 20% of their sales opportunities were missing basic info like amounts or close dates. By implementing a structured data quality program, they shot their accuracy up to 87% in just two quarters and even shortened their average sales cycle by 12 days.
The infographic below shows a team digging into historical sales data—a critical step for spotting the very patterns and inconsistencies we're talking about.
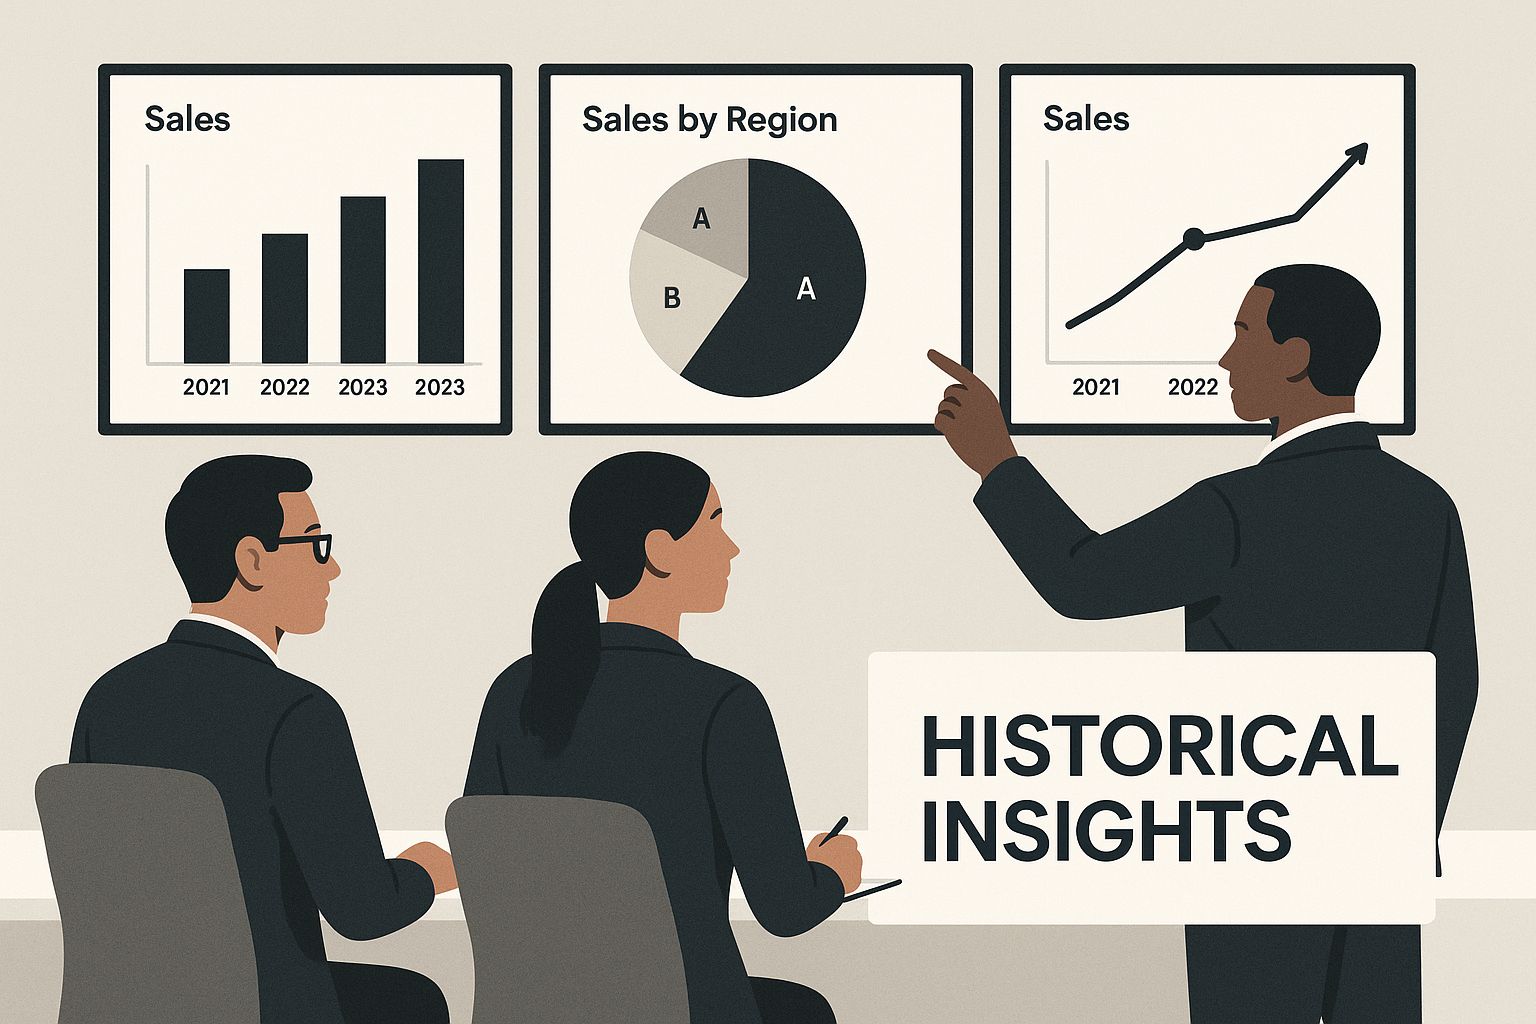
Analyzing these past insights is how you start building a reliable forward-looking model. It's the move from reactive analysis to proactive strategy.
To really bring this home, let's look at how disjointed data sources typically operate in an SMB compared to a unified approach.
Common Data Silos vs a Unified BI Approach
| Forecasting Input | Typical Siloed Source (The Problem) | Unified BI Solution (The Fix) |
|---|---|---|
| Sales Pipeline | Manually exported CRM reports (often outdated) | Live, direct connection to the CRM API |
| Revenue Data | Monthly P&L spreadsheets from accounting | Automated data feed from accounting software |
| Marketing Leads | Separate reports from Google Analytics, ads platforms | Integrated dashboard showing cost per lead by channel |
| Inventory Levels | Daily stock count emails or shared Excel files | Real-time inventory data pulled from the ERP system |
This table makes it clear: the siloed approach is a recipe for errors and wasted time. A unified system, on the other hand, creates a reliable, automated flow of information you can actually trust.
Auditing Your Data for Actionable Insights
Once you've mapped your sources, it's time for a quality audit. This doesn't need to be some complex technical exercise. It’s about asking practical, business-focused questions to spot the weak points.
A data audit isn't just about cleaning up the past; it's about establishing the rules and processes that ensure your data is trustworthy from the moment it’s created.
Start with a simple checklist to pressure-test your most critical data points:
- Sales Pipeline Integrity: Are close dates in your CRM consistently updated, or do you have deals from six months ago still sitting in this month's forecast? Stale data is a huge source of over-optimistic projections.
- Product Code Consistency: Do the product codes or SKUs in your sales system perfectly match those in your inventory and accounting platforms? Mismatches can lead to wrong cost of goods sold (COGS) calculations and flawed margin analysis.
- Lead Source Accuracy: Is lead source data being captured correctly for every new prospect? Without it, you can't accurately forecast the ROI of your marketing spend or predict which channels will drive future growth.
Fixing these problems is about more than just data cleansing. It’s about creating a unified data layer that serves as your single source of truth. What's more, implementing solid data governance best practices makes sure this foundation remains solid as you scale. By transforming from Excel to Power BI, you create a central data warehouse that ensures everyone is working from the same numbers.
By focusing on data integrity first, you make sure that every subsequent step in your forecasting process is built on a foundation you can actually trust.
Adopting Driver-Based Financial Modeling
Once your data is clean, centralized, and actually trustworthy, it’s time to graduate from simplistic, historical forecasting. Let's be honest, just adding 10% to last year's revenue isn't a strategy; it's a guess.
There's a much more powerful way to operate: driver-based financial modeling. This approach fundamentally changes the questions you ask about your business. Instead of asking, "What were our sales last quarter?" you start asking, "What actually drives our sales?" This shift turns your forecast from a reactive report card into a dynamic strategic tool.

Identifying Your True Business Drivers
So, what's a "business driver"? It’s simply an operational metric or an activity that has a direct, measurable impact on a financial outcome. Think of it as the cause, not the effect. Pinpointing these is the first—and most critical—step to improve forecasting accuracy.
For many businesses, these drivers are often hiding in plain sight, trapped in different software platforms or disconnected spreadsheets. The real work is connecting them directly to your financial model.
Here are a few common examples we see all the time with our clients:
- B2B SaaS Company: The number of qualified demos booked and the historical sales close rate are direct drivers of new monthly recurring revenue (MRR).
- E-commerce Brand: Website traffic, average conversion rate, and average order value are the primary drivers of total online sales.
- Service Business: The number of billable consultants and their average utilization rate directly drive consulting revenue.
When you focus on these operational inputs, you build a forecast that actually reflects the mechanics of how your business makes money. If you really want to get into the weeds on this, our complete guide on how to build financial models offers a comprehensive framework.
Building a Model That Connects Ops to Finance
The real magic happens when you build a model in a BI tool like Power BI that directly links these operational drivers to your P&L. Suddenly, your forecast for new MRR is no longer just a number you hope to hit; it's a living, breathing formula.
Let’s use that B2B SaaS company as a real-world example. Their old forecast was painfully simple: "Add £20k in new MRR this month." It was arbitrary and completely disconnected from what the sales team was doing every day.
Their new driver-based model looks completely different. It's built on a simple but incredibly powerful formula:
New MRR = (Number of Qualified Demos) x (Demo-to-Close Rate %) x (Average Contract Value)
Now, the forecast is actionable. To hit that £20k MRR target, the model can instantly tell them how many demos the sales team needs to book, based on their current close rate.
This completely transforms the conversation. Instead of management just pushing for a revenue number, the discussion becomes about strategy: "How can we increase the number of qualified demos?" or "What can we do to improve our close rate by 2%?"
The Strategic Advantage of a Dynamic Forecast
When your forecast is tied to these operational levers, it stops being a static document you glance at once a month. It becomes your go-to tool for scenario planning and making sharp strategic decisions.
With a driver-based model humming away in Power BI, you can ask—and instantly answer—critical "what-if" questions:
- "What happens to our revenue if we increase marketing spend by 15% and that boosts website traffic by 20%?"
- "How will hiring two more salespeople impact our demo booking capacity and, therefore, our new MRR over the next six months?"
- "If a competitor's move causes our conversion rate to dip by 0.5%, what's the immediate hit to our projected cash flow?"
This is where you truly unlock insight-led decision-making. You're no longer just reporting on what happened; you're actively modeling the future and making informed choices to shape it. This approach provides the clarity and confidence founders need to scale smartly and finally escape the operational chaos of guesswork.
Bringing Your Forecasts to Life with Power BI
A brilliant, driver-based forecast is useless if it's locked away in a spreadsheet that no one sees or understands. Its real power is only unlocked when you turn that complex model into a living, breathing dashboard that provides at-a-glance clarity. This is where we move from preparing static monthly reports to dynamic, real-time dashboards that empower proactive decisions.
The goal is simple: stop wasting hours on manual updates and start spending that time analyzing what the data is telling you. A well-designed Power BI KPI dashboard is the bridge between your robust financial model and actionable business strategy.
Visualizing Performance with Variance Analysis
The most fundamental question a forecast dashboard has to answer is: "How are we doing against our plan?" This is where variance analysis becomes your best friend. Instead of burying this insight on page 12 of a dense PDF report, you can bring it to life visually.
A great dashboard doesn't just show "Forecast vs. Actuals." It tells a story.
- Waterfall Charts: These are perfect for showing how positive and negative variances—like higher-than-expected sales or unexpected supply chain costs—add up to the overall difference between your forecasted and actual profit.
- Key Performance Indicators (KPIs): Big, bold KPI cards can immediately show if you're on track for key metrics like Monthly Recurring Revenue (MRR) or Gross Margin, often with simple colour-coding (green for good, red for bad) for instant comprehension.
This visual feedback loop is critical. It helps you spot deviations the moment they happen, not a month later when you're finally closing the books.
Embracing Uncertainty with Scenario Planning
Your business doesn’t operate in a vacuum, and your forecast shouldn't either. The real world is full of variables, and a static "base case" forecast can feel brittle and totally unrealistic. This is where interactive dashboards in Power BI truly shine.
By building simple toggles or slicers directly into the dashboard, you can empower anyone on your team to perform real-time scenario planning. This moves the forecast from a rigid prediction to a flexible strategic tool.
With a few clicks, you can instantly see the projected impact of different business environments. This isn’t about predicting the future with perfect certainty; it’s about understanding your risks and opportunities so you can prepare for multiple outcomes.
Imagine being able to switch between three core scenarios on the fly:
- Best-Case: What happens if our new marketing campaign overperforms and lead conversion rates jump by 15%?
- Base-Case: The most likely outcome based on our current operational drivers.
- Worst-Case: What's the impact if a key supplier increases prices and our cost of goods sold rises by 5%?
This capability transforms your forecast into an interactive sandbox for strategic thinking. It allows you to pressure-test your assumptions and build a more resilient business plan. You can explore how Vizule helps businesses make this shift by revamping your reporting with Power BI to enable this kind of dynamic analysis.
Tracking the Levers That Matter Most
Finally, your dashboard has to connect financial outcomes directly back to the operational drivers we identified earlier. If website traffic is a key driver of sales, then it needs a prominent place on your dashboard right next to your revenue forecast. Simple as that.
This creates clear accountability and aligns the entire team. Your marketing lead can see exactly how their efforts to boost site visits are impacting the company's top-line goals. Your head of sales can track the demo-to-close rate in real-time and understand its direct effect on the MRR forecast.
This level of transparency ensures everyone is pulling in the same direction, focused on the activities that will actually move the needle. You stop managing by gut feel and start managing by the numbers that truly matter.
Ready to build a dashboard that gives you this level of clarity and control?
Connect with us to design your financial dashboard in Power BI and see how Vizule can make it happen for your business.
Unlocking Predictive Insights with Advanced Analytics
Once you have a solid, trustworthy data foundation, you're ready to stop looking in the rearview mirror. It's time to shift from analyzing what happened to predicting what will happen. This is where you can start to tap into the power of advanced analytics, AI, and machine learning—and you don't need a Ph.D. in data science to understand its impact.
These methods are designed to go far beyond simple historical trends. They find the complex, often hidden, patterns in your data. More importantly, they start weaving in the external factors that influence your business, something traditional forecasts completely miss.
Going Beyond Your Four Walls
Let’s imagine a retail business trying to forecast sales for the next quarter. The standard approach might be to look at the same quarter last year and tack on a growth percentage. It's a decent starting point, but it's operating in a vacuum because it only considers internal data.
An advanced model, however, pulls in data from the outside world. It can integrate external datasets like:
- Consumer spending trends to see if people are feeling confident or cautious.
- Competitor pricing data scraped directly from their websites.
- Social media sentiment to understand how people feel about your brand right now.
- Even weather patterns if you're selling seasonal items like coats or sunscreen.
By blending this external context with your own sales history, the model builds a much smarter, more resilient forecast. It can flag correlations you'd never spot on your own, like how a rival's online promo consistently dips your sales two weeks later.
How Advanced Analytics Delivers Better Accuracy
This isn't some futuristic idea reserved for huge corporations. Smart SMBs are using these exact techniques to get a major leg up on the competition. To really unlock these insights and seriously improve forecasting accuracy, it helps to have a good grasp of What is Predictive Analytics.
The whole point is to let algorithms discover the real drivers of performance, not just the ones you already assume are important. This moves your forecasts away from gut feelings and toward statistical probability.
Advanced analytics isn't about replacing human judgment; it's about augmenting it. It gives you a powerful, data-driven perspective to challenge your assumptions and make smarter strategic bets.
The results speak for themselves. Take GlobalTech, a FTSE 50 company whose profitability was all over the place because of shoddy demand forecasting. By integrating their internal numbers with real-time external data and adopting AI-driven tools, they boosted their forecast accuracy by a massive 40%. That directly led to better production alignment and a 15% jump in profitability in the first year.
Making Predictive Insights Achievable for SMBs
While the story of a FTSE 50 giant is impressive, the tools they used are more accessible than ever. Modern BI platforms like Power BI have built-in features that can run predictive models without you having to write a single line of complex code.
The secret is to start small. You need a clean, unified data source and a clear business question you want to answer. Don't try to predict everything at once.
Pick a single, high-impact area and focus there:
- Predicting customer churn: Which of your customers are most likely to leave in the next 90 days?
- Forecasting lead quality: Score new leads to figure out which ones are actually likely to convert.
- Optimizing inventory: Get a much more precise demand forecast for your top-selling products.
By zeroing in on a specific challenge, you can build a powerful business case for advanced analytics and show its value quickly. This turns it from a scary, expensive project into a high-impact, achievable strategy for any founder who's serious about growth.
Answering Your Top Forecasting Accuracy Questions
When we talk to founders and operators about overhauling their forecasting, the same handful of questions always pop up. It makes sense. Moving away from the comfort of spreadsheets to a more dynamic, data-driven system feels like a big step.
Let's clear the air. Here are some direct, practical answers to those common concerns, aimed at demystifying the whole process and showing you what's truly possible.
How Long Does This Actually Take to Implement?
This is always the first question, and the honest answer is: it depends, but it's almost certainly faster than you think. For a small or medium-sized business that knows what it wants to achieve, a well-scoped project can deliver real, tangible results surprisingly quickly.
We usually break it down into a few phases:
- Discovery and Mapping (Weeks 1-2): First things first, we connect to your key data sources—think CRM, accounting software, etc.—and get a lay of the land. This is where we spot and diagnose any data quality issues.
- Model Development (Weeks 2-4): With the data flowing, we build the core of the system: a driver-based financial model that finally links your day-to-day operational metrics to your financial results.
- Dashboard & Mobilisation (Weeks 4-6): This is where it all comes to life. We build the first version of your interactive dashboard and get your team trained up on how to use it for live analysis.
The goal isn't some massive, months-long, boil-the-ocean project. It’s about getting actionable insights and automating tedious reporting within 30-60 days. From there, we iterate and build on that strong foundation.
This agile approach means you see a return on your investment fast, which helps build momentum and get everyone in the company excited about what's next.
Is This Only for Big Companies with Huge Datasets?
Absolutely not. In fact, we'd argue that SMBs and growth-stage companies are in the perfect position to benefit from this. Why? You're nimble. You can make changes and adopt new ways of working far faster than a huge corporation tangled in red tape.
The core ideas of driver-based forecasting and connecting your data apply whether you have ten employees or ten thousand. It’s not about having petabytes of data; it’s about having the right data, cleaned up and properly connected. We start with what you already have and build a model that reflects the real mechanics of your business.
What Kind of Improvement Can We Realistically Expect?
The jump from manual, spreadsheet-heavy forecasting to a more automated, analytics-driven process is significant. When you layer in advanced analytics and machine learning, you’re not just making small tweaks. Research and real-world results show a 15-30% improvement in forecast accuracy when organizations make this shift. For a deeper dive into these numbers, you can discover more insights about forecasting accuracy improvement on MyShyft.com.
That leap in accuracy isn't just a vanity metric. It translates directly into better cash flow management, smarter inventory buys, and a whole lot more confidence in your strategic planning.
Can My Team Actually Use This?
This is maybe the most important question of all. A brilliant system that no one uses is completely worthless. That’s why usability and adoption are baked into our process from the very beginning. We design Power BI dashboards to be intuitive for people who aren't data analysts, focusing only on the key metrics that actually drive the business.
We aren't trying to turn your sales manager into a data scientist. We're trying to give them clear, visual insights so they can make better decisions every single day. Through hands-on training and building the system with their feedback, we make sure the final solution becomes a go-to tool in their operational rhythm—not just another piece of software they have to log into.
Ultimately, the journey to improve forecasting accuracy is about creating clarity and control. It's about swapping guesswork for a system that connects your team's daily actions to the company's financial destination.
Ready to stop reacting and start planning with confidence? The team at Vizule can help you automate your financial reporting, build a dynamic forecast model in Power BI, and empower your team with insights they can actually use.
Book your free BI consultation and let's build a forecast you can finally trust.


