


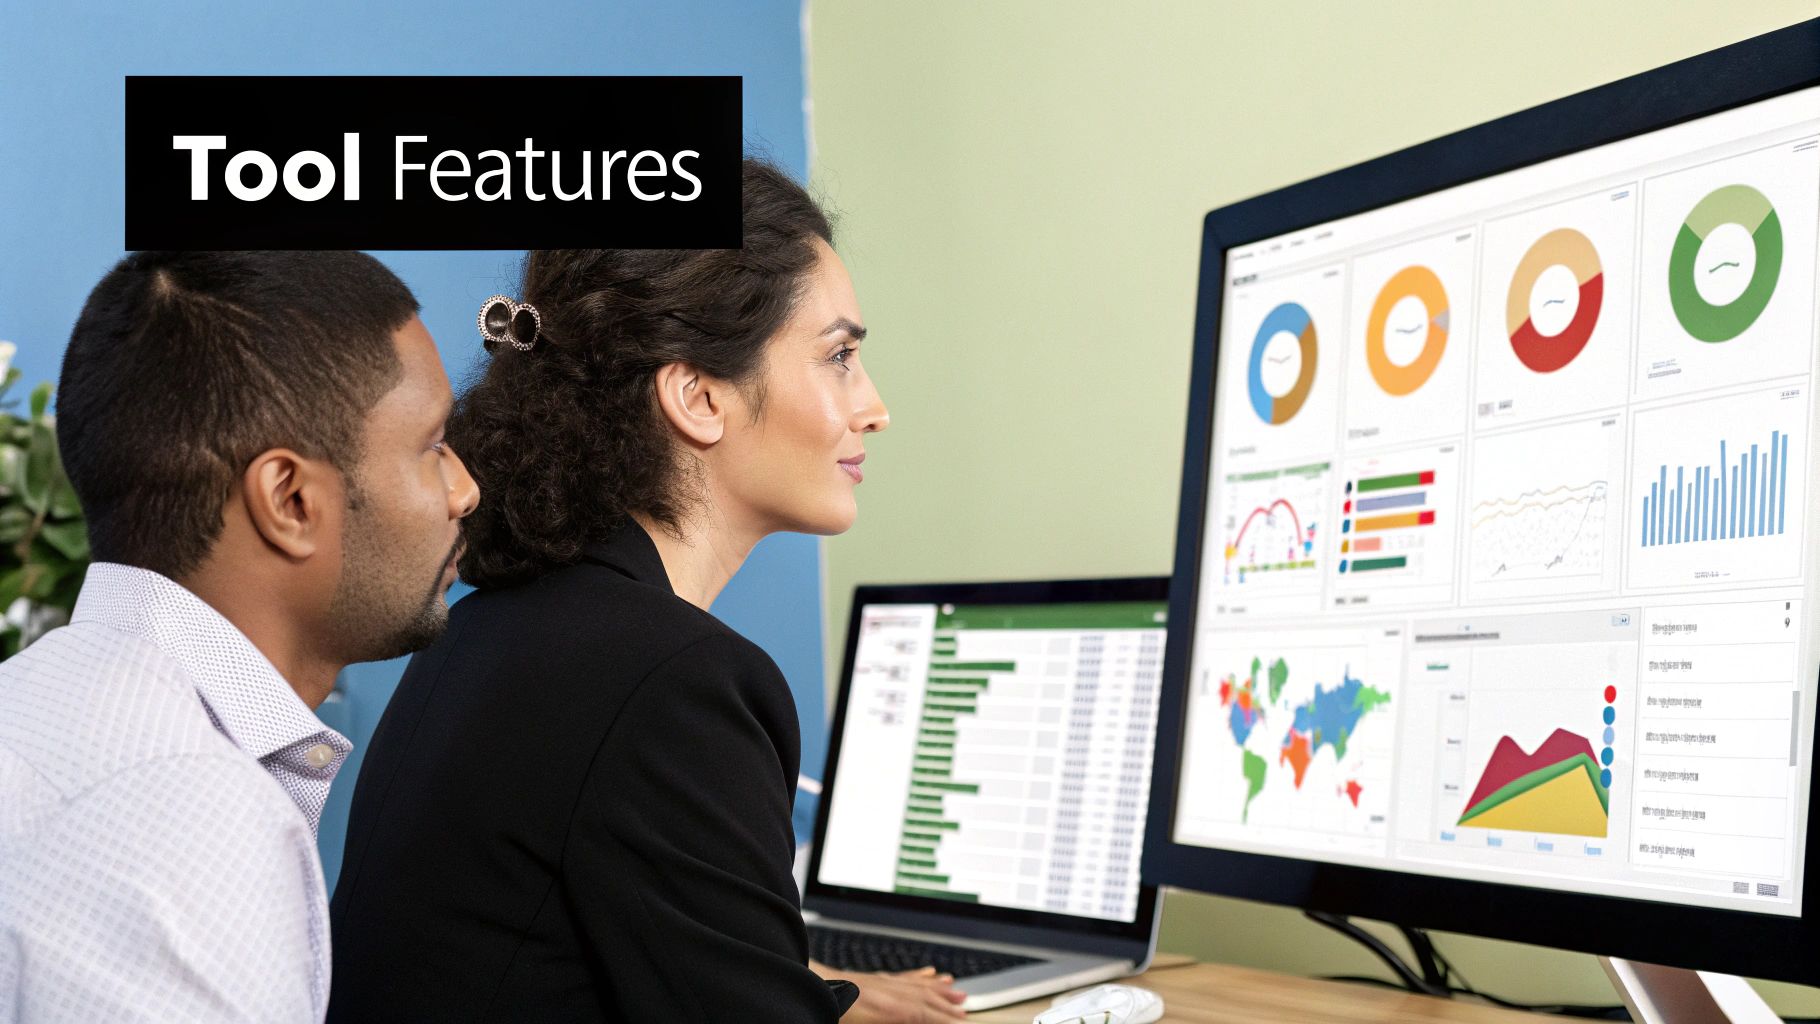
Staring at another disjointed spreadsheet? You’re not alone. The simple truth is that most growing businesses eventually hit a wall with Excel. You get stuck in a frustrating cycle of manual data entry, version control nightmares, and hours wasted just trying to piece things together.
This guide is your strategic escape route from that chaos, offering a direct business intelligence tools comparison to help you find the right path forward and automate your reporting.
Why Your Business Needs to Escape Excel Chaos
If you’re a founder or operator, “Excel chaos” probably sounds painfully familiar. It starts simply enough with a few tracking sheets, but before you know it, you’re wrestling with a complex web of VLOOKUPs, manual copy-pasting, and files named Finance_Report_FINAL_v3_updated.xlsx. This isn’t a sign of failure; it’s a common growing pain for successful businesses.
The core problem is that spreadsheets were never built to be the central nervous system for your company. They can’t provide a single source of truth, which leads to data silos where your finance and operations teams are working from completely different numbers. That disconnect makes getting a clear, real-time picture of your performance nearly impossible.
The True Cost of Manual Reporting
The hours your team spends manually pulling reports are just the tip of the iceberg. The hidden costs are far more damaging and can genuinely stall your growth.
These costs include:
- Delayed Decisions: When it takes days to assemble a report, you’re making critical decisions based on old, stale information.
- Costly Errors: A single misplaced formula or an incorrect data entry can ripple out, leading to flawed financial models and poor strategic choices.
- Lack of Insight: Spreadsheets show you what happened, but they rarely explain why. They can’t easily connect your sales data to marketing spend or link operational efficiency to profitability.
While many businesses still rely on static spreadsheets, the shift toward comprehensive data solutions—like those used in business intelligence for banks—is becoming essential for growth in every sector.
For a growing SMB, the right BI platform isn’t an expense—it’s an investment in operational clarity. It frees your team from tedious data tasks to focus on what truly matters: driving the business forward.
Introducing Business Intelligence as the Solution
This is where a dedicated Business Intelligence (BI) tool changes the game completely. A modern BI platform creates that elusive single source of truth by connecting directly to your various data sources—like QuickBooks, your CRM, and other operational software—to automate the entire reporting process. You can see more on how this works in our article on business intelligence for small business.
This shift is happening on a massive scale. The global Business Intelligence software market was valued at USD 41.74 billion in 2024 and is projected to hit USD 151.26 billion by 2034, driven by the need for better data analysis and efficiency.
This guide will provide a clear business intelligence tools comparison to help you find the right fit, turning your data from a source of constant frustration into your most valuable asset.
Comparing The Top 3 BI Tools for SMBs
Picking the right BI tool can feel like a huge task, but for most growing businesses, the choice really boils down to three heavyweights. This business intelligence tools comparison is written for the non-technical founder, focusing on what these platforms actually do for you, without getting bogged down in jargon. Let’s take a look at the leaders: Microsoft Power BI, Tableau, and Looker.
The market is a battleground. Back in 2021, Microsoft Power BI already commanded over 30% of the market share in the analytics space, serving well over 100,000 organizations. Tableau wasn’t far behind with a solid 16.99% market share, also boasting a customer base of over 100,000 who swear by its incredible data visualization tools. You can dig deeper into these market dynamics to see their full industry footprint.
Microsoft Power BI: The Natural Evolution for Excel Users
For any business already living and breathing in Microsoft 365, Power BI is the most logical and budget-friendly next step. It’s built to feel familiar to anyone who’s spent countless hours in Excel, which dramatically shortens the learning curve for your team.
Its real power lies in the deep integration with the entire Microsoft ecosystem, from Azure to Dynamics 365. This makes it incredibly simple to hook up your existing data and start building powerful, automated reports that refresh on a schedule. You can finally break that exhausting cycle of manual updates and get a live look at your financial and operational KPIs.
Tableau: The Master of Visual Storytelling
Tableau has rightfully earned its reputation as the gold standard for data visualization. If your main goal is to create compelling, intuitive, and highly interactive dashboards that tell a crystal-clear story with your data, then Tableau is a beast.
It empowers users to explore data visually with a simple drag-and-drop interface, making it accessible even for team members who aren’t data analysts. This is perfect for marketing, sales, and operations teams who need to quickly see and understand trends in customer behavior or campaign performance.
The infographic below gives a quick breakdown of the typical pricing models for these platforms, offering a handy reference point for budgeting.
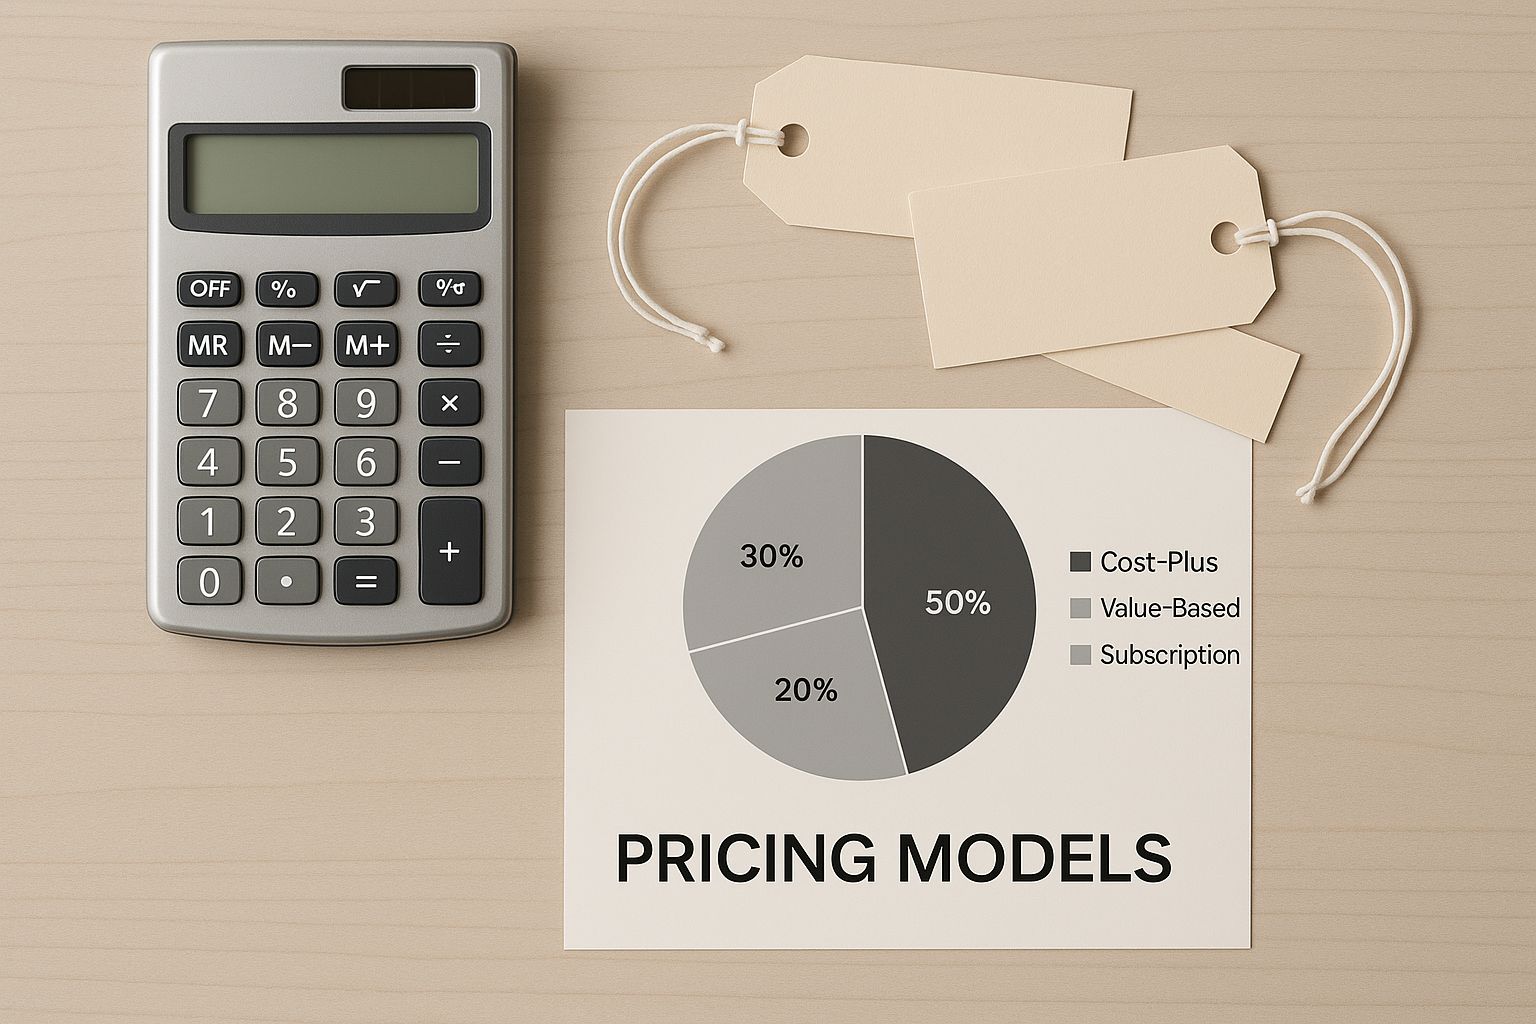
As the image shows, BI tool costs can range from accessible per-user subscriptions to custom enterprise pricing, which really drives home the need to look beyond the sticker price.
Looker: The Foundation for Data Governance
Looker, which is now part of Google Cloud, comes at the problem from a totally different angle. It’s built around a powerful, governed data modeling layer called LookML. This means a developer or data analyst first defines all your business metrics and logic in one central model.
Sure, this initial setup requires more technical know-how, but the payoff is massive. It creates a bulletproof, consistent data environment where everyone in the company is working from the exact same definitions. For businesses that are prioritizing long-term data consistency and building a single source of truth that will scale with them, Looker is an outstanding choice.
Key Takeaway: Your choice really hinges on your starting point. If you live in Excel, start with Power BI. If you need to persuade with visuals, look to Tableau. If you’re building a long-term, scalable data culture, consider Looker.
To make things even clearer, here’s a quick rundown to help you match your business needs with the right platform.
Quick Comparison: Power BI vs. Tableau vs. Looker for SMBs
This table gives a high-level overview of what sets these tools apart, specifically for SMBs trying to make the right call.
| Platform | Best For | Core Strength | Typical SMB Use Case |
|---|---|---|---|
| Microsoft Power BI | SMBs already using the Microsoft ecosystem (Excel, Azure). | Seamless integration, cost-effectiveness, and a familiar interface. | Automating financial reports and creating KPI dashboards for sales and operations. |
| Tableau | Businesses needing to create compelling, interactive visual reports for stakeholders. | Best-in-class data visualization and intuitive dashboard design. | Building marketing campaign performance dashboards or analyzing customer journey data. |
| Looker | Scaling companies that need a single, governed source of truth for all metrics. | A centralized, reusable data model (LookML) that ensures consistency. | Creating a unified view of product usage, sales, and financial data for a SaaS company. |
Ultimately, the best BI tool is the one that solves your immediate pains while giving you a clear path for growth. For many SMBs finally moving on from Excel, Power BI offers the smoothest and most powerful transition.
Ready to see how Vizule can help automate your reporting stack with the right tool for your business? Book your free BI consultation today.
A Deep Dive Into Key Decision Factors
Choosing a BI tool isn’t about ticking off features on a checklist. For a growing business, the platform you pick has to mesh with your team’s skills, plug into the software you already use, and grow with you as your data gets more complicated. This business intelligence tools comparison is all about the practical stuff that actually matters for SMBs.

We’re going to cut through the marketing noise and get down to what you can expect day-to-day from Power BI, Tableau, and Looker. We’ll look at four key areas to help you see not just what the tools can do, but how they’ll actually work inside your business.
Ease of Use and Learning Curve
The flashiest tool in the world is useless if your team finds it too hard or frustrating to use. For small and mid-sized businesses that don’t have a dedicated data department, getting people to actually use the tool is everything.
- Power BI: For teams already living in the Microsoft ecosystem, Power BI is the hands-down winner. Its interface feels like a supercharged version of Excel, which dramatically shortens the learning curve. If your people know how to make a PivotTable, they can build a basic report in Power BI.
- Tableau: Famous for its slick drag-and-drop interface, Tableau makes it incredibly easy for just about anyone to start exploring data visually. It encourages a kind of “play” with data that often leads to those “aha!” moments and unexpected insights.
- Looker: This one is a different beast entirely and has the steepest learning curve by design. Its real power is in its LookML data model, which needs a developer or data analyst to set up first. After that foundation is solid, business users get a secure, easy-to-use environment, but that initial technical lift is significant.
For most SMBs, Power BI hits the sweet spot. It offers the most accessible starting point, letting your current team get up and running quickly without needing to hire specialized talent.
Data Connectivity and Integration
A BI tool is only as good as the data it can get its hands on. Connecting smoothly to the software you rely on every day—your accounting system, CRM, and marketing tools—is an absolute must.
It’s also crucial to see if a tool can handle things like real-time data analytics for the most current insights. While all three platforms boast hundreds of connectors, the devil is in the details for a small business.
Power BI has a home-field advantage with its native connections to the Microsoft stack, including Azure, Dynamics 365, and, of course, Excel. It also connects easily to SMB favorites like QuickBooks Online and Stripe. Tableau is no slouch in connectivity either, but it can sometimes take a bit more tinkering to get it talking to certain data sources. Looker shines when connecting to modern cloud data warehouses, making it a top pick for tech-savvy companies.
The bottom-line question for an SMB founder is: “How fast can I hook this up to my QuickBooks, Shopify, and CRM?” For many, Power BI gives the most direct and affordable answer right out of the box.
Visualization and Dashboarding Capabilities
Dashboards are where raw data gets turned into a story that leads to action. Each tool takes a different approach to telling that story.
Tableau is the undisputed champion of beautiful, polished visuals. It gives you fine-grained control over every single chart, color, and layout detail. This makes it perfect for creating stunning, presentation-quality dashboards to show investors or the board.
Power BI, on the other hand, is built for practical, KPI-focused dashboards. While you can customize it a lot, its real strength is in creating no-nonsense, actionable reports that track core business metrics. It’s less about artistry and more about giving you a crystal-clear, at-a-glance view of performance—perfect for sales, finance, and ops teams. Looker’s dashboards are clean and effective, but their primary goal is consistency, driven by the underlying LookML model.
Scalability and Data Governance
As your business grows, so does your data. The BI tool you choose today needs to be able to keep up with you tomorrow. This isn’t just about handling more data (scalability) but also about making sure that data is trustworthy and consistent (governance).
- Looker: Data governance is where Looker truly excels. By defining all your business logic in one central LookML model, it makes sure everyone in the company is using the exact same definition for a metric like “monthly recurring revenue.” It’s a powerful way to build a solid data foundation for the future.
- Power BI: By piggybacking on the massive and secure Azure cloud, Power BI offers almost limitless scalability. It gives SMBs a clear path to grow from simple reports to a full-blown data warehouse, all within a familiar ecosystem.
- Tableau: While Tableau is more than capable of handling huge datasets, maintaining strong governance often requires careful planning and sometimes bringing in other tools to manage data definitions centrally.
Putting a solid framework in place from day one helps you avoid major headaches later on. You can learn more by checking out some key business intelligence best practices that are valuable no matter which tool you end up with. For companies with big growth plans, both Power BI and Looker provide strong—though very different—paths to building a scalable and reliable data culture.
Understanding the True Cost of Business Intelligence
When you’re shopping for a business intelligence tool, that per-user, per-month price tag is just the tip of the iceberg. The real investment goes way beyond the subscription fee you see on the pricing page. If you want to make a smart decision, you have to look at the Total Cost of Ownership (TCO)—that’s everything you’ll spend, directly and indirectly, to get a BI platform actually delivering value.
Let’s break down the different pricing models you’ll run into and, more importantly, the “hidden” costs that almost always catch small and mid-sized businesses by surprise. Getting this right is a make-or-break part of any serious business intelligence tools comparison.
Deconstructing the Pricing Models
Each of the big players comes at pricing from a different angle, trying to appeal to different team sizes and how they work with data.
- Power BI’s Accessible Per-User Fee: Microsoft Power BI is famous for its simple, competitive pricing. You pay a straightforward monthly fee for each user, which unlocks a ton of power. This makes it an incredibly popular starting point for businesses ready to graduate from Excel.
- Tableau’s Tiered Subscriptions: Tableau uses a role-based model. You’ll pay a premium for “Creator” licenses—the people building data sources and dashboards—and less for “Explorer” and “Viewer” licenses for team members who just need to interact with existing reports.
- Looker’s Custom Platform Pricing: Looker (now part of Google Cloud) is different. Its pricing is custom-built for each business, based on things like how many users you have and the scale of your data connections. It’s usually the biggest upfront investment, which makes sense given its focus on building a governed, long-term data platform.
Here’s a quick look at how Tableau breaks down its roles, which helps clarify who needs which license and why.
This visual from Tableau makes it easy to see how they segment users. The cost is tied directly to the level of access and functionality each person actually needs.
The Hidden Costs SMBs Often Overlook
Zeroing in on the license fee is a classic rookie mistake. The true cost of getting a BI solution off the ground involves several other critical factors you have to account for.
Here are the expenses you absolutely must budget for:
- Implementation and Setup: Unless you have a data wizard on your team, you’re going to need help. Connecting your data sources (like QuickBooks or Shopify), building a solid data model, and designing your first set of useful dashboards takes real expertise. This is often where a consultancy like Vizule delivers the most immediate punch.
- Data Warehouse Needs: As your data piles up, trying to pump everything directly into a BI tool gets slow and messy. You’ll likely need a central data warehouse—think Azure SQL or BigQuery—to store and organize your data for snappy reporting. That comes with its own cloud hosting fees.
- Ongoing Training and Support: Your team needs to learn how to go from just looking at reports to actively exploring the data themselves. Budgeting for ongoing training ensures you’re actually getting the full value out of what you paid for.
Recent analysis of BI software spending really drives this home. While Power BI has a massive customer base thanks to its low per-seat cost, platforms like Looker and Tableau command a larger slice of total BI spending. This shows that bigger companies are allocating serious budget for the customization and governance these platforms are known for. You can dig deeper into these BI software spending patterns on ramp.com.
The cheapest tool isn’t always the most cost-effective. The right BI platform saves hundreds of hours in manual work—that’s the real ROI.
At the end of the day, you’re not just buying software; you’re trying to solve a business problem. A successful rollout, backed by expert implementation, saves your team countless hours and prevents the kind of reporting errors that lead to bad decisions. That return on investment is worth far more than the initial setup cost.
Want to automate your reporting and finally trust your data? Book a free call with our BI consultants today to get a clear picture of the true cost and ROI for your business.
Which BI Tool Is Right for Your Business?
There’s no single “best” business intelligence tool out there. The real question is, which one is the right fit for your business? After doing a detailed business intelligence tools comparison, it’s clear the goal isn’t to pick an overall winner. It’s about finding the platform whose strengths line up perfectly with your team’s skills, your budget, and where you’re headed.
Instead of just listing features, let’s look at three real-world scenarios we see every single day with SMBs and startup founders. See which one sounds the most like you, and you’ll get a no-nonsense recommendation to get you started.
The Scrappy Startup
Your Profile: You’re an early-stage company, running lean with a small, jack-of-all-trades team. Your entire world probably lives inside the Microsoft 365 suite—Outlook for email, Teams for chats, and a spiderweb of Excel spreadsheets holding your finances and sales numbers together.
Your Primary Goal: You need answers, and you need them fast without breaking the bank or hiring a specialist. The mission is to automate those manual sales reports, get a live look at your financial KPIs, and finally get a clear picture of your cash flow without a six-week implementation project.
Our Recommendation: Microsoft Power BI
If your business is already running on Microsoft, Power BI is the no-brainer. Its interface feels a lot like Excel, which massively cuts down the learning curve for your team. The affordable per-user pricing won’t scare your accountant, and its seamless connection to tools like Excel and Azure gives you a straight shot to automating the reporting you’re already doing by hand.
The Data-Driven E-commerce Brand
Your Profile: You’re running an online store, and your data is scattered everywhere. Sales and customer info are in Shopify, ad spend is siloed in Google and Meta Ads, and your inventory lives in yet another system. You need to pull all these threads together.
Your Primary Goal: Your focus is on creating beautiful, interactive dashboards that actually tell a story. You’re trying to nail down customer lifetime value, prove marketing campaign ROI, and see the entire sales funnel from the first ad click to the package arriving on a customer’s doorstep.
Our Recommendation: Tableau
When it comes to visual storytelling and blending data from a dozen different places, Tableau is an absolute beast. Its drag-and-drop canvas lets you play with complex data sets until you find those “aha!” moments. It’s perfect for marketing-heavy businesses that need to build a compelling case with data for investors or internal teams.
Making the right choice is about aligning the tool’s philosophy with your business’s immediate needs and future ambitions. Think of it as hiring a new team member; you need the right skills for the job at hand.
The Scaling SaaS Company
Your Profile: Your business is hitting its stride, but so is your data chaos. You have product usage stats from your own platform, subscription numbers in Stripe, and a growing sales pipeline in your CRM. The dream of a “single source of truth” is starting to feel more like a nightmare.
Your Primary Goal: Job number one is locking down data consistency and governance for the long haul. You need Product, Finance, and Sales to all be working from the exact same definition for metrics like MRR and customer churn. No more “my numbers say this” debates in meetings.
Our Recommendation: Looker
For a company that’s scaling fast and needs to build a rock-solid data foundation, Looker (now part of Google Cloud) is the strategic play. Its secret sauce is a governed data modeling layer called LookML, which ensures that once a metric is defined, it’s set in stone across the entire company. It takes more technical lift to get going, but the payoff in data integrity as you grow is massive.
Picking the right platform is a huge step, but it’s just the starting line. To get real value, you need a solid strategy behind it. You can explore some of the foundational ideas in our complete overview of business intelligence.
Which BI Tool Fits Your Business?
Feeling stuck between options? This table breaks down our recommendations based on common business profiles and goals we encounter. Find the scenario that best matches your situation to see which tool we’d point you toward.
| Your Business Profile | Primary Goal | Our Top Recommendation | Why It’s a Good Fit |
|---|---|---|---|
| Early-stage startup on a tight budget | Get quick, affordable insights without a steep learning curve | Power BI | Low cost, familiar Excel-like interface, and seamless integration with Microsoft 365. |
| Marketing-heavy e-commerce store | Create stunning, interactive dashboards to visualize customer behavior | Tableau | Best-in-class data visualization and great for blending multiple data sources like ad platforms and sales channels. |
| High-growth SaaS company | Establish a single source of truth and data governance across all departments | Looker | Its governed data modeling layer (LookML) ensures every team uses consistent, reliable metrics. |
| SMB with a small data team | Empower non-technical users to explore data and build their own reports | Power BI or Tableau | Both offer user-friendly, drag-and-drop interfaces that reduce reliance on technical experts for basic analysis. |
This scenario-based approach is exactly how we help our clients. We don’t just sell software; we partner with you to implement the right solution that actually solves your problems.
Ready to find the perfect fit for your business? Book your free BI consultation and let our experts design a clear roadmap to automate your reporting.
Your Next Step From Comparison to Clarity
This entire business intelligence tools comparison brings one truth into sharp focus: picking the software is just the first step on the map. The real win isn’t in the tool itself, but in how it’s brought to life. Success is born from expert data modeling, thoughtful dashboard design, and a clear strategy that hooks your data directly into your biggest business questions.
For a founder or operator already spinning a dozen other plates, this can feel like an impossible final hurdle. You’ve diagnosed the problem—the chaos of Excel—and you’ve scouted the solutions. But bridging that gap between buying a tool and getting answers you can act on is exactly where most BI projects fall apart.
This is where we step in.
From Overwhelmed to Empowered
You don’t need to become a data expert overnight just to unlock the power of your own information. That’s our job. At Vizule, we specialize in connecting the dots for SMBs, turning scattered data sources into a single source of truth that powers confident decisions. We take on the technical heavy lifting so you can get back to what you do best: running your business.
Your data is already telling a story about your business—its challenges, its opportunities, and its path to growth. Our mission is to help you finally hear it, loud and clear.
It’s time to move from comparing tools to gaining clarity. Let us build a practical, no-nonsense plan to automate your financial and operational reporting. We’ll free you from the grind of manual tasks and give you back the time you need to focus on strategy.
Ready to build a reporting stack you can finally trust? Book your free BI consultation with our experts today, and let’s unlock the insights your data is waiting to reveal. It’s time to trade chaos for clarity and scale your business with confidence.
BI Tools: Your Questions Answered
Diving into a business intelligence tools comparison can feel like opening a can of worms. If you’re a founder or operator ready to graduate from spreadsheets, you probably have a ton of practical questions. You need straight answers, not just a sales pitch.
We get it. Let’s tackle some of the most common questions we hear from businesses just like yours.
Do I Really Need a Data Warehouse to Use a BI Tool?
This is the big one, and the short answer is no—you don’t need a data warehouse to get started, particularly with a tool like Power BI. You can plug directly into sources like QuickBooks, Stripe, or your CRM and start building dashboards right away.
But here’s the thing: as your company grows, so does your data. Pulling from multiple sources gets messy, fast. A data warehouse acts as your single source of truth—a clean, organized, and optimized hub for all your information. It makes your reports faster, way more reliable, and a whole lot easier to manage down the line. Think of it as upgrading from a chaotic filing cabinet to a structured library. It’s a crucial step for scaling your data game.
How Long Does It Actually Take to Implement Power BI?
While tools like Power BI are becoming more intuitive, a proper setup isn’t an overnight job. It’s important to have realistic expectations to avoid getting frustrated. A typical first project usually breaks down into three main phases:
- Hooking Up Your Data: First things first, we need to establish secure connections to all your key systems.
- Building the Data Model: This is where the magic happens. We map out the relationships and business logic to make sure every metric is spot-on. This step is critical for accuracy.
- Designing the First Dashboards: Finally, we build the initial set of interactive reports that zero in on your most urgent business questions.
For most small to medium-sized businesses, a focused initial implementation can start delivering real, actionable insights within 30 to 60 days. The idea isn’t to solve every problem at once, but to score some quick wins that show immediate value.
Can Power BI Just Replace All My Financial Reporting in Excel?
Let’s be clear: Power BI won’t replace your core accounting system, but it will absolutely transform your financial reporting. Forget the tedious monthly ritual of exporting data to build P&Ls, cash flow statements, and variance reports in Excel. Power BI connects directly to your financial sources.
What does that mean for you? Your reports are always live, fully interactive, and free from the copy-paste errors that haunt every finance team. It turns static spreadsheets into dynamic dashboards. You can drill down from a high-level P&L right into individual transactions with a single click. It’s the perfect partner for Excel and your accounting software, giving you a much clearer, real-time view of your company’s financial health.
Choosing the right tool is only half the battle. The real value comes from getting the implementation right. At Vizule, we’re experts at connecting the dots in your data so you can get back to focusing on growth.
Book your free BI consultation and let’s talk about what your financial dashboards could look like in Power BI.


