


For a small business, business intelligence (BI) is just a practical way of turning your scattered data into clear, actionable insights. Forget the idea of expensive, complex software for massive corporations. At its core, BI is about getting straight answers to your most critical questions, using data you can finally trust.
Think of it as upgrading from a paper map to a live GPS for your company. It’s the tool that helps you move from reacting to last month’s numbers to proactively shaping next month’s success.
The Problem: From Spreadsheet Chaos to Strategic Clarity
If you're running a small or medium-sized business, this probably sounds familiar: you're juggling data from a dozen different places. You have QuickBooks for your financials, maybe Shopify for sales, and Google Analytics for your marketing efforts. Then, you've got a pile of spreadsheets trying to stitch it all together.
The result is almost always a tangled mess. Manual reporting eats up your time, is dangerously prone to copy-paste errors, and is pretty much out of date the second you finish it.
This is exactly the problem BI solves for small businesses. It cuts right through that noise by connecting directly to all those separate data sources and automatically pulling everything into one central, reliable place. From there, it transforms raw numbers into interactive dashboards and reports that actually make sense.
Instead of dedicating hours to manual data wrangling in Excel, you get a real-time, unified view of your business performance. This is the fundamental shift—from manual chaos to automated clarity—that BI delivers.
What Does BI Actually Do For You?
On a practical level, business intelligence helps you move from making decisions based on gut feelings to making them based on cold, hard facts. It’s a system designed to give you clear answers to the questions that keep you up at night.
For a typical small business, this looks like:
- Automating Financial Reporting: Stop spending hours manually updating your cash flow forecast or P&L. BI tools can create dynamic financial models that refresh themselves.
- Creating a Single Source of Truth: It puts an end to the endless "which number is correct?" debate. Everyone from finance to ops is looking at the exact same verified data.
- Gaining Performance Visibility: Finally, you can understand what’s truly driving your revenue and profitability with Key Performance Indicator (KPI) dashboards that track the metrics that matter most.
- Unlocking Proactive Decisions: Instead of just reacting to last month’s numbers, you can spot trends as they happen. This lets you fix problems or jump on opportunities long before your competitors even see them.
A good BI system doesn't just show you what happened; it helps you understand why it happened and what you should do next. It connects the dots between your sales figures, marketing spend, and operational costs to paint a complete picture of your business.
The table below breaks down what this transition really feels like day-to-day.
Moving From Manual Spreadsheets to Automated BI
| Business Function | Before BI (Spreadsheet Chaos) | After BI (Automated Clarity) |
|---|---|---|
| Sales Reporting | Manually exporting data from CRM/Shopify, copy-pasting into Excel. Reports are weekly at best and often contain errors. | Live sales dashboard showing performance by rep, region, and product in real-time. Alerts for big wins or deals at risk. |
| Financial Analysis | Updating P&L and cash flow spreadsheets is a multi-day process at the end of each month. Forecasting is pure guesswork. | Automated financial statements that are always up-to-date. Dynamic cash flow forecasting based on live data. |
| Marketing ROI | Trying to connect Google Analytics clicks to actual sales in QuickBooks is a nightmare. Hard to know which campaigns are working. | A unified dashboard showing ad spend, leads, conversion rates, and customer acquisition cost (CAC) from all channels. |
| Operational Efficiency | Inventory or project data lives in a separate system, completely disconnected from financial and sales figures. | One view combining inventory levels with sales trends to prevent stockouts and identify slow-moving products. |
This shift isn't just about better reports; it's about fundamentally changing how you operate.
Ultimately, bringing BI into your business is about reclaiming your time and gaining the confidence to steer your company with precision. It replaces guesswork with a clear, data-backed strategy, freeing you up to focus on what you do best: growing your business. By embracing business intelligence for your small business, you’re not just buying software; you’re building a foundation for smart, sustainable scaling.
The Real-World Benefits of a BI Strategy

Putting a real business intelligence strategy in place is about more than just gathering data. It’s about making smarter, faster, and ultimately more profitable decisions. For a small business, this isn't some abstract theory; it's about seeing tangible results that directly boost your bottom line.
A well-executed BI plan delivers real-world advantages that can give you a serious leg up on the competition. It’s about swapping ambiguity for clarity and ditching manual grunt work for automated, intelligent insights.
Achieve a Single Source of Truth
One of the first and most powerful benefits you'll see is the creation of a single source of truth. It’s a simple concept but incredibly impactful: everyone in your company is looking at the exact same, verified data.
No more meetings getting sidetracked by arguments over whose spreadsheet is the "right" one. When your sales, marketing, and operations data are all piped into one system and refreshed automatically, you kill off conflicting numbers and get the whole team aligned on one version of reality.
This alignment builds trust and lets you spend your precious time actually analysing the insights, not just debating where they came from. It's the bedrock of a truly data-driven culture.
Automate Tedious and Time-Consuming Reporting
Think about it: how many hours does your team sink every single month into manually exporting data, pasting it into spreadsheets, and piecing together reports? For most small businesses, the answer is "way too many." BI systems automate this entire soul-crushing process, giving you hundreds of valuable hours back.
Imagine your monthly sales performance dashboards, financial summaries, and inventory updates just appearing, ready to go, without anyone lifting a finger. This frees your team from the low-value grind of data wrangling so they can focus on high-impact, strategic work. Our guide on business intelligence for finance dives deep into how this automation can completely overhaul your financial workflows.
By automating routine reporting, you’re not just saving time; you’re reallocating your most valuable resource—your team’s brainpower—towards growth and innovation.
Gain Complete Visibility Into Performance Drivers
Gut feelings can only get you so far. A proper BI strategy gives you clear, objective visibility into what's really driving performance in your business. You can finally connect the dots between your actions and your results.
- Marketing Impact: See precisely which campaigns are bringing in the most profitable customers, not just vanity metrics like clicks.
- Sales Effectiveness: Instantly identify your top-performing products, sales reps, and customer segments in real-time.
- Operational Efficiency: Pinpoint bottlenecks in your processes, whether it's a supply chain snag or an inefficient use of resources.
This kind of deep insight allows you to double down on what’s working and fix what isn’t with surgical precision. For instance, a local retailer can use BI to connect foot traffic patterns with sales data and inventory levels to optimize staffing schedules and product placement, directly boosting store profits.
Make Proactive and Competitive Decisions
Perhaps the biggest win is shifting from being reactive to proactive. Instead of picking apart last quarter's numbers to figure out what went wrong, you can spot trends as they’re happening and jump on them immediately.
BI tools are the key to making more data-driven, strategic decisions, which is a massive driver of success for small businesses. Research has shown that SMBs who adopt BI see tangible performance boosts, like better sales forecasting and more accurate inventory management. One quick-service restaurant chain even used data analytics to improve staff performance and customer satisfaction, leading to a 5% sales increase in its test market.
When you can transform raw data into actionable insights, you're not just looking in the rearview mirror. You're steering the business with a clear view of the road ahead, ready to anticipate customer needs and outmaneuver your competitors.
How AI Is Making Business Intelligence Smarter

You don’t need a data science degree to get real value from artificial intelligence anymore. In fact, AI is quickly becoming the secret weapon inside modern business intelligence tools, acting like a virtual data analyst that’s on the clock 24/7. This isn't some futuristic tech—it’s a practical, accessible advantage for small businesses right now.
This blend of AI and BI is precisely why business intelligence for small business has become so powerful. AI does the heavy lifting, moving past simple reports that show you what happened and actively helping you understand why—and what's likely to happen next.
And small businesses are catching on, fast. A recent survey showed that the number of small business owners using AI nearly doubled in just over a year, jumping from 26% in Q2 2023 to 51% by Q4 2024. This boom proves that most SMBs now see AI as a vital tool for everything from marketing to inventory management. You can dig into the full small business AI adoption trends on BizBuySell.com.
Your Own Virtual Data Analyst
Imagine being able to have a conversation with your data. Instead of wrestling with complex reports or pivot tables, you just ask questions in plain English. For founders and operators who aren't data experts, this is a total game-changer.
Tools like Microsoft Power BI, for example, have built-in "Q&A" features that let you type questions right into your dashboard.
- You could ask, "What were my top 10 most profitable products last quarter?" and instantly get a chart with the answer.
- Or try something like, "Compare sales in London versus Manchester for the last 60 days," and a comparison graph will pop up automatically.
This kind of feature opens up data analysis to everyone on your team. It completely removes the barrier between having a business question and getting a trustworthy answer from your data.
AI in business intelligence isn't about replacing human intuition. It's about augmenting it with powerful, automated analysis so you can make faster, more informed decisions with confidence.
Uncovering Hidden Risks and Opportunities
Beyond just answering your direct questions, AI is brilliant at spotting patterns and anomalies that a person could easily miss. It works tirelessly in the background, monitoring your data streams and acting as an early warning system for your business.
1. Automatic Anomaly Detection
Let's say your sales for a key product suddenly drop by 15% on a Tuesday. Without AI, you might not catch this until the end-of-week sales meeting. An AI-powered BI tool, however, can flag this strange dip in real-time and shoot you an alert. It can even cross-reference other data to suggest possible causes, like a broken link in a marketing email or a competitor launching a new promo. This means you can react immediately, not days later when the damage is already done.
2. Predictive Forecasting
Traditional forecasting often leans on historical averages and a healthy dose of guesswork. AI elevates this by analysing past data, seasonality, and even external market factors to build far more accurate predictions. This is incredibly useful for:
- Cash Flow Management: Get a much clearer picture of your future cash position, helping you plan for big expenses or spot potential shortfalls early.
- Inventory Planning: Predict future demand for specific products, helping you avoid costly stockouts or the opposite problem of overstocking.
This isn't about having a crystal ball. It’s about using data to model what’s likely to happen, giving you the foresight to prepare and strategize. With AI-driven BI, you gain a partner that helps you find the hidden stories in your data and turn them into your next big win.
Your Practical Roadmap for Implementing BI
Moving from theory to practice can feel like the hardest part of bringing business intelligence into a small business. But it doesn't have to be some massive, overwhelming project. A successful BI rollout isn't about boiling the ocean; it's about starting with a clear strategy and chasing quick wins that deliver immediate value.
Forget the complex technical jargon. The best approach is a practical, step-by-step framework built for busy founders and operators. The focus is always on the business strategy first and the technology second. By asking the right questions upfront, you make sure your BI system becomes a core part of how you make decisions, not just another piece of software you pay for.
This simple graphic gives you a high-level view of the process, zeroing in on defining your goals before you ever touch the data.
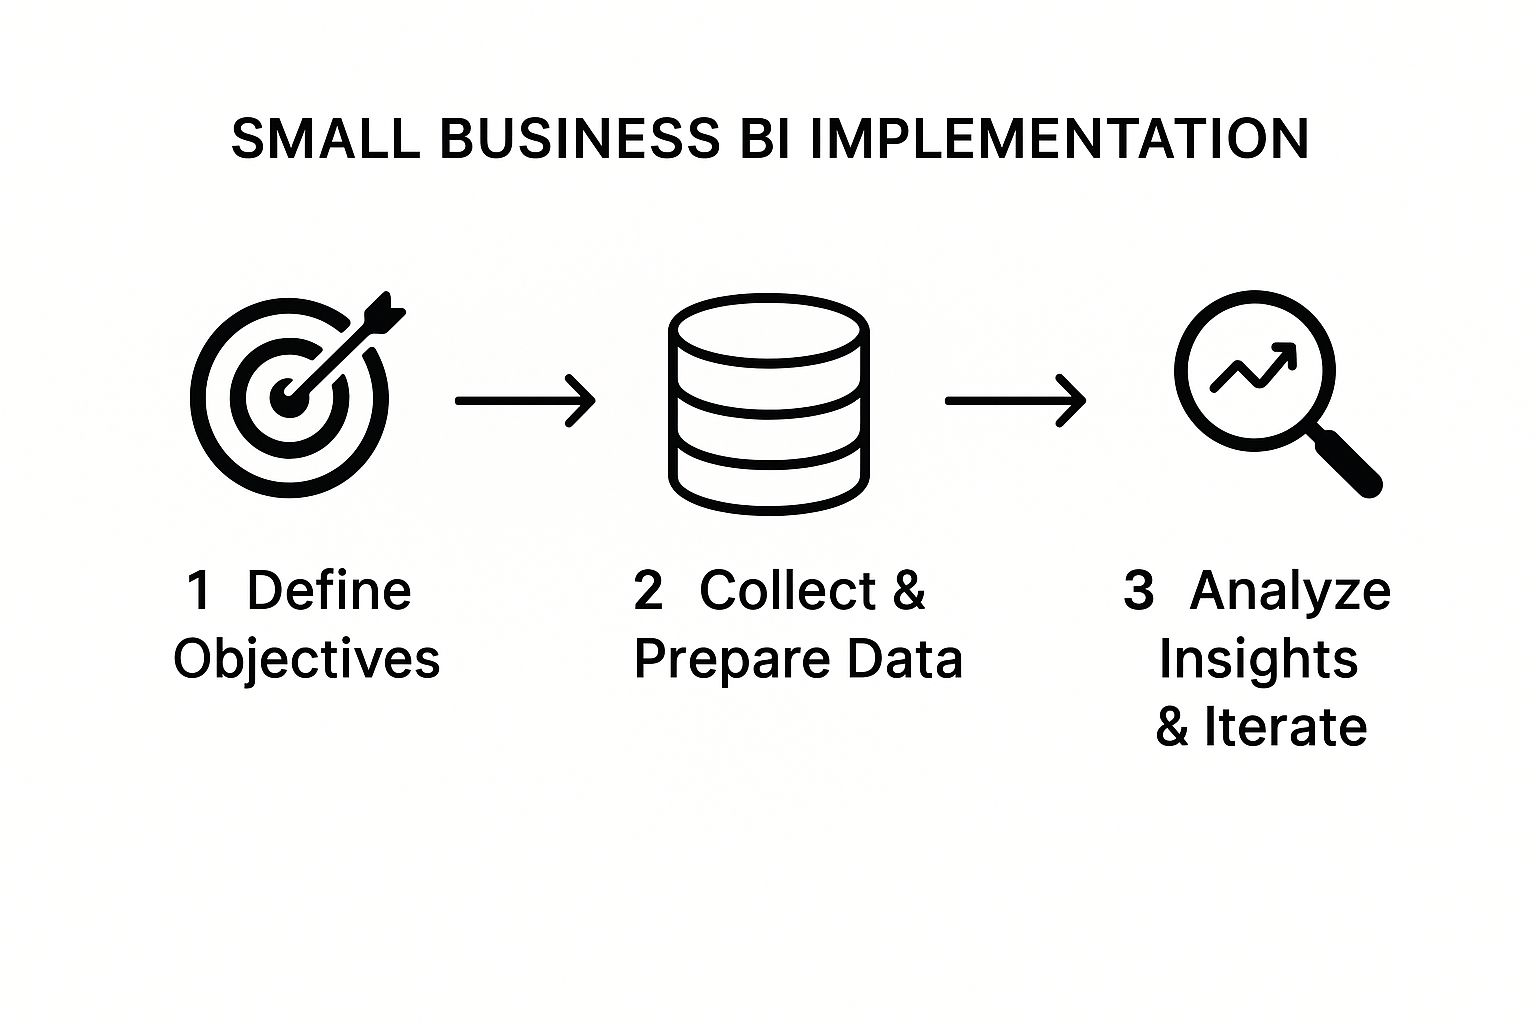
As you can see, a good BI journey is a cycle. It starts with clear objectives and then you iterate based on the insights you uncover along the way.
Phase 1: Define Your Core Business Questions
Before you even think about tools or data, start with your pain points. What are the burning questions that, if you had the answers, would make the biggest difference to your business? This is the most critical step because it anchors your entire BI strategy to real-world results.
You have to get specific here. A vague goal like "improve sales" is useless. Instead, frame it as a question:
- "Which of our marketing channels is actually bringing in customers with the highest lifetime value?"
- "What's our true cash flow position for the next 90 days based on what's coming in and going out right now?"
- "Which products have the best profit margins once you factor in all the associated costs?"
Focusing on 3-5 mission-critical questions like these will stop you from getting lost in a sea of data. It gives you a clear target for your first dashboards and guarantees you're solving an actual business problem from day one.
Phase 2: Pinpoint and Connect Key Data Sources
Once you know what you need to answer, the next step is figuring out where those answers live. For most small businesses, the data is scattered across a handful of key systems. You don't need to connect everything at once—just the sources you need to tackle your priority questions.
Common data sources for an SMB often include:
- Financial Data: QuickBooks, Xero
- Sales Data: Shopify, Stripe, or your CRM
- Marketing Data: Google Analytics, Meta Ads, etc.
- Operational Data: Inventory management systems or project management tools
The goal here is to set up automated connections to these platforms. Modern BI tools like Power BI have built-in connectors that make this incredibly straightforward, finally putting an end to manual data exports and copy-pasting into spreadsheets. We take a deeper look at how this works in our guide on data analytics for small business.
Phase 3: Build Your First Essential Dashboards
Now it’s time to bring your data to life. With your sources connected, you can start building your first dashboard. The key is to keep it simple and focused entirely on the business questions you hammered out in phase one. This isn't about creating dozens of charts; it's about visualizing your most important Key Performance Indicators (KPIs) so they are immediately understandable.
Your first dashboard should be a "mission control" for your business. It should tell you at a glance whether you are winning or losing on the metrics that matter most, prompting action where needed.
For example, an e-commerce founder might build a dashboard showing daily revenue, customer acquisition cost (CAC), and inventory levels for top-selling products. That's it. It provides a clear, real-time snapshot of business health without any unnecessary noise.
Finally, make looking at the data a weekly rhythm for your team. Schedule a short, recurring meeting to review the dashboard, talk about what you're seeing, and agree on the next steps. This simple habit transforms BI from a passive report into an active tool that drives growth, ensuring your investment pays off week after week.
Common BI Mistakes and How to Avoid Them

Starting your BI journey is a huge step toward building a smarter, more resilient business. But let's be honest, the road can be a bit bumpy. Plenty of businesses stumble into common pitfalls that stall their progress and make them question the whole investment.
Knowing these mistakes ahead of time is your secret weapon. By avoiding a few frequent missteps, you can ensure your BI system becomes a source of genuine clarity, not just another layer of complexity.
Mistake 1: Trying to Measure Everything at Once
When you first unlock your data, the temptation is to track every metric under the sun. This "boil the ocean" approach almost always backfires. It leads to cluttered dashboards, confused teams, and a serious case of analysis paralysis.
Instead, start small and stay focused. Pinpoint the 3-5 Key Performance Indicators (KPIs) that tie directly to your most urgent business goals right now. A laser focus on these vital signs makes your dashboards immediately useful and keeps everyone aligned.
Mistake 2: Overlooking Data Quality
There’s an old saying in analytics: "garbage in, garbage out." It’s timeless for a reason. You can have the most powerful BI tool on the market, but if the data feeding it is a mess—incomplete, inaccurate, or full of duplicates—the insights it spits out will be dangerously misleading.
Before you build a single chart, do a quick data health check. Look for inconsistencies and gaps in your core systems like your CRM or accounting software. Cleaning up your data sources is the non-negotiable first step to building a BI system you can actually trust. For a deeper dive, check out our guide on business intelligence best practices.
A BI tool only visualises the data you give it. Ensuring that data is clean and reliable from the start is the single most important factor for success. It's the foundation upon which every valuable insight is built.
Mistake 3: Treating BI as a One-Time Project
So many businesses treat their BI implementation like buying a new piece of office equipment. They set it up, switch it on, and expect it to run perfectly forever. This is a fundamental misunderstanding of what BI is. Business intelligence isn't a static project; it's a living, breathing process.
Your business changes. Your goals shift. Your market evolves. Your BI system has to keep up. This means regularly reviewing your dashboards, retiring metrics that are no longer relevant, and always asking new questions of your data. This iterative approach ensures your BI strategy remains a valuable asset that continuously delivers results.
Small Business BI: Your Questions Answered
Jumping into business intelligence can feel like a huge step, especially when you're already juggling the a-to-z of running a small business. It's completely normal to have questions swirling around—what's the real cost? Is my company big enough? How complex is this stuff, really?
We hear these questions all the time from founders and owners just like you. So, we've put together some straight-to-the-point answers to cut through the jargon and show you just how practical and powerful modern BI can be. This isn't about enterprise-level headaches; it's about giving you tools to solve real problems, right now.
How Much Does BI Cost for a Small Business?
This is usually the first thing on everyone's mind, and the answer is almost always a pleasant surprise. Forget the old-school notion that business intelligence requires a six-figure budget and a dedicated team of analysts. Those days are long gone.
Modern BI is incredibly flexible. With subscription tools like Microsoft Power BI, the software cost is minimal. Your main investment is in the strategic setup—the initial work to design your data models and build dashboards that actually answer your most important questions. A focused project with a consultancy can deliver a powerful, automated reporting system for a tiny fraction of what it used to cost.
The real way to think about it is Return on Investment (ROI). A well-built BI system often pays for itself in just a few months. It does this by reclaiming hundreds of hours spent on manual reporting, spotting major cost savings, or shining a light on new revenue streams you never knew existed.
Is My Business Too Small for Business Intelligence?
Absolutely not. In fact, you could make a strong case that small businesses get the most out of BI. Big corporations have entire departments for this stuff. For a small business, a good BI system is like having your own virtual analytics team, giving you a competitive edge that was once out of reach.
Building good data habits early is one of the smartest moves you can make for growth. Even if you're a solo founder or a team of five, BI delivers immediate clarity where it counts most:
- Cash Flow: Get a live, accurate pulse on your financial health.
- Marketing Spend: Finally see which campaigns are bringing in profitable customers.
- Product Strategy: Pinpoint which services or products are your true money-makers.
Starting with BI when you're small builds a solid, data-driven foundation. It ensures that as you grow, your decisions stay sharp and grounded in reality, not just gut feelings.
Do I Need a Technical Team to Manage a BI System?
Nope, and this is one of the biggest game-changers in modern BI. The new generation of platforms, especially Power BI, was built for business users, not just data scientists. They have intuitive, drag-and-drop interfaces that make digging into your data feel completely natural.
Of course, having an expert partner like Vizule for the initial setup is a massive advantage. We handle the heavy lifting—connecting data sources, cleaning everything up, and building the core models for your finances and operations. But the end product is designed for you. Once your dashboards are live, you and your team can easily filter, drill down into trends, and explore follow-up questions without writing a single line of code.
How Quickly Will I See Results from Implementing BI?
You'll see real, valuable results much faster than you think. There's a common myth that BI projects take six months to a year to show any value. That's an outdated model we actively avoid.
A modern, agile approach is all about delivering wins in weeks, not months. We start by pinpointing your most urgent business questions and building foundational dashboards that tackle those head-on.
This means you could have your first mission-critical dashboards—like a live cash flow forecast or a daily sales tracker—up and running in a matter of weeks. The impact is immediate. You gain instant clarity, and you stop wasting countless hours on manual reporting. From there, we build out more advanced analytics step-by-step, making sure every addition delivers clear value.
Ready to stop wrestling with spreadsheets and start making decisions with confidence? The clarity you're looking for is closer than you think. At Vizule, we specialise in connecting the dots in your data and building automated reporting systems that empower SMBs to scale smarter.
Book your free BI consultation today and let's explore how we can give you a clear, real-time view of your business performance.


