


If you're a founder or an operator, you've probably lived the nightmare of financial planning in Excel. You're swimming in a sea of disconnected spreadsheets, burning hours manually tweaking forecasts, and trying to make sense of conflicting numbers from sales, ops, and finance.
It’s more than just frustrating—it’s a genuine obstacle to growth.
Traditional, manual financial planning just doesn't cut it for a business that's scaling. It's slow, rigid, and practically invites "fat finger" errors. A recent survey of finance pros found that a staggering 75% are still stuck using manual spreadsheets for their most critical planning. They all point to the same problems: it's a massive time sink and simply doesn't scale. This old way of working keeps you trapped, constantly looking in the rearview mirror instead of steering the future.
The Shift to an Automated Approach
The only way out is to ditch the static spreadsheets and embrace a modern, automated financial planning process. This isn't about finding a fancier Excel template; it's a complete overhaul of how you use data to run your company.
Making this leap is a core part of the wider digital transformation in finance. It’s about creating a single source of truth that everyone can rely on.
A modern financial planning process connects the dots between your operational activities and your financial outcomes. It answers not just "What happened?" but "Why did it happen?" and "What will happen next if we change course?"
To see just how different this approach is, let’s quickly compare the old way with the new.
Old Way vs. New Way of Financial Planning
| Planning Aspect | Traditional Method (Excel) | Modern Method (Vizule Approach) |
|---|---|---|
| Data Sources | Manual data entry, copy-paste | Live, automated connections to all systems |
| Model Type | Static, hard-coded assumptions | Dynamic, driver-based, and flexible |
| Collaboration | Emailing files, version control issues | Centralized platform, real-time access |
| Reporting | Manual report creation, often outdated | Automated, interactive dashboards |
| Focus | Backward-looking, historical reporting | Forward-looking, strategic scenario planning |
This table really highlights the limitations of sticking with outdated methods. The modern approach isn't just an upgrade; it's a strategic necessity for any business serious about growth.
The workflow below breaks down the core steps of this modern process.
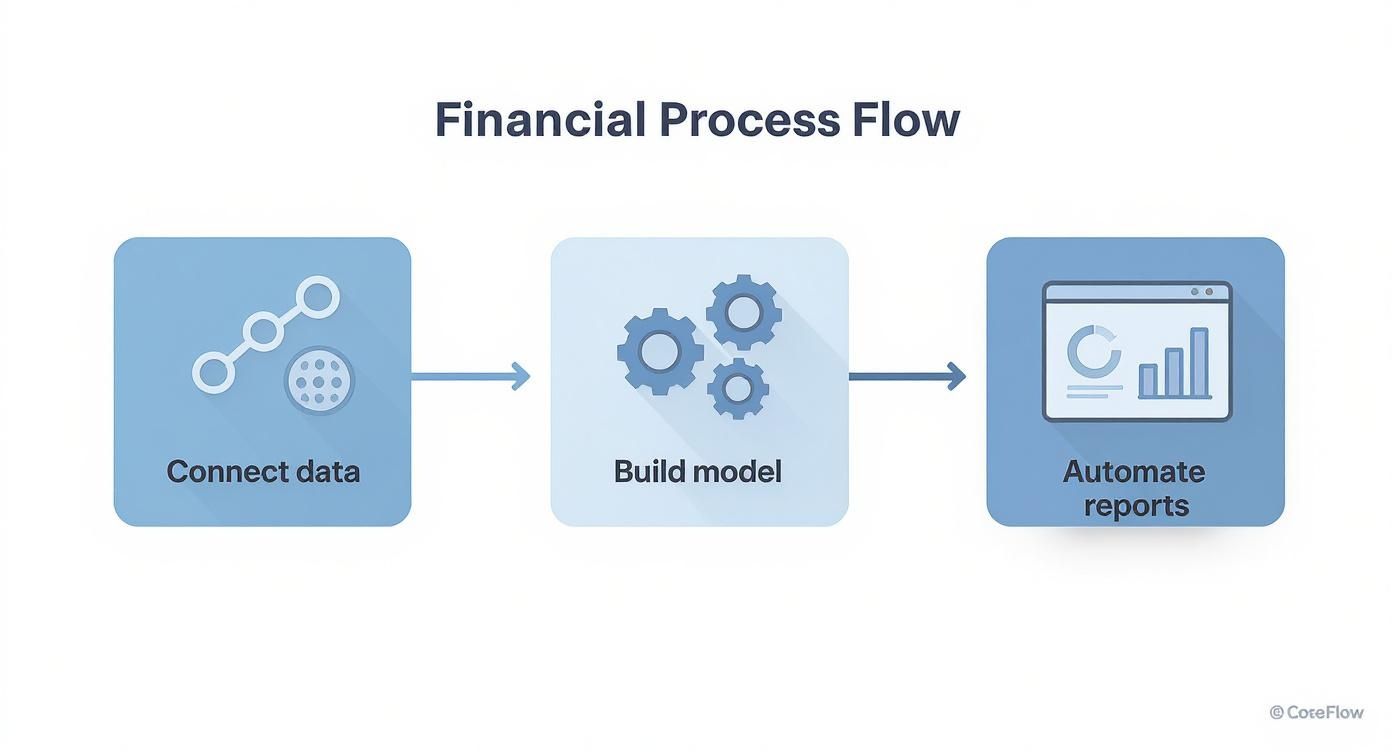
As you can see, it all starts with integrating your data. That foundational step is what makes dynamic modeling and trustworthy, automated reports possible. In the next few sections, we'll walk through each of these phases, giving you a clear blueprint to escape the Excel chaos for good.
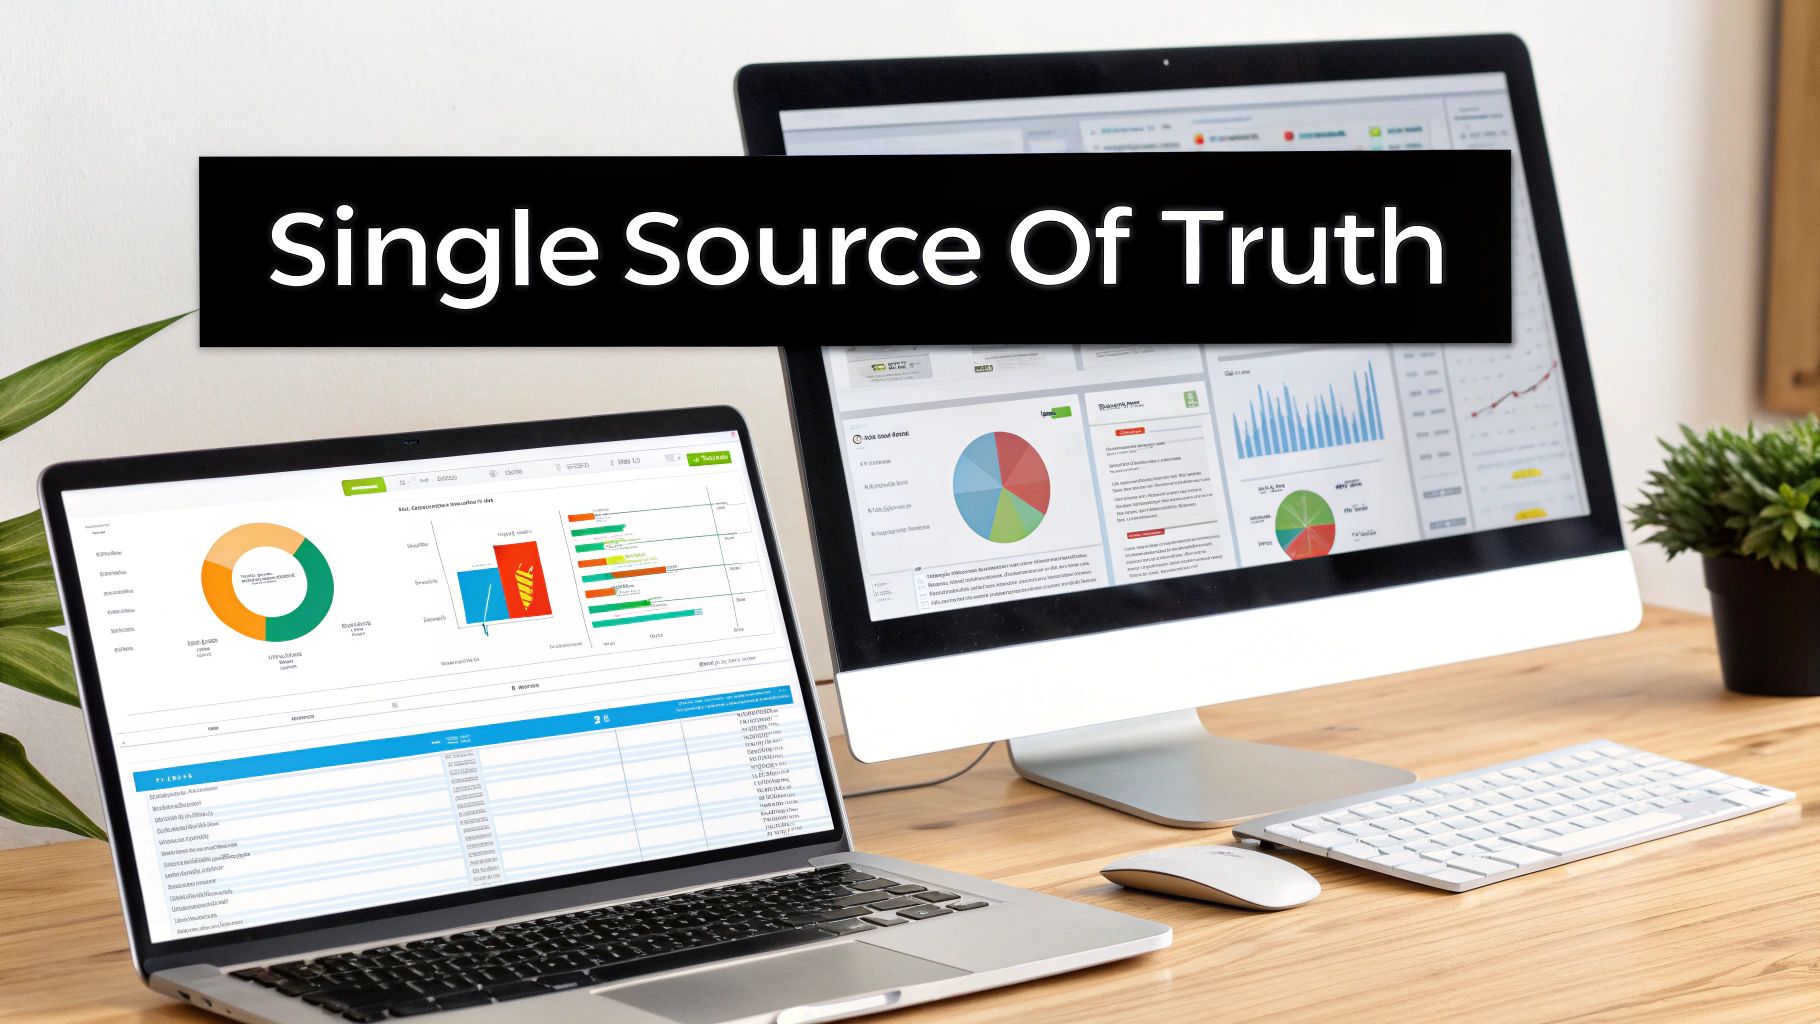
First Thing's First: Build Your Single Source of Truth
Solid financial planning doesn't start with a fancy spreadsheet formula. It starts with your data. For most founders and SMB operators, this is the biggest roadblock right out of the gate.
Think about it: Your sales data is probably in Shopify, customer info is sitting in HubSpot, the financials are in QuickBooks, and all your ad spend is being tracked over in Google Ads. Each system gives you a tiny piece of the story, but no one—not even you—is seeing the complete picture.
This mess of data is more than just an inconvenience; it’s a genuine risk. When your teams are all pulling numbers from different places, you end up with conflicting reports. This leads to endless, frustrating debates about whose data is "right" and, ultimately, big decisions being made on gut feelings instead of hard evidence. The first and most critical move is to tear down these data silos.
Time for a Data Audit
Before you can bring all your data together, you need to know exactly what you’re working with. This is what we call a data audit—basically, mapping out your entire information landscape. It's a discovery phase where you identify every single source of data that has an impact on your business performance.
You don't need a PhD in data science to pull this off. Just start by asking some simple questions for each department:
- Where does our sales data actually live? (Is it Shopify, Stripe, a CRM, or all three?)
- How are we tracking our operational costs? (Are we using QuickBooks, specific inventory software, or even project management tools?)
- Which platforms hold our marketing metrics? (Think Google Analytics, social media ad managers, etc.)
- Is our data even consistent? (For example, does a "customer" mean the same thing in your sales system as it does in your support system? Often, it doesn't.)
Going through this exercise gives you a clear inventory of all your data assets. More importantly, it shines a bright light on all the messy inconsistencies you'll need to sort out.
Unifying Your Data in a Central Model
Once you have everything mapped out, the next step is to bring all those separate sources together. This is where a tool like Power BI becomes a game-changer. Instead of having someone manually export CSVs every week and wrestle with VLOOKUPs that constantly break, we connect directly to your various platforms.
The goal here is to build a centralized data model. This isn't just another report; it's a reliable, unified dataset that becomes the rock-solid foundation for all your reporting and analysis. This model automatically pulls, cleans, and connects information from all your systems.
Let's say you run a direct-to-consumer e-commerce brand. A central model would link your Shopify store data (orders, products) with your QuickBooks accounts (expenses, payroll) and your Google Ads campaigns (spend, clicks, conversions).
Suddenly, you can calculate your true, real-time Customer Acquisition Cost (CAC) and Lifetime Value (LTV) without ever touching a spreadsheet.
That's the power of having a unified dataset. It creates a trusted single source of truth that everyone in the company—from finance to marketing to operations—can rely on to make smart, informed decisions. To really nail this down, you can explore our detailed guide on the importance of creating a single source of truth for your data.
With this foundation firmly in place, you’re finally ready to build a dynamic financial model that reflects what truly drives your business.
Develop a Driver-Based Financial Model
Let's be honest: static, annual budgets are relics. They’re often obsolete the moment they’re finished, completely unable to keep up with the real-time shifts in your business. This is where we move from static numbers to a dynamic, driver-based financial model.
This approach fundamentally changes how you think about forecasting. Instead of just plugging in last year’s numbers plus 5%, you’re connecting your financial outcomes directly to the operational activities that actually generate them. It’s about understanding the why behind the numbers.
Identify What Truly Moves the Needle
A solid driver-based model is built on the core metrics that fuel your company’s growth and costs. For a SaaS startup, for example, these aren't just abstract figures; they are the tangible levers you can pull to influence performance.
Key drivers could include things like:
- Website Traffic: The total number of visitors hitting your marketing site.
- Lead Conversion Rate: The percentage of those visitors who actually sign up for a demo or trial.
- Customer Acquisition Cost (CAC): Exactly how much you spend to win a new paying customer.
- Average Revenue Per User (ARPU): The typical monthly or annual revenue you get from a single customer.
- Customer Churn Rate: The percentage of customers who cancel their subscription each month.
By zeroing in on these core drivers, you stop guessing and start building a logical, cause-and-effect model. It's the only way to build a forecast that reflects the true mechanics of your business. If you want to go deeper on this, check out our guide on how to build financial models that are both robust and scalable.
From Static Forecasts to Dynamic Scenarios
The real magic happens when you bring this approach into a tool like Power BI, where you can build interactive tools for "what-if" analysis. By connecting your drivers to your financial statements—your P&L, balance sheet, and cash flow—you create a living model that answers strategic questions on the fly.
What happens to our runway if we increase marketing spend by 20% and our lead-to-customer conversion rate improves by 5%? What if a new competitor forces us to lower prices by 10%?
Instead of spending a week reworking a fragile spreadsheet, you can get an answer in seconds.
This screenshot from Power BI shows just how simple it can be. A "What-if parameter" creates an interactive slider, allowing anyone to instantly see the impact of changing a key business driver.

This functionality completely transforms your financial model from a static report into a powerful decision-making tool. You can simulate different scenarios—optimistic, pessimistic, and everything in between—to understand your risks and opportunities with total clarity.
It’s no longer just a financial planning exercise; it becomes a strategic conversation grounded in real data. This shift empowers your team to make smarter, faster decisions that are directly tied to your operational strategy.
Give Your Business a Future-Proof Financial Plan with Rolling Forecasts
The annual budget is a snapshot in time. The big problem? Your business isn’t static—it's a living, breathing, constantly moving target. When you rely on a budget that was locked down last October, you're essentially navigating with an old map. You end up making critical decisions based on assumptions that are almost certainly out of date.
To stay nimble, you have to swap that static plan for a dynamic rolling forecast.
A rolling forecast is a living financial plan that's always extending into the future. Instead of a fixed 12-month calendar-year view, you maintain a forecast that consistently looks ahead, typically for the next 12 or 18 months. As each month closes, you drop it from the past and add a new forecast month at the end of the period.
This one simple shift has a massive impact. It forces you and your team to regularly re-evaluate your assumptions based on actual performance, not just what you thought would happen months ago.
From Looking Backwards to Steering Forwards
Making this switch doesn't have to mean drowning in manual work. When you connect this process to your centralized data model in a tool like Power BI, it becomes a highly automated part of your financial planning process steps. Actuals from your accounting software and CRM just flow right in, updating your baseline automatically. This frees you up to focus on what really matters: adjusting your future projections.
This agile approach transforms finance from a historical reporting function into a forward-looking strategic partner. Instead of just explaining why you missed last quarter's numbers, your team can help answer the really important questions:
- Are our current sales trends actually sustainable for the next six months?
- Based on the updated hiring plan, are we going to have a cash flow crunch in Q3?
- How will the latest supply chain disruptions impact our margins next quarter?
This kind of adaptability isn't a "nice-to-have" anymore; it's essential for survival and growth. The global wealth management industry recently hit $305 trillion in assets, but growth has slowed down thanks to volatility, inflation, and geopolitical uncertainty. The data shows that firms modernizing their financial planning are simply better positioned to navigate these choppy waters. You can dive deeper into adapting to this complexity in BCG's 2025 Global Wealth Report.
By constantly looking ahead with the most current data, you empower your leadership team to make proactive adjustments. You can jump on unexpected opportunities or correct course long before a problem ever shows up in a year-end report.
It’s all about making decisions based on where your business is heading, not where it's been. This continuous loop of planning, measuring, and adjusting is exactly what gives agile businesses their competitive edge. With a solid forecast in place, the next logical step is to automate how you share these insights with the entire organization.
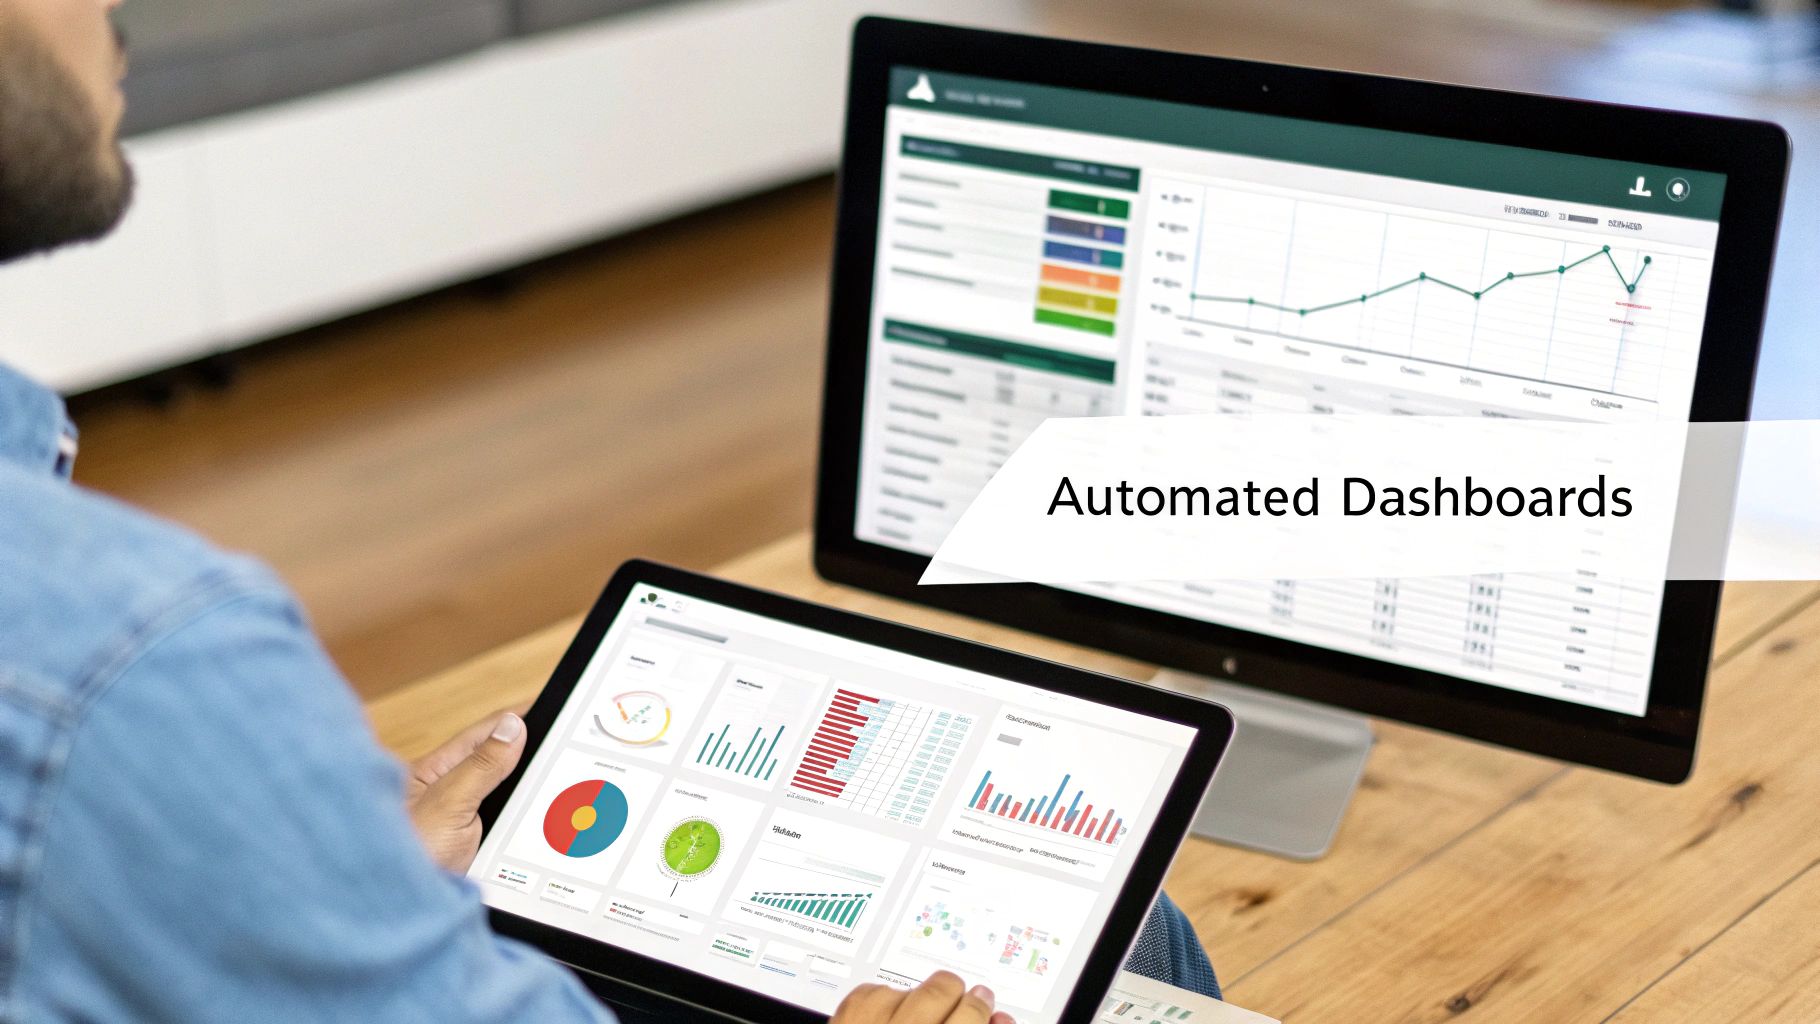
Step 4: Automate Reporting with Interactive Dashboards
Your driver-based model and rolling forecasts are incredibly powerful, but that power is wasted if the insights are buried in a complex spreadsheet no one wants to open. The final piece of a modern financial planning process is automating how you share this intelligence.
This is where all the hard work you put into building a connected data model really pays off. It’s time to stop spending countless hours manually updating static reports.
Instead, you can build automated, interactive financial dashboards in a tool like Power BI. These aren't just prettier versions of your old Excel reports; they are dynamic tools that serve up tailored insights to different stakeholders. A founder might get a high-level executive summary tracking cash runway and EBITDA, while a department head sees a detailed view of their specific budget vs. actuals.
Design for Clarity and Action
Effective data visualization is more science than art. The goal isn't to cram every possible metric onto one screen—it's to communicate insights clearly and drive action. Best practices include using clean layouts, consistent color schemes, and choosing the right chart for the data. A line chart is perfect for showing trends over time, while a waterfall chart is ideal for breaking down changes in your P&L.
But the most crucial element is interactivity. Your team shouldn't be passive consumers of information. A truly effective dashboard allows users to:
- Drill down into details: Click on a total revenue number to instantly see the breakdown by product line or region.
- Filter by different dimensions: Easily switch the view between different time periods, departments, or customer segments.
- Explore relationships: See how a spike in marketing spend impacted new customer acquisition in the same period.
This self-serve capability fosters a culture of data-driven curiosity and accountability across the entire organization.
By automating report creation, you shift your finance team's focus from tedious data compilation to high-value strategic analysis. Their time is better spent interpreting trends and advising the business, not copy-pasting numbers.
This evolution is part of a much larger transformation in the finance world. A 2025 forecast shows that 75% of financial advisors are moving to models that prioritize transparency and data-driven advice, integrating digital tools to automate routine work. This allows them to focus on delivering more responsive, strategic guidance. You can learn more about how digital tools are shaping the future of financial planning on HumanInterest.com.
By adopting automated dashboards, your business mirrors this best-in-class approach internally, making your financial planning process far more agile and inclusive.
Ready to replace manual reports with automated dashboards? Book your free BI consultation to see how Vizule can build your Power BI reporting stack.
Your Questions, Answered
We’ve covered the roadmap from building a single source of truth to getting your reports on autopilot. Still, you probably have a few questions. Here are the ones that come up most often when founders are thinking about making this move.
"How Long Does This Actually Take to Implement?"
This is always the first question, and the answer is usually much faster than you’d think. For most small to mid-sized businesses, we're talking weeks, not months.
The initial heavy lifting involves connecting your key data sources—think QuickBooks, your CRM, and any sales platforms you use. Once that foundation is in place, building out the core data model and your first set of automated dashboards, like cash flow and a P&L, can happen in just a few more weeks.
At Vizule, our entire approach is about delivering tangible value quickly. We start with your most critical reports to give you immediate visibility. From there, it's an iterative process. We build and refine your reporting suite as your business—and your questions—evolve.
"My Data Is a Mess. Do I Need to Clean It All Up Before We Start?"
This concern stops so many founders in their tracks, but the short answer is no, you don’t need 'perfect' data to get started. In fact, kicking off this process is one of the best ways to pinpoint and fix those data quality issues for good.
As we integrate your data sources, we immediately start spotting the inconsistencies, missing fields, and structural problems. We then build data transformation rules directly into the workflow.
What does that mean for you? It means your data gets automatically cleaned and standardized every single time it’s refreshed. The goal here is progress, not perfection. Starting the journey puts you on a clear path to better data hygiene and insights you can finally trust.
"Is Power BI Too Complicated for a Non-Technical Founder?"
While Power BI is an incredibly powerful platform under the hood, the experience for you as the end-user is designed to be completely intuitive. You absolutely do not need to be a Power BI developer to get immense value from it.
Our role at Vizule is to handle all the backend complexity—the data modeling, the transformations, the DAX calculations. We deliver the finished product: a set of user-friendly, interactive dashboards.
You’ll be able to filter, click, and explore your data to get answers to your most pressing business questions without ever writing a single line of code. We also provide full training to make sure you and your team are completely comfortable using your new reports to find the insights that will drive the business forward.
Ready to finally trust your numbers and turn financial planning into a strategic advantage? Vizule connects the dots in your data, replacing the chaos of Excel with automated, insight-led reporting.


