


Before we dive into a side-by-side comparison of dedicated financial planning software, let’s talk about the real reason you’re here: your current process is probably broken. For most small and mid-sized businesses, that process is built entirely on spreadsheets.
It’s completely understandable. Excel is familiar, flexible, and feels like the most cost-effective option when you’re starting out. But as your business grows, those once-reliable spreadsheets start to show their cracks. The frustration isn’t just about wasted hours; it’s the slow, creeping realization that you’ve lost visibility and control over your own numbers. Answering a simple question like, “What’s our cash runway if we hire two more developers?” becomes a multi-day data wrangling exercise.
The Hidden Costs of Manual Financial Planning
This “Excel chaos” is a familiar pain point for founders and operators, and it shows up in several expensive ways. Simple data entry mistakes, version control nightmares (“is this Final_v4_USE_THIS_ONE.xlsx really the final version?”), and broken formulas are the usual suspects. Any one of these can quietly corrupt your financial model.
A single misplaced decimal or a link to an old file can completely derail your cash flow reports and forecasting model. Suddenly, you’re making major strategic decisions based on information that’s fundamentally wrong.

Why Spreadsheets Fail at Scale
Here’s the core problem: spreadsheets were never built to be a collaborative, single source of truth for a dynamic business. They create data silos. Critical information from your sales, operations, and finance teams lives in separate, disconnected files, making a real-time, holistic view of business health impossible.
You’re stuck manually patching together reports from different sources—a process that’s not just painfully slow, but also a minefield for human error.
This reactive approach to reporting has serious consequences:
- Delayed Insights: By the time you’ve finally wrestled the data into a usable format, it’s already old news. This forces you to make decisions based on what happened last quarter, not what’s happening right now.
- Lack of Collaboration: When different departments are working from their own version of “the truth,” it’s impossible to align on key performance indicators (KPIs) and strategic goals. Everyone is looking at a different piece of the puzzle.
- Limited Scalability: As you add new products, hire more people, or expand into new markets, your spreadsheet models become exponentially more complex and fragile. They eventually break under the weight.
The real danger of relying on manual spreadsheets isn’t just inefficiency; it’s the erosion of trust in your own data. When you can’t rely on your numbers, you start making decisions based on gut feeling instead of insight.
Ultimately, graduating from manual planning isn’t just about adopting a new tool. It’s about building a solid data foundation that empowers you to make decisions with confidence. This is the first step toward a modern data stack that gives you the strategic clarity needed to scale.
How to Define Your Business Reporting Needs
Jumping into a financial planning software comparison without first mapping your own needs is like shopping for a car without knowing if you need a pickup truck or a compact sedan. The best tool isn’t the one with the most features; it’s the one that solves your specific business challenges and grows with you. Choosing the right platform begins with a clear, honest assessment of your strategic goals, not just a generic feature list.
This process forces you to look beyond the immediate frustration of messy spreadsheets and focus on tangible outcomes. What critical business questions are you currently unable to answer? A solid needs analysis provides the framework to evaluate any solution against what truly matters to your operation.

Core Functionality: What Do You Really Need?
First, get honest about the complexity of your financial modeling. Are you a startup that just needs straightforward budgeting and cash flow reports? Or are you a scaling SMB that requires sophisticated, multi-scenario forecasting to model different growth paths? The answer dramatically changes the kind of software you should be looking at.
Next, think about the level of detail your team actually requires. Simple income statements might have worked in the early days, but now you probably need to dig deeper. Think about the granularity required to truly understand performance.
- KPI Tracking: Do you need to track high-level financial metrics, or do you need custom operational KPIs (like customer acquisition cost or lifetime value) integrated directly into your financial dashboards?
- Financial Modeling: Is your goal basic budgeting, or do you need driver-based models that can simulate how a change in one variable—like marketing spend—impacts your entire P&L?
- Reporting Cadence: Are monthly reports good enough, or does your team need access to real-time data to make daily operational adjustments?
Integration and Data Sources
A financial planning tool is only as powerful as the data it can access. A platform that can’t seamlessly connect to your existing systems will just create another data silo, defeating the entire purpose of the investment. It is absolutely critical to map out your current tech stack.
What are your primary sources of truth for sales, operations, and accounting data? Your chosen software must have robust, pre-built integrations with these platforms. For instance, if your sales team lives in HubSpot and your accounting is in Xero, any software you consider must connect effortlessly to both. Manual data exports and imports are a non-starter; they reintroduce the very risks of human error and delay you’re trying to escape.
A critical mistake is underestimating your future needs. The right solution shouldn’t just solve today’s problems; it should provide a scalable data infrastructure that supports your business in three to five years.
Scalability and Customization
Finally, think about where your business is headed. A solution that fits your 20-person team today might completely buckle when you hit 100 employees. Consider the software’s ability to handle increasing data volume, more complex financial models, and a growing user base without a significant drop in performance.
Customization is just as important. Off-the-shelf software often comes with rigid, pre-built dashboards. For many SMBs, this is a major limitation. If your business has a unique revenue model or specific operational drivers, you need the flexibility to build reports and visualizations that reflect your unique business logic. This is often where a custom-built solution using a tool like Power BI provides a significant advantage over standard software.
If you’re struggling to define these requirements or want to explore a more flexible, custom approach, a quick chat can bring a lot of clarity. Book your free BI consultation and we can help you map your needs to a solution that truly fits.
Comparing Top Financial Planning Software Tools
Once you’ve nailed down your business reporting needs, the next logical step is to dive into the world of financial planning software. Let’s be honest, the market is crowded, and at first glance, a lot of these platforms look the same. But for a growing SMB, the small differences in how they handle data integration, implementation, and modeling can be the make-or-break factor between a tool that frees up your time and one that just creates more headaches.
This is especially true given how fast this space is growing. The global financial planning software market is on a tear, expected to hit around $4.61 billion in 2025 and projected to grow at an annual rate of 23.55% through 2033. This boom is fueled by businesses just like yours, looking to ditch manual spreadsheets for smarter, cloud-based tools.
To help you cut through the marketing noise, we’ll break down three popular platforms for SMBs: Jirav, Datarails, and Cube. We’ll focus on what really matters to operators on the ground.
Jirav: The All-In-One Forecaster
Jirav positions itself as the complete, all-in-one financial planning and analysis (FP&A) solution for small and medium businesses. Its goal is to create a single source of truth by pulling your accounting, workforce, and operational data into one place.
The real magic of Jirav is its driver-based modeling. It’s built to let you create sophisticated financial models where your P&L, balance sheet, and cash flow statements are all dynamically linked. For a founder wondering how hiring three new sales reps will impact their cash runway, Jirav can map this out in minutes by connecting headcount changes directly to payroll costs and revenue targets.
But being an all-in-one tool has its trade-offs. While it’s incredibly powerful, getting Jirav up and running often requires a serious time investment to configure all the drivers and connect your data sources just right. If you don’t have a dedicated finance person on your team, the learning curve can feel pretty steep.
Datarails: The Excel Enhancer
Datarails comes at the problem from a totally different angle. It gets that most finance teams live and breathe Excel, so it works with that environment instead of trying to replace it. Think of it as a smart data layer that sits on top of your existing spreadsheets, automatically pulling in information from systems like your CRM and ERP.
This is a huge plus for businesses that have already invested heavily in their spreadsheet workflows. Datarails brings in automation and data integrity without forcing your team to learn a whole new system. It solves the “which version of the file is correct?” nightmare by creating a central database for your financial data, which then feeds your Excel models for real-time reporting.
The flip side is that you’re still working within the limits of Excel. While Datarails makes your spreadsheets far more powerful, it doesn’t give you the kind of structured, multi-dimensional database that a platform like Cube does. For businesses with really complex data needs, you might eventually hit a wall.
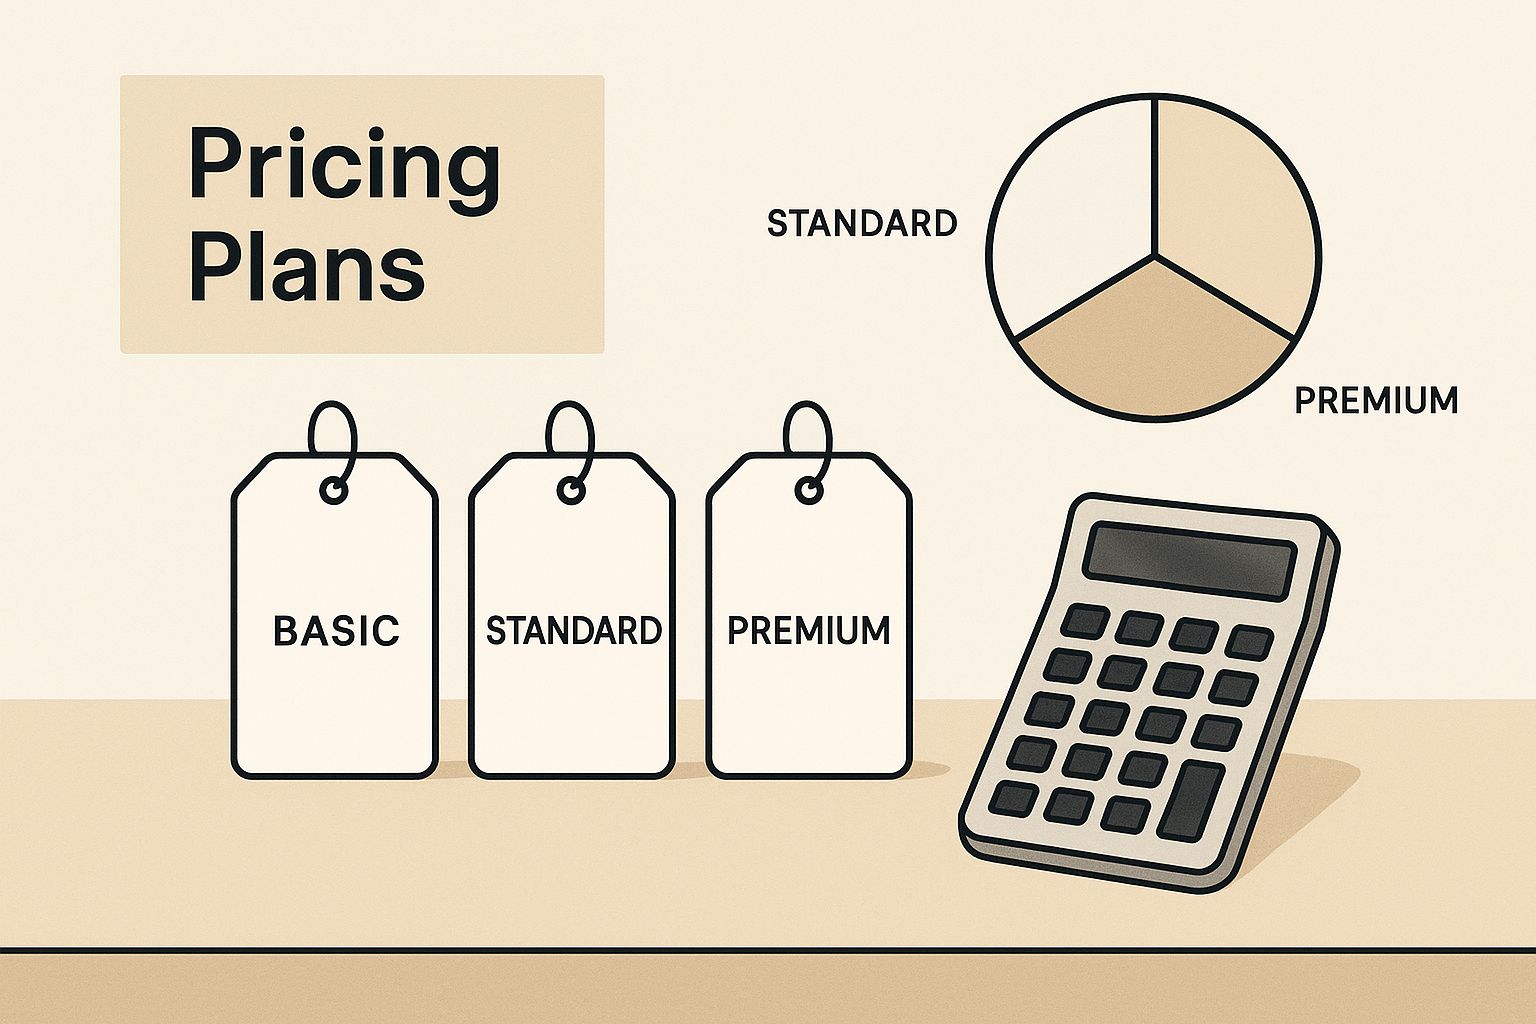
As the graphic shows, pricing for these tools is often tiered. It’s a classic balancing act: choosing a plan that fits your immediate needs while leaving room for future growth is a key part of any software decision.
Cube: The Modern FP&A Platform
Cube aims to be the best of both worlds, bridging the gap between the flexibility of spreadsheets and the raw power of enterprise-level software. It uses a centralized database to hold all your financial and operational data, creating a true single source of truth. From there, users can pull data directly into Google Sheets or Excel to build reports and models.
This hybrid approach is what makes Cube stand out. You get the robust backend and solid data governance of a dedicated platform, but your team gets to work in the familiar, user-friendly spreadsheet environment they already know.
By separating the data layer from the presentation layer, Cube allows for more complex scenario planning and analysis without the risk of breaking formulas or corrupting the source data. It brings structure to the chaos of spreadsheet-based planning.
For instance, an operator can slice and dice sales performance by region, product line, and sales rep all at the same time—a task that would be a nightmare of VLOOKUPs and pivot tables in a standard spreadsheet. This makes Cube a fantastic option for scaling businesses with complex operational models. To get a wider view of the analytics market, a good business intelligence tools comparison can offer some valuable context.
Feature Comparison of Leading SMB Financial Planning Software
To make sense of the key differences, here’s a side-by-side look at how Jirav, Datarails, and Cube stack up on the features that matter most to growing businesses.
| Feature | Jirav | Datarails | Cube |
|---|---|---|---|
| Core Approach | All-in-one platform for modeling, forecasting, and reporting. | Excel-native platform that automates data consolidation into spreadsheets. | Spreadsheet-native FP&A with a powerful, centralized backend database. |
| Best For | SMBs with a dedicated finance team needing a complete FP&A suite. | Teams deeply embedded in Excel who need automation and data integrity. | Scaling businesses with complex data that want a structured backend. |
| Key Strength | Powerful driver-based modeling connecting all financial statements. | Augments existing Excel workflows without disruption. | Combines spreadsheet flexibility with a robust, multi-dimensional database. |
| Potential Drawback | Can have a steep learning curve and requires significant setup. | Limited by the structural constraints of a spreadsheet environment. | Can be overkill for very small businesses with simple financial models. |
| Data Integration | Connects to accounting, HR, and operational systems directly. | Pulls data from various sources (ERP, CRM) directly into Excel. | Centralizes data from all sources into a single source of truth. |
| User Interface | Custom dashboards and reporting modules within the platform. | Your existing Excel or Google Sheets interface. | Your existing Excel or Google Sheets interface, powered by a Cube plugin. |
| Collaboration | Built-in collaboration and version control features. | Uses Excel’s native sharing, enhanced by a centralized data backend. | Enables real-time collaboration in spreadsheets connected to live data. |
This table highlights that the “best” tool really depends on your team’s existing skills, your data complexity, and how you prefer to work.
Making The Right Choice For Your SMB
So, which one is right for you? It all comes down to your company’s current stage, complexity, and internal team.
- Choose Jirav if: You need a powerful, all-in-one forecasting engine and have the internal finance expertise to manage a more involved setup process.
- Choose Datarails if: Your team is married to Excel, and your main goal is to automate data gathering and clean up your existing models without a massive change in workflow.
- Choose Cube if: You’re scaling quickly, have complex data needs, and want a rock-solid data backend but still love the flexibility of a spreadsheet for your analysis.
While these platforms are fantastic for streamlining FP&A, they can start to show their limits when you need to mix deep operational data with your financials. When your questions get more complex—like, “How does website traffic from our last marketing campaign correlate with our sales pipeline and projected cash flow?”—you start pushing the boundaries of what pre-built software can do.
This is where a custom business intelligence solution can be a game-changer.
Gaining a Competitive Edge with Power BI
While dedicated financial planning software is a massive step up from spreadsheet chaos, these tools often trade one problem for another. Many small and mid-sized businesses find that while these platforms automate manual data entry, they lock you into a rigid structure. This box simply can’t adapt to unique business logic or deliver the deep, cross-functional insights you actually need to grow.
This is where a more powerful, flexible alternative comes into play: a custom solution built with Microsoft Power BI.
For a non-technical founder, “custom BI solution” might sound intimidating and expensive, but the idea is actually pretty simple. Instead of cramming your business operations into pre-built software, you build the reporting system around your business. Power BI becomes the central hub, plugging directly into all your scattered data sources.
It pulls everything from your accounting software, CRM, marketing platforms, and even operational spreadsheets into a single, unified data model. This creates a genuine single source of truth—something even dedicated FP&A software struggles with when operational data lives in different silos.
From Siloed Data to Strategic Clarity
Think about a common headache for a growing e-commerce brand. The founder needs to understand the real-time link between marketing spend and cash flow. A standard financial planning tool might show the overall marketing budget from Xero, but it can’t easily connect that to daily ad performance from Google Ads or customer lifetime value from Shopify.
To answer a critical question like, “Did our latest ad campaign generate enough immediate cash to justify the spend, or are we just burning through our runway?” the team has to manually export data from three different systems. Then, they try to stitch it all together in yet another spreadsheet. By the time they get an answer, the insight is a week late.
Power BI solves this by creating direct, automated connections to each data source. The result? A dynamic dashboard where the founder can see marketing spend, sales revenue, and cash flow updating in near-real time, all in one place. They can drill down to see which campaigns are driving profitable growth and make smart decisions on the fly.
This level of integrated analysis isn’t just financial reporting; it’s true business intelligence.
Unlocking Deeper Customization and Insight
The real game-changer with Power BI is its near-limitless customization. Off-the-shelf software gives you standard KPIs and dashboards. But what if your most important metric is totally unique to your business, like “cost per successful client onboarding” or “projected revenue based on sales pipeline velocity”?
Good luck tracking those in a rigid software platform.
With a custom Power BI solution, you can build financial models and dashboards that perfectly mirror your business logic. This lets you connect dots that no standard software can see. You can finally visualize how warehouse efficiency impacts your COGS, how customer support ticket volume correlates with churn, or how website traffic patterns predict future sales.
Here’s the key takeaway for operators with big growth plans: when your business model is unique, your reporting and analytics should be too. To see what this kind of transformation actually looks like, check out our guide on revamping your reporting with Power BI. A custom BI solution gives you far superior insight and adaptability, turning your data from a backward-looking record into a strategic asset that guides your future.
When Does a Custom BI Solution Make More Sense Than Standard Software?
Making the jump from spreadsheets to a dedicated financial planning tool is a huge step in the right direction. But even the best off-the-shelf software can start to feel like a straitjacket once your business hits a certain level of complexity. Standard software is built for the masses, which means it often starts to crack when your reality is anything but average.
This is the crossroads where a custom business intelligence (BI) solution stops being a “nice-to-have” and becomes a strategic imperative. The trick is knowing the signs that you’ve officially outgrown the one-size-fits-all model.
Your Revenue Model Is Atypical
The most obvious trigger is a complex or non-standard revenue model. If you’re a SaaS business juggling intricate subscription tiers, usage-based billing, and deferred revenue, a simple P&L view just won’t do. You need to see the direct line connecting metrics like customer acquisition cost (CAC) and lifetime value (LTV) to your actual cash flow.
The same goes for a project-based business. You need to track profitability by client, project, and even service line, which requires pulling in data from time-tracking and project management systems.
- Standard Software Limitation: Most platforms are great at standard financial statements but fall flat when asked to model unique revenue drivers or blend in granular operational data.
- Custom BI Advantage: A Power BI solution can be built to perfectly mirror your specific revenue logic. It can connect sales pipeline data, project hours, and subscription metrics right into your financial forecasts.
You Depend on Proprietary or Niche Systems
Is your business built on a custom internal platform or niche industry-specific software? Good luck finding a pre-built financial planning tool with a native integration for that. This limitation throws you right back into the manual grind of CSV exports and uploads—the exact inefficiency you were trying to eliminate.
A custom BI setup demolishes this problem. It uses robust data connectors to pull information directly from any source, no matter how obscure. This finally gives you that single source of truth, ensuring your financial reporting is always tied to a complete and accurate dataset.
The decision to go custom often crystallizes the moment you realize your most critical operational data is firewalled from your financial reports. That disconnect is where strategic blind spots are born.
You Need to Blend Financial and Operational KPIs
As a business scales, looking at financial metrics in a vacuum isn’t enough. You have to understand the operational drivers behind the numbers. An e-commerce company, for instance, needs to see how website conversion rates and inventory turnover directly impact its bottom line, preferably in real-time.
This is another area where standard software often falls short. It can tell you what your financials are, but it can’t easily show you how a dip in factory output last Tuesday will ripple through to next month’s COGS. A custom Power BI dashboard, on the other hand, can visualize these cause-and-effect relationships, giving you a truly holistic view of business health. The market is shifting this way; in fact, 70% of financial firms now generate revenue through similar digital platforms. This shows a powerful trend toward integrated, digital-first analysis. You can dig into more of these trends and see their impact with these financial planning industry statistics.
You’re Planning for Rapid, Unpredictable Growth
Finally, if you’re a high-growth startup or an SMB gearing up for aggressive expansion, flexibility is everything. The reports you need today will be worlds away from what you’ll need in 18 months. Pre-built software can be painfully rigid when you start adding new product lines, entering new markets, or pivoting your business model.
A custom BI solution is designed to evolve with you. It gives you a scalable and flexible data infrastructure that can be easily modified to answer new business questions as they pop up. That kind of agility is a massive competitive advantage, letting you get ahead of challenges and jump on opportunities faster than everyone else.
If any of these scenarios hit close to home, you’re probably at the point where the precision and flexibility of a custom solution will deliver a far greater return.
Connect with us to design your financial dashboard in Power BI and build a reporting stack that actually grows with your business.
Automate Your Reporting and Finally Trust Your Data
Let’s be honest, after comparing all these financial planning tools, one thing becomes crystal clear: growing businesses can’t run on messy, disconnected data anymore. Trying to make it work with manual spreadsheets is a recipe for critical errors and reactive, backward-looking decisions. On the flip side, many off-the-shelf software options try to shoehorn your unique business into a rigid, one-size-fits-all box.
The real goal isn’t just about swapping out one tool for another. It’s about building an ecosystem that delivers reliable, real-time insights you can actually trust. This is about creating a single source of truth that finally connects your finance and operations teams.
When you automate this flow of information, you reclaim all those hours wasted on manual report-building. More importantly, you empower your team to focus on strategic, forward-looking analysis. As you start to think about automation and data reliability, it’s worth understanding the core reasons why automate ETL processes to build a truly solid foundation.
Unlock Insight-Led Decision Making
The right setup provides clarity. It connects the dots between your marketing spend and cash flow, or between operational bottlenecks and your bottom line.
This is where a custom Power BI solution, built specifically around your business logic, really shines compared to generic platforms. It gets all your teams looking at the same trusted performance data, unlocking the kinds of insights you need to scale intelligently.
At Vizule, this is exactly what we do—we build automated reporting engines. We focus on business intelligence for finance teams, helping operators like you ditch the cumbersome manual work for dynamic, insightful dashboards. We connect all your disparate data sources to give you the clarity needed for confident, data-backed decisions.
Ready to automate your reporting and finally trust your data? Book a free call with our BI consultants today and see how Vizule can connect the dots in your data.
Common Questions Answered
When you’re comparing financial planning software, a lot of questions pop up. Founders and operators are busy trying to grow the business, so let’s cut through the noise and tackle some of the most common ones.
Which Financial Planning Software Is Most Popular?
While the biggest name isn’t always the best fit for your business, it helps to know who the major players are. The market for financial planning and advisory professionals is pretty concentrated.
In 2025, eMoney was leading the pack with over 28% market share. Right behind were MoneyGuidePro and Right Capital, grabbing 22.79% and 20.68% respectively. Together, these three platforms serve more than 70% of all advisors, which tells you a lot about their influence. You can dig into the market share statistics for a closer look.
How Do I Know When I’ve Outgrown Excel?
Every business hits this point at a different time, but the warning signs are always the same. If any of these sound painfully familiar, it’s probably time to upgrade:
- Version Control Chaos: Nobody on your team can confidently say which spreadsheet is the “real” one. You’re swimming in files named
Final_v2_updated_REAL.xlsx. - Constant Manual Errors: You spend more time hunting down copy-paste mistakes than analyzing the numbers. This completely erodes trust in your reports.
- Always Looking Backward: By the time you finish a report, the data is already old news. You’re forced to make today’s decisions with last week’s (or last month’s) information.
- Siloed Data: You can’t easily pull in data from your sales, marketing, or operations platforms. This makes it impossible to see the full picture of business health.
Can Financial Planning Software Replace a Finance Team?
Absolutely not. Think of this software as a powerful tool, not a replacement for human expertise. Its real job is to automate the tedious, soul-crushing tasks—like data collection, consolidation, and basic report building—that eat up your finance team’s time.
This automation frees them up to do what they do best: strategic analysis, building out what-if scenarios, and delivering real, actionable insights to the leadership team.
The whole point is to empower your finance pros, not make them obsolete. The right system transforms them from data monkeys into strategic partners who drive growth.
Ultimately, the goal is to get the clarity and confidence you need to scale your business without flying blind.
Ready to stop wrestling with spreadsheets and build a reporting stack that actually gives you answers? The team at Vizule builds custom Power BI solutions that connect all the dots in your business data.


