


Calculating forecast accuracy is about comparing your predictions against what actually happened. The process takes the differences between your forecast and the real numbers, then boils them down into a single score using metrics like Mean Absolute Error (MAE) or Mean Absolute Percentage Error (MAPE).
This simple score is incredibly revealing—it tells you just how reliable your business planning really is, and it's the first step to moving beyond guesswork.
Why Your Gut Feel Is Costing You Money
As a founder or business operator, you’ve likely built your company on sharp instincts. It's gotten you this far. But when it comes to cash flow, inventory, and staffing, relying on that 'gut feel' is a high-stakes gamble.
Relying on intuition alone often leads to painful, expensive mistakes that silently chip away at your bottom line and hold back growth. You're frustrated with Excel chaos and siloed data, and this is where it bites hardest.

Bad forecasts kick off a domino effect of operational headaches. One week, you’re dealing with stockouts of a bestseller, losing sales and frustrating loyal customers. The next, you’re staring at a warehouse full of dead stock that’s tying up cash and killing your margins. These aren’t just minor annoyances; they're symptoms of a disconnected financial and operational plan.
The Real Cost of Inaccurate Forecasting
The fallout from poor forecasting ripples through every department, creating friction between teams and draining your resources. For SMBs and startups, these costs are especially damaging:
- Wasted Capital: Over-forecasting means you buy too much stock. That’s cash locked up on a shelf that could have been spent on marketing, a key hire, or product development.
- Lost Revenue: Under-forecasting is just as bad. When a customer is ready to buy but you can't deliver, they’ll find someone who can. That's a sale you'll never get back.
- Operational Chaos: Wildly inaccurate predictions put immense strain on your operations team. Think inefficient schedules, expensive last-minute shipping, and a whole lot of unnecessary stress.
- Eroded Trust: When finance and operations are working from completely different numbers, it’s impossible to align on strategy. This misalignment undermines confident decision-making across the board.
Moving from guesswork to a data-informed forecasting model isn't just a nice-to-have; it's non-negotiable for sustainable growth. Calculating your forecast accuracy is the first critical step toward taking back control and making decisions that actually drive your business forward.
Understanding Your Core Accuracy Metrics
Diving into forecast accuracy metrics doesn't have to feel like a stats exam. Let's break down the essentials in plain English, focusing on what they actually reveal about your business operations. Once you get past the jargon, you can confidently pick the right tool for the job.
Think of these metrics as different lenses. Each one tells a slightly different story about your forecast's performance, and the one you choose depends on the question you're trying to answer. To get a solid handle on what drives business performance, this guide on SaaS KPIs: Your Complete Guide to Growth-Driving Metrics is a fantastic resource.
MAPE: The High-Level Benchmark
One of the most common metrics is Mean Absolute Percentage Error (MAPE). It’s popular for a reason: it gives you your average error as a simple percentage.
Because it's a relative measure, MAPE is perfect for high-level conversations. You can use it to compare the accuracy of wildly different products—say, a £5 gadget versus a £500 piece of equipment—on an even playing field. Many businesses aim for a MAPE below 10%, as it’s an intuitive number for stakeholders to grasp.
But MAPE has a blind spot. It can be misleading when you're dealing with low-volume sales. If you forecast one unit and sell two, that's a 100% error. On paper, that sounds disastrous, but in reality, the financial impact might be tiny.
MAE and RMSE: The Operational View
This is where Mean Absolute Error (MAE) and Root Mean Squared Error (RMSE) come in. Unlike MAPE, these metrics express error in the same units you're forecasting—like dollars, kilos, or pallets.
-
Mean Absolute Error (MAE) gives you the average size of your error in concrete terms. If your MAE for a product is 20 units, it means you are, on average, off by 20 units each month. This is incredibly practical for inventory planning and understanding the real-world cost of being wrong.
-
Root Mean Squared Error (RMSE) is a lot like MAE but with a crucial twist: it punishes larger errors more severely. Because it squares the errors before averaging them, a single massive forecasting miss will blow up your RMSE score. This makes it the go-to metric when large forecast errors are especially costly, like with high-value items or critical components you absolutely cannot run out of.

Comparing Key Forecast Accuracy Metrics
To make it even clearer, here's a quick cheat sheet breaking down what each metric is best for.
| Metric | What It Measures | Best For | Key Consideration |
|---|---|---|---|
| MAPE | Average error as a percentage | High-level reporting and comparing forecasts for different items | Can be skewed by low-volume products and doesn't show the magnitude of the error. |
| MAE | Average absolute error in units | Operational planning, like inventory and staffing | Treats all errors equally, whether they are small or large. |
| RMSE | Square root of the average of squared errors | Situations where large errors are disproportionately costly | More sensitive to outliers than MAE, so a few big misses will have a large impact. |
Ultimately, picking the right metric helps you focus on what really matters for your business.
Your goal isn't just to calculate a number but to understand the story it tells. Are small, consistent errors bleeding you dry, or are occasional large misses causing major operational headaches? Using the right metric helps you pinpoint the problem.
Choosing the right metric is the first step. The real value comes from turning that score into a strategy. If you're ready to start closing the gap, our consultants can help you build the right models.
A Practical Guide to Calculating Accuracy
Knowing the theory is one thing, but putting these metrics to work is what separates growing businesses from stagnant ones. Let's walk through a practical, hands-on example to bring order to your spreadsheets and show you exactly how to calculate forecast accuracy.
Imagine you run an e-commerce brand, and your top-selling product is a handcrafted coffee mug. You need to forecast weekly demand to keep your inventory in that sweet spot—not too much, not too little.
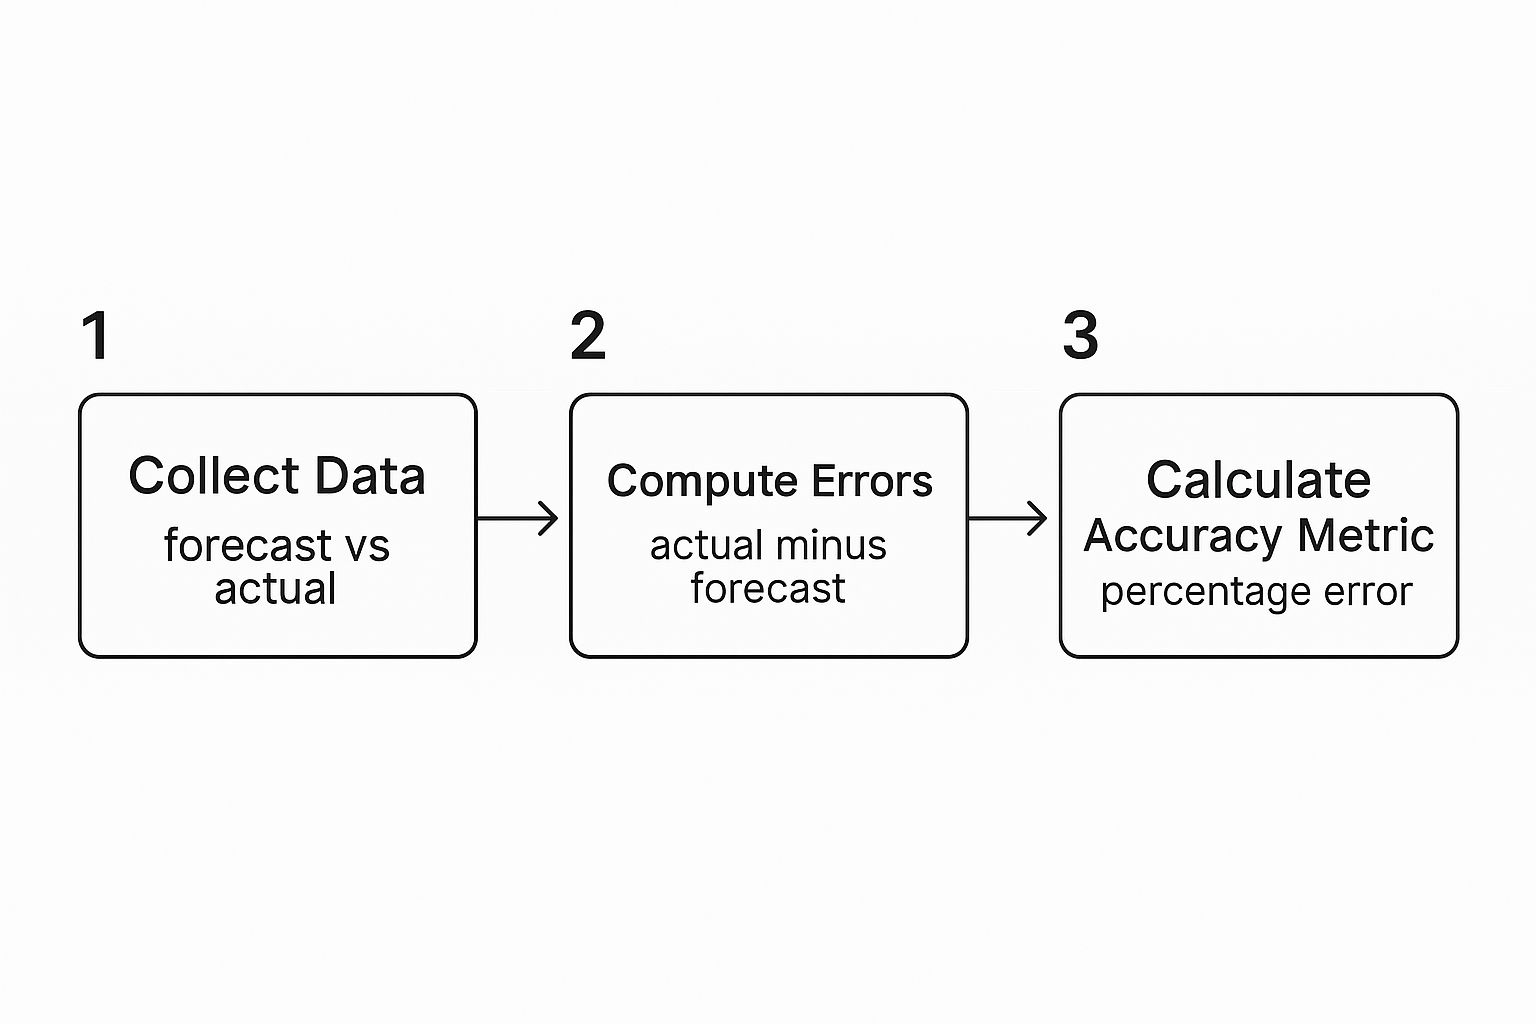
This workflow shows a clear path from raw data to a meaningful accuracy score, a process that starts to strip the guesswork out of your operations.
A Worked Example Step-by-Step
Let's say over four weeks, your forecast and actual sales for the coffee mug looked like this:
- Week 1: You forecasted 100 units but actually sold 90. The error is -10 units.
- Week 2: You forecasted 110 units and sold 115. The error is +5 units.
- Week 3: You forecasted 95 units and sold 105. The error is +10 units.
- Week 4: You forecasted 120 units and sold 110. The error is -10 units.
The first thing to do is calculate the Absolute Error for each week. This just means ignoring the negative signs. Why? Because if you don't, the positive and negative errors can cancel each other out, making your forecast look way more accurate than it really is.
Calculating Your Accuracy Score
To get your Mean Absolute Error (MAE), you average those absolute errors: (10 + 5 + 10 + 10) / 4 = 8.75 units. This tells you that, on average, your weekly forecast is off by about 9 mugs. That’s a real, tangible number you can use for buffer stock calculations.
Another crucial metric is forecast bias, which shows if you’re consistently over- or under-forecasting. To find this, you add up the original errors (with the +/- signs): (-10 + 5 + 10 – 10) = -5. A negative result means you have a slight tendency to over-forecast. Uncovering this kind of systemic issue is gold for refining your purchasing.
Key Takeaway: The goal isn’t just to land on a single number. It’s to understand the story behind it—the financial hit of your average error (MAE) and the direction of your misses (bias).
For a deeper dive into the methodologies behind effective business predictions, you might want to explore these key sales forecasting techniques.
Ultimately, having the right tools makes a huge difference. The right financial forecasting software for small business can automate all of these calculations, freeing you up to focus on what the numbers actually mean.
Turning Your Accuracy Score into Action
So you've done the math and landed on a number—let's say your MAPE is 15%. What now? A metric on a dashboard is just a number. The real magic happens when you turn that score into smart business decisions.
First, a "good" accuracy level is relative. An e-commerce business wrestling with volatile seasonal items might be thrilled with 85% accuracy (15% MAPE). A company with stable, predictable demand should be shooting for 95% or higher. Your initial goal isn't to hit an arbitrary benchmark; it's to establish your own baseline and improve from there.

Go Beyond the Blended Score
Relying on a single, overall accuracy score is a classic mistake. Your blended 85% accuracy might look solid on the surface, but it could be masking a huge problem.
For example, you might have one volatile product category that's bleeding resources, but the stellar performance of your bestsellers is propping up the average and hiding the issue.
This is why segmenting your analysis is critical. Break down your accuracy by different dimensions:
- Product Category or SKU: Are certain items always harder to predict? This is a red flag. It might mean you need a different forecasting model or a more agile inventory strategy for that group.
- Location or Region: Is a particular sales territory all over the place? This could point to local market shifts, new competitors, or issues with a specific sales team.
- Time Period: Did your accuracy tank last quarter? Digging into what changed—a new marketing campaign, a competitor's promotion—is how you learn and adapt.
By slicing and dicing the data, you stop looking at a vague score and start making a specific diagnosis. This is the foundation of genuine data-driven decision-making.
The goal isn't just to calculate a score; it's to constantly ask "why?" Why is this SKU so inaccurate? Why did last month's forecast miss the mark so badly? Finding the answers is how you build a more resilient, efficient business.
To make sure your analysis is solid, it's vital to test your forecasting model on data it has never seen before. A common best practice is to hold back the most recent data as a validation set. This gives you an unbiased, real-world measure of how the model will likely perform.
As extensive research shows, the specific metric you choose—like MAE versus MAPE—can drastically change which forecast appears to be the most accurate. This just underscores the need for careful, consistent validation. You can discover more about forecasting evaluation methods to really dial in your approach.
From Manual Spreadsheets to Automated Insights
Calculating forecast accuracy in Excel is a great starting point. It gets you familiar with the data and the basic mechanics. But as your business grows, you quickly hit a wall.
Manual calculations are slow, tedious, and dangerously prone to copy-paste errors that can silently corrupt your entire analysis. Sound familiar?
This is where modern business intelligence (BI) tools like Power BI become a game-changer. They bridge the gap between static, error-prone spreadsheets and a dynamic, automated reporting system you can actually trust.
Moving Beyond Manual Reporting
The journey from manual spreadsheets to automated insights is a critical step for scaling smart, and it’s a core part of mastering data analysis and business intelligence. Instead of burning hours exporting data and updating formulas, you can build a system that does the heavy lifting for you.
At Vizule, we specialise in helping founders connect their disparate data sources—like your CRM, inventory system, and accounting software—into a single, unified Power BI model. This creates one central place for all your operational and financial data.
Imagine a dashboard where your forecast accuracy metrics update automatically. You could spot trends, drill down into problem product lines, and compare different forecast models with just a click, finally aligning finance and ops.
This isn’t just about saving time on reporting. It's about creating a single source of truth that empowers your entire team to make smarter, faster decisions. You move from reacting to historical reports to proactively managing your business performance.
Want to automate your reporting and finally trust your data? Book your free BI consultation to see how we can design a reporting system that scales with your business.
Common Questions About Forecast Accuracy
Once you start digging into the metrics, practical questions always follow. Let's tackle some of the most common ones we hear from business owners trying to put forecast accuracy into practice.
What Is a Good Forecast Accuracy Percentage?
This is the million-dollar question, and the honest answer is: it depends. While a common target across many industries is 85-95% accuracy (which translates to a MAPE of 5-15%), that number can be misleading.
If you're selling a product with rock-solid, predictable demand, you should be aiming for 95% or even higher. But for a brand-new product launch or items with wild, seasonal swings? Hitting 70% might be a huge win to start.
The real goal isn't hitting some arbitrary number. It’s about establishing your current baseline and then consistently improving it. Even a small 5% improvement in accuracy can have a massive impact on your bottom line.
How Often Should I Calculate It?
The right cadence hinges on your business cycle.
For a fast-moving e-commerce brand, tracking accuracy weekly is probably essential to stay nimble. On the other hand, a B2B company with a six-month sales cycle might find a monthly or even quarterly review far more insightful.
The most important thing is being consistent. When you automate this calculation in a tool like Power BI, the manual work disappears. That frees you up to monitor performance as frequently as you need to without getting bogged down in spreadsheets.
My Forecast Is Consistently Wrong. What Should I Fix First?
When your forecast is always off, the first step is to diagnose your forecast bias. Are you constantly over-forecasting (too optimistic) or under-forecasting (too cautious)? A consistent pattern usually points to a systemic flaw in your core assumptions, not just random noise.
Once you know your bias, start segmenting your analysis. Don't just look at the total number. Is the inaccuracy coming from one specific product line? A single sales channel? A particular region?
More often than not, the problem traces back to foundational issues like poor data quality or a forecasting model that's too simple. If your model isn't accounting for key business drivers like seasonality or marketing promotions, it's never going to be reliable. Fix those fundamentals first, and you'll often see rapid improvements.
Tired of wrestling with spreadsheets to get these answers? The team at Vizule helps founders automate their financial and operational reporting in Power BI, turning data chaos into clear, actionable insights. Book your free BI consultation today to see how we can help you build a forecast you can finally trust.


