


Are you trapped in a never-ending cycle of manual reporting? For many small business owners and startup founders, this is a daily reality. You're drowning in a sea of disjointed spreadsheets, trying to piece together a clear picture of your business from scattered sales reports, marketing analytics, and financial statements. It's a huge time sink, and worse, it keeps you looking backwards.
This constant struggle creates a massive bottleneck. By the time you’ve manually wrestled everything into a single report, the data is already out of date. You end up making critical decisions based on what happened last month, not what's happening right now. It's like trying to drive forward while only looking in the rearview mirror.
This is where self-service analytics comes in. Think of it as swapping that rearview mirror for a live, interactive GPS for your entire business. It's not another complex tech buzzword; it's a practical approach that puts the power of data directly into the hands of the people who need it most—your commercial teams.
Instead of your team queueing up and waiting for a data specialist to build them a report, self-service analytics lets them find their own answers. This is a game-changer. It means your sales, marketing, and operations teams can explore company data on their own terms, using intuitive tools like Power BI.
Self-service analytics transforms your team from passive data consumers into active problem-solvers who can ask questions and find answers on their own. This shift is fundamental to building a truly data-driven culture.
This move away from outdated, clunky reporting is becoming the standard for smart businesses. The global self-service analytics market was valued at around USD 6.07 billion and is expected to hit an impressive USD 9.97 billion by 2033. This explosive growth shows just how many businesses are ditching old processes for a more agile way of working. You can discover more about these market projections and their impact.
Why Self-Service Analytics is a Game-Changer for SMBs
So, what do you actually get when you bring self-service analytics into your business? Forget the jargon. This isn't just about bolting on new software; it's about fundamentally changing how your team operates, making your business faster, smarter, and more competitive.
The real magic happens when your team can find answers and act on them without waiting around.
Think about your marketing manager. Instead of waiting weeks for a report to see how a new campaign is performing, they can pull up an interactive dashboard. Right now, they can see which ads are driving profitable customers and which are falling flat. They can shift the budget in real-time to back the winners. That’s the kind of agile decision-making that separates good businesses from great ones.

This move toward accessible data is happening fast. The self-service analytics market has been booming, with a compound annual growth rate of 15.5%. This isn't just a trend; businesses, especially in fast-moving sectors like retail and finance, are jumping on board because quick, data-backed decisions are essential to survive and thrive. You can read more about the rapid growth in this market.
Accelerate Your Decision-Making Speed
The first and most powerful benefit is pure speed. Traditional reporting is painfully slow. By the time a monthly report lands on your desk, the opportunities it highlights may have already passed. Self-service tools shrink that time lag from weeks to minutes, pushing your business much closer to real-time operations.
Imagine an operations lead managing your supply chain. Instead of getting a static report on Friday flagging a potential stockout, they spot inventory levels dipping on a live dashboard on Tuesday. This early warning lets them place a new order immediately, heading off a costly disruption before it ever impacts a single customer. This is how you stop fighting fires and start preventing them.
When your team has the power to ask and answer their own questions with data, you cultivate a culture of ownership. Decisions are no longer bottlenecked by a single person or department; they are made at the speed of business.
Boost Data Literacy Across Your Company
When data tools are easy to use and available to everyone, something incredible happens: people get comfortable with data. Team members who once avoided numbers start to confidently use data to back up their ideas and plans. This upskilling across the entire company is a huge long-term win.
- Empowered Conversations: Meetings become far more productive. Instead of debates based on gut feelings, conversations are anchored in shared data, leading to quicker alignment and better decisions.
- Reduced Burden on Experts: Your finance gurus or data analysts are freed from the drudgery of cranking out one-off reports. They can finally focus on high-value strategic work, like financial modelling or deep-dive analysis.
- A Culture of Inquiry: People naturally start asking smarter questions. When they know the answers are just a few clicks away, they become more curious and analytical, always on the lookout for ways to improve their corner of the business.
This cultural shift is essential for building a resilient company. Our guide on data-driven decision-making for SMBs dives deeper into how to bake this thinking into your company's DNA.
By putting powerful tools like Power BI directly into the hands of your commercial teams, you’re doing more than just automating reports. You're building a smarter, more agile, and more aligned organisation—one that's ready to scale.
Building Your Self-Service Analytics Ecosystem
So, what does a successful self-service analytics setup actually look like for a small or medium-sized business? It’s easy to get the impression that this is reserved for massive companies with huge IT departments. The reality? Building a powerful and accessible ecosystem is more achievable than you might think.
It’s not about buying a dozen complicated tools; it’s about putting a solid foundation in place, built on three core pillars. This foundation is what gives your team the confidence to dig into data and find real answers.
The infographic below breaks down the essential flow of any self-service analytics process.
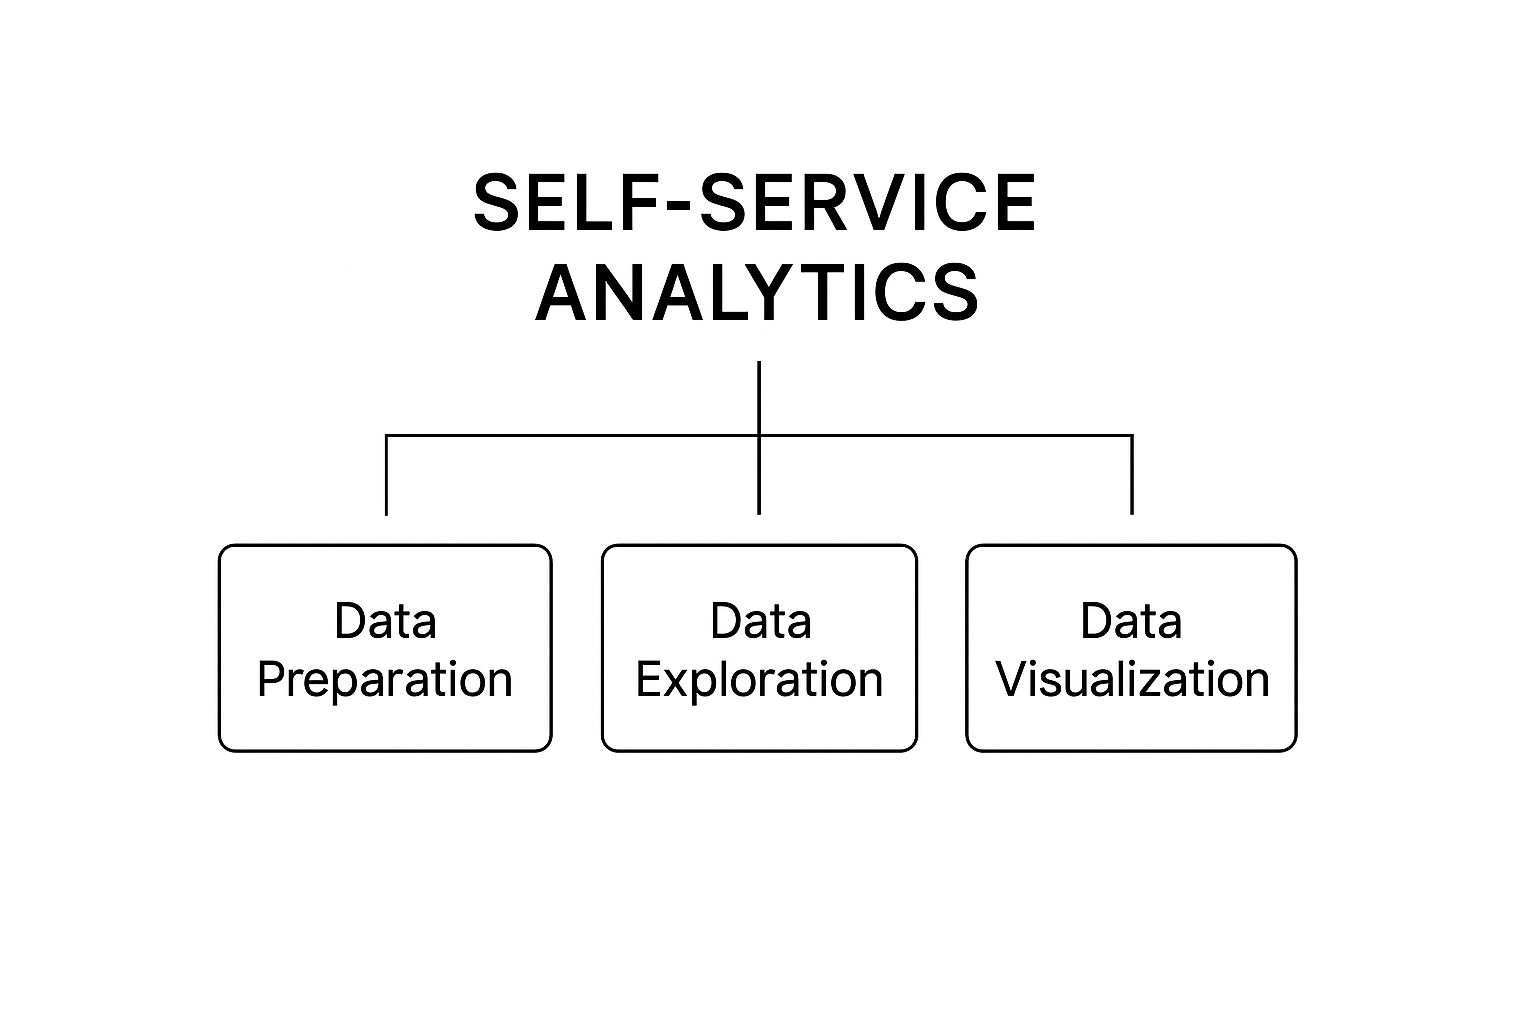
As you can see, a great result is more than just pretty charts. It all starts with solid data preparation and allows for genuine exploration before insights are visualized.
The Right Tools for the Job
The first pillar is simple: give your team tools they will actually use. For your non-technical people, this means steering clear of complex software that demands coding skills. The goal here is empowerment, not intimidation.
Modern business intelligence platforms like Power BI are designed exactly for this. They feature intuitive, drag-and-drop interfaces that let a commercial user—like your sales manager or head of operations—build their own reports without writing a single line of code. Think of it like building with digital Lego bricks; users can pick the metrics they need, choose a chart type, and assemble a dashboard that answers their specific questions.
The best tool is one that feels less like a technical hurdle and more like a natural extension of your team's curiosity. It should invite exploration, not create another reason to call for technical support.
Choosing the right platform is the first step in making self-service analytics a practical reality in your business, turning data from a headache into a real advantage.
A Single Source of Truth
The second, and arguably most critical, pillar is creating a single source of truth. It’s a common buzzword, but for an SMB, it means finally breaking down the data silos that prevent you from having a clear, unified picture of your business.
Right now, your financial data probably lives in QuickBooks, your sales data is in a CRM, and your marketing metrics are siloed in yet another platform. A single source of truth doesn’t magically merge these apps. Instead, it involves building a unified data model that connects them all behind the scenes.
This central model acts as a reliable hub. When your marketing manager pulls a report on customer acquisition cost, they are using the same approved sales and finance data as everyone else. This puts an end to those painful meetings where different teams argue over whose numbers are "correct."
To understand the shift, it helps to compare the old way of doing things with the modern approach.
Traditional Reporting vs Self-Service Analytics
| Aspect | Traditional Reporting (The Old Way) | Self-Service Analytics (The Modern Way) |
|---|---|---|
| Process | Business user submits a ticket to IT/analyst team. | Business user directly accesses and explores data via a user-friendly tool. |
| Timeline | Days or weeks to get a report back. Follow-up questions restart the cycle. | Insights are generated in minutes or hours. Follow-up questions answered instantly. |
| Expertise Required | Relies on a few technical specialists (data analysts, IT). | Empowers non-technical users (sales, marketing, ops) to find their own answers. |
| Output | Static, pre-defined reports (PDFs, spreadsheets). | Interactive, dynamic dashboards that allow for deep-dives and filtering. |
| Business Impact | Slows down decision-making, creates bottlenecks. | Accelerates decision-making, fosters a proactive and data-literate culture. |
This table really highlights the fundamental difference: moving from a slow, gatekept process to one that’s fast, agile, and puts the power directly into the hands of the people who need it most.
Smart Governance as Guardrails
The final pillar is a smart governance framework. Now, the word "governance" can sound restrictive, but it's much better to think of it as the essential guardrails on your data highway. These guardrails don't stop your team from exploring; they give them the confidence to do it safely.
Effective governance makes sure that:
- Data Accuracy: Rules are set to keep calculations (like profit margin or customer lifetime value) consistent across every single report.
- Security and Access: Team members only see the data that’s relevant to their roles, which protects sensitive information without blocking access to necessary insights.
- Clarity and Trust: Everyone knows exactly where the data comes from and can trust the numbers they see in their dashboards.
Without these guardrails, self-service analytics can quickly spiral into chaos, leading to conflicting reports and bad decisions. A partner like Vizule helps design this framework from the ground up, ensuring your data is not just accessible but also accurate and secure.
Building these three pillars—the right tools, a single source of truth, and smart governance—creates the reliable foundation your business needs to grow.
Want to design a trusted self-service analytics ecosystem for your business? Book a free call with our BI consultants today.
How SMBs Win with Self-Service Analytics
Alright, let's move beyond the buzzwords and see what this actually looks like on the ground. For small and medium-sized businesses, the real magic of self-service analytics isn’t in some complex technical diagram—it’s in solving the real, everyday headaches that slow your team down.
The shift is profound. Think about your finance lead. Before, they might have spent the first week of every month painstakingly exporting data from different systems, wrestling it all into a single, clunky Excel file. Now? They just open a real-time financial performance dashboard in Power BI.

This isn’t just a static report. It’s a dynamic, interactive workspace. They can instantly drill down into cash flow, check profitability against forecasts, and monitor revenue streams by the day, not just by the month. All that time they get back is now spent on actual strategy, not just copying and pasting.
Sales and Marketing Unlocking Growth
Now, picture your sales and marketing teams. Historically, they often operate in their own worlds. Marketing generates leads, and sales reports back on what closed weeks later. That disconnect makes it almost impossible to know which campaigns are actually driving profitable growth.
With a shared self-service dashboard, that changes overnight. The marketing manager can now independently track customer acquisition costs (CAC) and conversion rates for every single campaign, in real time. They see which channels are bringing in high-value customers and can shift their budget accordingly, without waiting for someone else to pull a report.
This is what unlocking data-driven growth really means for SMBs: arming your commercial teams with the direct ability to see what’s working, what isn’t, and why—and empowering them to act on it immediately.
Meanwhile, the sales team can filter that same dashboard to see lead quality by source, helping them focus their energy where it actually pays off. The conversation immediately shifts from "Are these leads any good?" to "How do we get more high-converting leads just like these?"
Operational Efficiency in Real Time
Let’s hit one more common scenario: operations. For an ops manager at a growing e-commerce brand, managing inventory and customer support used to be a constant guessing game. They were flying blind, relying on outdated stock reports and weekly ticket summaries.
Now, with a self-service analytics setup, they have a live view of the metrics that matter.
- Inventory Levels: They can monitor stock levels for every product instantly and even get automated alerts when something is running low. This simple, proactive step prevents costly stockouts and keeps sales flowing.
- Customer Support Metrics: Instead of waiting for a weekly recap, they can see daily trends in support ticket volume, resolution times, and customer satisfaction scores. This means they can spot and fix issues before they blow up.
In each of these scenarios, the pattern is identical. The "before" is a world of manual Excel work, data silos, and reactive decisions based on old news. The "after" is an environment of automation, shared insights, and proactive strategy driven by live, interactive dashboards.
This is how you win—by turning data from a burden into your sharpest competitive edge. You can learn more by checking out our small business secrets for scaling smart.
Want to automate your reporting and finally trust your data? Book a free discovery call with our BI consultants today.
Your Roadmap to Implementing Self-Service Analytics
Jumping into self-service analytics can feel like a massive undertaking, but it doesn't have to be. For a founder or operator, the path forward needs to be clear, manageable, and focused on results—not on getting lost in a complex technical project. The key is to see this not as a single, giant leap but as a series of deliberate, value-driven steps.
This phased approach turns a potentially overwhelming transformation into an achievable process. It’s a roadmap designed for business leaders who need tangible outcomes, not technical headaches. By following a structured path, you can build momentum, prove the value early, and scale your efforts intelligently.
The goal isn't to boil the ocean. It's to solve a real, pressing business problem and then expand from there.
Phase 1: Start Small and Prove the Value
The most effective way to begin is by focusing on one high-impact business problem. Don't try to build a system that answers every possible question at once. Instead, pick a specific area where better, faster data would make an immediate difference.
What's your biggest blind spot right now?
- Is it understanding your true customer acquisition cost?
- Do you lack real-time visibility into your cash flow?
- Are you struggling to track sales performance against targets?
Pick one. By starting with a single, painful problem, you create a clear finish line for your first project. This makes it easier to measure success and build a compelling case for further investment when your team sees the powerful results from this initial pilot.
Phase 2: Consolidate Your Key Data
Once you’ve identified the problem, the next step is to gather the data needed to solve it. For most SMBs, this information is scattered. Your financial data lives in QuickBooks, your sales activity is in a CRM like HubSpot, and your marketing metrics are siloed in Google Analytics or social media platforms.
The goal here isn’t to manually merge spreadsheets. It’s to identify these core data sources so they can be connected in a central place. A partner like Vizule helps you pinpoint exactly what data you need and designs a system to pull it all together automatically, creating a solid foundation for your analytics.
Tackling self-service analytics is quickly becoming a core part of business strategy, not just an IT project. The market is projected to skyrocket to USD 13.81 billion, growing at a remarkable annual rate of 18.8%. This rapid acceleration shows that organizations worldwide see user-friendly analytics as essential for growth. Read more about the future of self-service analytics and its strategic importance.
Phase 3: Build Your First Dashboard and Train a Pilot Team
With your data sources identified, it's time to build your first interactive dashboard in a platform like Power BI. This initial dashboard should be hyper-focused on solving the single problem you chose in Phase 1. It must be clean, intuitive, and directly answer the core questions of your pilot team.
Who is your pilot team? It should be a small group of end-users—perhaps a couple of salespeople or a marketing manager—who will actually use the dashboard. Provide them with hands-on training focused on how to use this specific tool to do their jobs better.
Their feedback is gold. This agile approach allows you to make quick adjustments based on what they find useful and what they don't, ensuring the final product is genuinely valuable. Building a solid foundation is crucial, and our detailed guide to crafting a modern data analytics strategy can help you map out these critical first steps.
Phase 4: Gather Feedback and Scale Success
After the pilot team has used the dashboard for a few weeks, gather their feedback. What decisions did it help them make? What new questions did it spark? Use these insights to refine the dashboard and plan your next move.
The success of this first small project creates the perfect business case to scale your efforts. You can now move on to the next high-impact problem, connecting new data sources and building out more dashboards for other teams. This iterative process—build, test, learn, expand—is the most sustainable way for an SMB to adopt self service analytics. It ensures every step delivers real value and builds a data-driven culture from the ground up.
Want to map out your own implementation journey? See how Vizule can help automate your reporting stack.
Your Self-Service Analytics Questions, Answered
Jumping into business intelligence can feel like a huge step, especially when you're already juggling the day-to-day demands of running your business. It's normal to have questions. As a founder or operator, you need to be sure any new system will add real value, not just more complexity.
So, let's tackle the most common questions we hear from business leaders head-on. Our goal is to give you clear, straight-up answers so you can decide what's right for your business with confidence.
Is This Too Expensive or Complex for My Small Business?
This is usually the first question, and for good reason. Many people hear "business intelligence" and immediately picture a massive, enterprise-level project with a price tag to match. The reality today is much more accessible.
Modern tools like Power BI are built to be incredibly scalable. You don't need a huge upfront investment; you can get started with a license that costs less per month than taking your team out for lunch. The real cost you should be thinking about is the cost of not having clear insights. How many hours are you and your team burning on manual reporting every week? What's the cost of one bad decision made because you were looking at old data?
The true ROI of self-service analytics isn't just about saving time on reporting. It's about the value you unlock by making smarter, faster decisions that fuel growth, cut waste, and reveal opportunities you might otherwise miss.
A properly designed self-service analytics system pays for itself quickly. The efficiency gains are a great start, but the ability to act on what's happening right now is what truly changes the game for a growing business.
How Do I Stop My Team from Misusing the Data?
This is another big one. You want to empower your team, but the last thing you need is data chaos, with everyone pulling different numbers and arriving at conflicting conclusions. This is exactly where a well-designed data model and solid governance come into play—and frankly, this is our bread and butter at Vizule.
Think of it this way: just giving your team access to raw data is like handing them a dictionary and asking them to write a novel. A well-built system, however, is like giving them a structured outline and an approved cast of characters.
- A Solid Data Model: We build a central model where key metrics (like 'profit margin' or 'customer lifetime value') are defined just once and used the same way everywhere. No more arguments about whose "revenue" number is correct.
- Built-in Guardrails: Governance isn't about locking things down; it's about putting up smart guardrails. We establish rules so people only see the data relevant to their role, keeping sensitive information secure.
- Clear Definitions: Every metric is clearly defined, so there's zero ambiguity. When someone looks at "Net Revenue," they know exactly what's included and what isn't.
These guardrails give your team the freedom to explore data with confidence. They can ask their own questions and build their own reports, all while working from a single, reliable source of truth.
Our Data Is Everywhere. Can This Really Connect It All?
Yes, absolutely. This is one of the foundational strengths of modern BI. It's a classic headache for SMBs: your financials are in QuickBooks, sales data is in your CRM, and marketing numbers are scattered across a dozen platforms. Trying to bring it all together in Excel feels impossible.
Modern BI platforms were built specifically to fix this. They come with pre-built connectors to pull data from hundreds of different sources, from simple spreadsheets to complex cloud databases.
But just plugging in the pipes isn't the whole story. The real magic comes from building a cohesive "single source of truth," and this is where an expert partner can save you months of frustration. We don't just connect your data; we structure it. We build the logical bridges between your sales activities and your financial outcomes, creating a unified view that tells the complete story of your business.
Ready to connect the dots in your data and build a reporting system you can finally trust? The team at Vizule is here to help.


