


For most founders and operators, the term 'data analytics' probably brings back bad memories of wrestling with disconnected spreadsheets and chasing down reports that are already out of date. It feels less like a strategy and more like a constant, reactive battle against information chaos. But what if your data could answer your most critical business questions, automatically?
Strategic data analytics isn't an overly complex technical process. Think of it as a practical business framework designed to connect the dots in your data. It cuts through the noise of Excel chaos and siloed systems, turning your raw numbers from tools like Xero, HubSpot, and Shopify into a clear, unified view of your company's performance, helping you scale smarter.
From Data Chaos to Strategic Clarity

Does your week involve more time exporting data and copy-pasting it into Excel than actually figuring out what it all means? This is an incredibly common frustration, especially for growing businesses. Critical data gets trapped in different platforms—your CRM, your accounting software, your operational tools—making a single, reliable view of performance feel like a pipe dream.
This manual grind doesn't just eat up valuable time; it creates a dangerous lag between something happening in the business and you having the insight to act on it. Decisions end up being made on gut feelings or incomplete, month-old data. This is the definition of reactive firefighting, and it's a massive barrier to smart, scalable growth.
The Problem with Manual Reporting
The core issue here is that traditional, manual reporting only tells you what has already happened. It’s a historical record, and one that's often pieced together too late to actually influence the outcome. You might spend the first week of every month just trying to understand last month's performance, leaving zero time for forward-looking strategy.
Strategic data analytics flips this entire model on its head. It’s all about creating an automated, forward-looking system that connects the dots between your sales, operations, and finance data automatically. This approach gives you a single source of truth, moving you from reacting to yesterday's problems to proactively shaping tomorrow's success.
The goal is simple: Transform raw numbers into a cohesive narrative that guides your next move. It’s about answering not just "What happened?" but "Why did it happen, and what should we do next?"
The shift from manual chaos to strategic clarity is a stark one. One path is littered with frustration and uncertainty, while the other is built on confidence and real insight. To put it plainly, here’s what that transformation looks like for most businesses.
Shifting From Manual Reporting to Strategic Analytics
This table highlights the jump from the all-too-common frustrations of old-school data wrangling to the solutions a modern, strategic approach provides. For any SMB owner or operator, the difference is night and day.
| Common Frustration (The 'Before') | Strategic Solution (The 'After') |
|---|---|
| Reports are manually compiled and always out of date. | Dashboards update automatically in near real-time. |
| Data is siloed in different tools (e.g., Xero, HubSpot, Excel). | A unified "single source of truth" connects all data. |
| Decisions are based on guesswork or incomplete information. | Decisions are driven by reliable, complete insights. |
| Hours are wasted each week on copy-pasting data. | Reporting is automated, freeing up time for analysis. |
| You can't trust the accuracy of your numbers. | Data is cleaned and validated, creating trusted metrics. |
The bottom line is that moving to a strategic analytics framework replaces tedious, low-value work with high-impact, forward-looking analysis.
Ready to stop wrestling with spreadsheets and start making insight-led decisions? Book your free BI consultation, and let our experts show you how to build a clear, automated reporting stack that drives your business forward.
What Strategic Data Analytics Actually Means

Let's cut through the jargon. For most business leaders, "data analytics" can feel like a vague, academic term. But strategic data analytics is something different entirely. It's practical and forward-looking.
Think of it this way: traditional business reporting is like your car's rearview mirror. It’s great for seeing where you’ve just been, but it tells you nothing about the road ahead. Strategic analytics is the GPS on your dashboard. It not only shows your current position but maps out the best route to your destination, anticipates traffic jams (market shifts), and finds shortcuts (new opportunities) to get you there faster and more efficiently.
Going Beyond Basic Reporting
At its heart, strategic data analytics is all about asking—and definitively answering—your most critical business questions with data you can actually trust. It's the jump from descriptive analytics ("What happened last quarter?") to the far more powerful realms of diagnostic and predictive analytics ("Why did that happen, and what's next?").
For any founder or operator, this is the key to escaping spreadsheet chaos and finally getting clear answers to questions like:
- Which of our products are truly the most profitable once every single cost is factored in?
- What is our real customer lifetime value, and which marketing channels bring in the customers who stick around?
- Where are the hidden bottlenecks in our operations that are quietly draining time and money?
Trying to answer these without a unified view of your business is next to impossible. You're just guessing.
The Three Pillars of Strategic Analytics
Getting to this point isn't magic; it's a structured approach built on three pillars. The first step is to connect all your disparate data sources—your CRM, accounting software, operational tools, you name it—into a single, reliable hub. This is the foundation for everything.
Strategic data analytics is less about having 'big data' and more about having the right data, cleaned and connected to answer your most important questions. It transforms numbers into a narrative that guides your next decision.
Once your data is in one place, the real work begins. Raw, messy numbers are cleaned, validated, and moulded into consistent, reliable metrics. This is the crucial stage where you forge a single source of truth—a definitive set of numbers that everyone, from finance to sales, can agree on. This step alone can eliminate countless hours of debate over whose spreadsheet is correct.
Finally, with a trusted data model in place, you bring it to life. Using powerful tools like Power BI, the insights are visualized through interactive dashboards that anyone can understand and explore. Instead of a static PDF report that’s outdated the moment it's sent, you get a dynamic model. You can drill down into the details, filter by different segments, and see the real-time impact of your decisions.
Our Approach: A 3-Step Framework for SMBs
Knowing you need a better data strategy is one thing. Actually building one is another beast entirely. For busy founders and operators, the whole process can feel overwhelming, complex, and way too expensive.
This is where a clear, repeatable framework comes in. It’s not about boiling the ocean. It's about having a proven, step-by-step approach to turn data chaos into actionable clarity.
At Vizule, we use a simple but incredibly effective three-stage framework: Map, Model, and Mobilise. We designed this process specifically for small and medium-sized businesses to get from theory to practice quickly, focusing on real-world results instead of getting bogged down in technical details. It’s a reliable roadmap for any strategic data initiative.
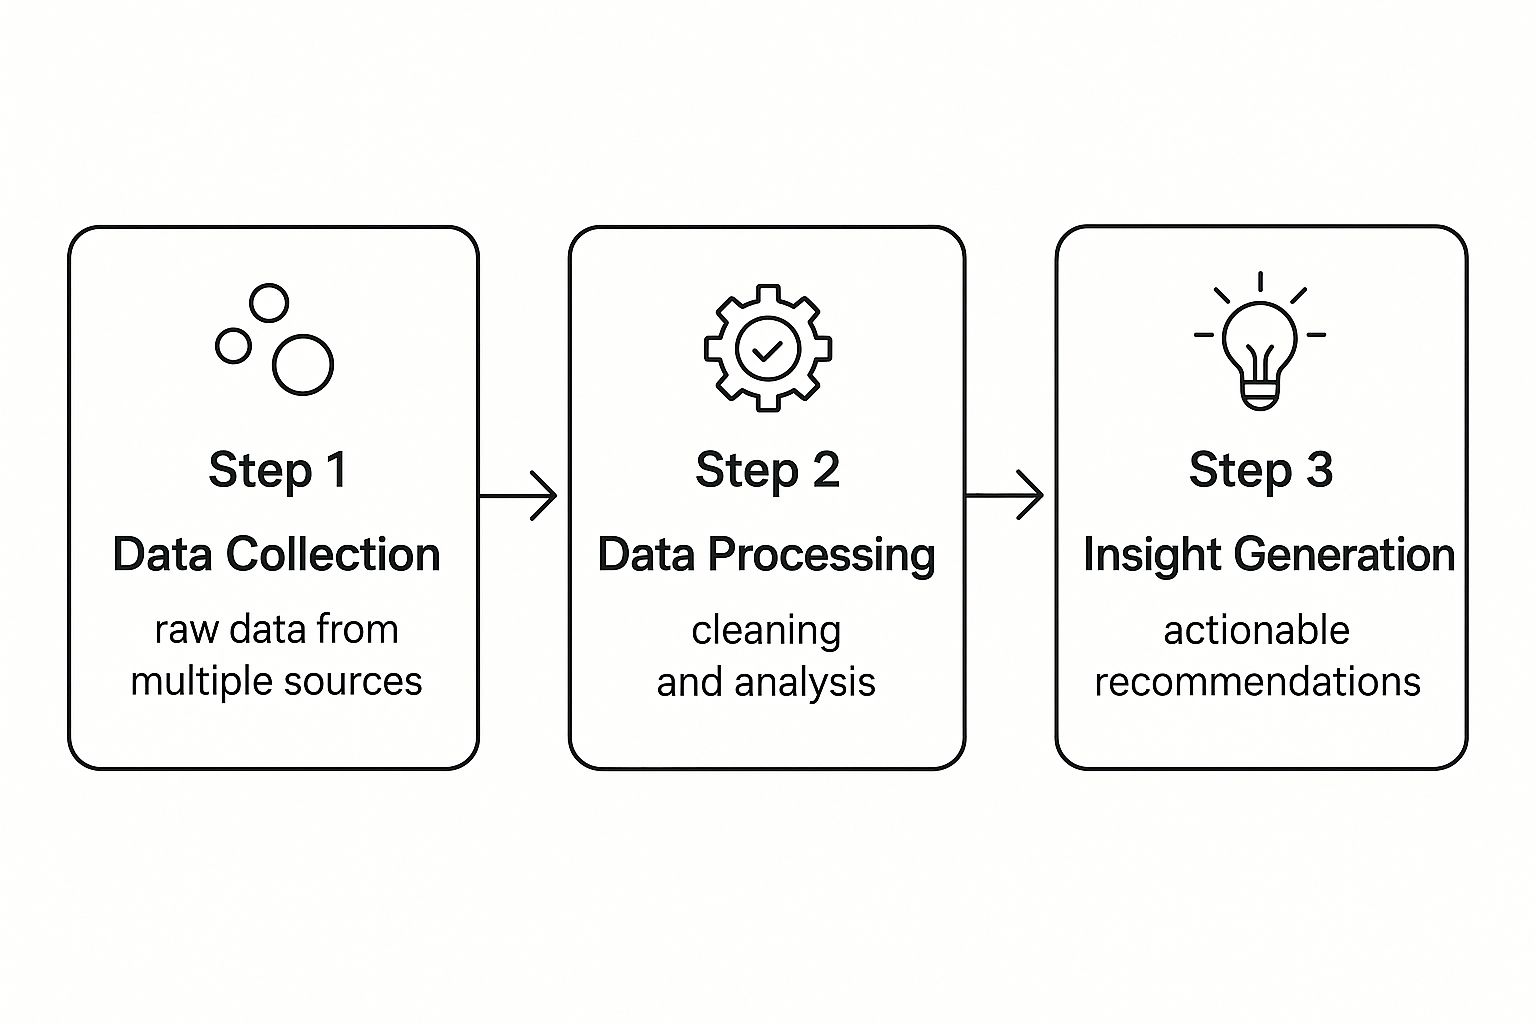
This flow chart shows how we get from raw, disconnected data to the kind of insights that actually drive your business forward. As you can see, it's a sequential process. We take messy data from multiple sources, clean it up into a unified structure, and then use it to deliver clear recommendations.
Stage 1: Map Your Business Questions and Data
The first stage, Map, has almost nothing to do with technology. It’s all about business strategy.
We start by zeroing in on your most critical, high-impact business questions. This isn't some vague "we want to grow" exercise; we get specific.
For an e-commerce brand, that might mean asking:
- What is our true, all-in product profitability after we factor in shipping, returns, and ad spend?
- Which marketing channels are bringing in customers with the highest lifetime value, not just the cheapest initial acquisition?
- How does our inventory turnover for Product A impact the cash flow for the entire business?
Answering these questions becomes the blueprint for the entire project. Once we know what we need to figure out, we can identify where the data lives. This usually involves mapping information across your accounting software (like Xero), your CRM (like HubSpot), your e-commerce platform (like Shopify), and your advertising accounts.
The goal is to create a clear inventory of your data assets and link them directly to the questions they need to answer.
Stage 2: Model Your Single Source of Truth
With the blueprint in hand, we move to the Model stage. This is where the technical work kicks in, but the goal is still purely commercial: to create a reliable single source of truth.
This means pulling data from all the separate systems we identified in the Map stage and bringing it all into one central place, often called a data warehouse.
Here, the data gets cleaned, structured, and connected. We transform messy, inconsistent data points (like different date formats or customer names) into a standardised, trustworthy dataset. Using a powerful business intelligence tool like Power BI, we then build robust financial and operational models. This isn’t just about putting a spreadsheet online; it’s about building a dynamic engine that automatically links your financial statements to your sales activities and operational metrics.
A well-built data model means you’re no longer debating whose numbers are correct. Finance, sales, and operations are all working from the same validated information, eliminating friction and building trust in the data.
Stage 3: Mobilise Insights into Action
The final stage, Mobilise, is where your new data engine gets connected to your team. A perfect data model is useless if it just sits on a server, unseen. This phase is all about pushing insights to the front line of daily decision-making through automated, interactive dashboards.
Instead of static, month-end reports, your team gets access to dashboards that are always on and always up-to-date. They can explore the data, drill down from a high-level KPI to the individual transactions behind it, and finally understand the "why" behind the numbers.
For our e-commerce brand, a marketing manager could instantly see which ad campaign is driving the most profitable sales today, not a month from now.
This is the real goal of strategic data analytics: empowering your team with timely, reliable insights that lead to smarter, faster, and more confident decisions.
Want to see how the Map, Model, Mobilise framework could work for your business? Connect with us to design your financial dashboard in Power BI and let's connect the dots in your data.
How SMBs Win with Strategic Analytics
The real value of any framework isn’t in the theory; it’s in the results it delivers on the ground. For SMBs, adopting strategic analytics isn't just some academic exercise—it's about tackling persistent, expensive problems and unlocking real, tangible growth.
This is where we shift from the what to the how. Let's walk through some practical scenarios that will hit home for any founder or operator who feels like they're flying blind, drowning in spreadsheets. Each example contrasts the frustrating 'before' state with the powerful 'after' state that strategic analytics makes possible.
Supercharge Financial Performance
Picture the all-too-common month-end scramble at a growing SMB. The founder needs to understand profitability, but the data is all over the place. Sales numbers are in one system, operational costs are tracked in another, and overheads are stuck in a messy Excel file.
-
The 'Before' State: The finance team burns days manually pulling data from different sources just to build a static Profit & Loss (P&L) statement. By the time it’s ready, the business is already a week into the next month. If a question pops up—like, "Why were our material costs so high?"—it kicks off another time-consuming data dig that could take hours, or even days, to resolve. Cash flow forecasting is basically a gut-feel guess based on old data.
-
The 'After' State: A dynamic P&L dashboard is built in a tool like Power BI, connecting directly to accounting, sales, and operational systems. The data refreshes automatically every single day. Now, the founder can see profitability instantly—not just for the whole company, but by product line, region, or even down to an individual customer. When a cost spikes, they can click on that line item and immediately drill down to the specific transactions behind the increase. The forecast is now a driver-based model, clearly showing how a change in sales today will affect cash flow next month.
The transformation is profound: from a slow, historical report to an interactive, forward-looking financial control center. This shift is a core component of building a culture of data-driven decision-making, empowering leaders to act with confidence.
Boost Operational Efficiency
For any service-based business, operational efficiency is everything. Wasted time, project overruns, and unhappy clients are the silent killers of profitability. The real challenge is that these problems are often hidden deep within the daily workflow, making them nearly impossible to spot.
-
The 'Before' State: A project manager has a hunch that certain types of projects always go over budget, but there's no easy way to prove it. They're forced to rely on anecdotes and memory. Tracking team utilisation is a manual slog involving timesheets that are often filled out late or incorrectly, making it impossible to see where time is really being spent.
-
The 'After' State: By connecting project management software, timesheets, and financial data, a Power BI dashboard reveals the truth. It clearly visualises project profitability, highlighting that the small, "quick-win" projects are actually the least profitable because of high administrative overhead. The dashboard also pinpoints which project phases create the biggest bottlenecks, allowing the operations lead to reallocate resources or refine processes to smooth out the workflow and boost client satisfaction.
Dial-In Sales and Marketing ROI
Every single founder asks the same question: "Is our marketing budget actually working?" Without connected data, the answer is usually a helpless shrug. You know how much you spent on ads, and you know how many sales you made, but connecting the two is a total nightmare.
-
The 'Before' State: The marketing team presents a report showing a high number of leads from a recent campaign. At the same time, the sales team is complaining that the leads are low-quality and aren't converting. There’s no single source of truth to see the journey from an ad click to a signed contract, making it impossible to calculate the true Return on Investment (ROI) of any specific channel.
-
The 'After' State: CRM data, ad platform data (from Google Ads or LinkedIn), and sales figures are all unified in a single dashboard. Now, everyone can see the complete picture. The marketing team can see not just which campaigns generate leads, but which ones generate leads that become profitable, long-term customers. They can confidently double down on channels that deliver real business value and slash spending on those that only produce vanity metrics.
The Technology Powering Your Strategy
The idea of implementing a full-blown strategic data analytics framework might sound daunting. Expensive. Complicated. Something reserved for massive corporations with sprawling IT departments. A decade ago, you’d have been right. Today, the game has completely changed.
The rise of cloud computing and accessible business intelligence tools has torn down the old walls. You no longer need to sink a fortune into on-premise servers or hire an army of data engineers just to get started. Modern tech makes this level of analysis affordable, flexible, and genuinely within reach for any ambitious SMB.
Your Central Data Library: The Data Warehouse
First things first, you need to solve the "data chaos" problem. For most SMBs, critical information is a mess—scattered across a dozen different apps, countless spreadsheets, and siloed departments. The solution here is a data warehouse, which is basically a central, organized library for all your business data.
Instead of financials in one messy folder, sales numbers in another, and operational stats in a third, a data warehouse brings it all together into one clean, well-organized home. It’s the foundational step that swaps disconnected files for a single source of truth. This is the bedrock of your entire analytics strategy.
Your Insight Engine: Power BI
Once all your data has a clean, central home, you need a way to actually understand what it's telling you. This is where a powerful business intelligence tool like Microsoft Power BI comes in. If the data warehouse is your library, Power BI is the master key that unlocks every book and connects all the stories inside.
Power BI plugs directly into your data library and turns those raw numbers into the interactive dashboards and dynamic financial models that deliver real insight. It’s the engine that powers your ability to:
- Visualize performance with clear, easy-to-digest charts and graphs.
- Drill down into details, going from a high-level KPI to the specific transactions behind it with just a click.
- Build financial models that update automatically, linking your P&L directly to your sales and operational drivers.
Power BI bridges the gap between complex data and clear business decisions. It’s designed for business users, not just technical experts, putting the power to explore and understand your data directly into the hands of your team.
This combination—a central data warehouse and an accessible tool like Power BI—is what makes a modern data analytics strategy so effective. This approach finally allows SMBs to move beyond static, outdated reports and build a true, insight-driven culture.
Ready To Start Your Data Journey?

We've covered a lot of ground on what strategic data analytics truly means. It’s not about buying fancy, complex tech—it's about getting real clarity and control over your business. It's about finally calling time on data chaos and the endless grind of manual reporting.
The leap from wrestling with disconnected spreadsheets to making confident, insight-led decisions is the single most important step you can take toward sustainable growth. You’re building a business that learns, adapts, and wins based on facts, not guesswork.
From Learning to Doing
Making this shift happen takes a clear plan and the right kind of expertise. The real goal is to build an automated, reliable system that finally connects the dots between your finances, operations, and sales, giving you one complete picture of performance.
The benefits are clear and come fast:
- Time Reclaimed: Automating reports frees up dozens of hours every month. That’s time you can put back into strategy, not spreadsheets.
- Trusted Numbers: A single source of truth ends the debates over data accuracy and gets your entire team on the same page.
- Proactive Decisions: With forward-looking dashboards, you can spot opportunities and risks long before they turn into major problems.
- Profitable Growth: You gain the clarity to double down on what’s working and cut what isn’t, directly impacting your bottom line.
This isn't just an operational upgrade; it's a fundamental shift in how you run your business. It’s the path to building a more resilient, predictable, and profitable company.
Your Next Step To Data Clarity
You don’t have to walk this path alone. Vizule specialises in guiding SMBs through this exact process. We apply our proven Map-Model-Mobilise framework to deliver actionable insights, fast. We handle all the technical heavy lifting so you can get back to what you do best—running your business.
Want to automate your reporting and finally trust your data? Learn more about our approach to business intelligence and see how we can help.
Book your free BI consultation today, and let’s start designing the reporting stack that will finally give you the control and clarity you need to scale with total confidence.
Frequently Asked Questions
When you're thinking about a new way to handle your business's data, it's only natural to have a few questions. Below, we've tackled some of the most common ones we hear from founders and operators. Our goal is to give you clear, straight-to-the-point answers to clear up any lingering doubts.
Is My Business Too Small for Strategic Data Analytics?
Not at all. This is a common misconception we see all the time. Strategic analytics isn't about how big your business is—it’s about the quality of the decisions you make, which is absolutely critical at every stage of growth. The idea that this is only for massive corporations is completely outdated.
Modern cloud tools like Power BI have made really sophisticated analysis affordable and accessible for small and medium-sized businesses. The trick isn't to build some enormous, complex system right out of the gate. You start lean, focusing on your most pressing business questions, and build from there. That way, every single step adds immediate, tangible value.
How Long Does It Take to See Results?
While a full-scale data transformation is definitely a journey, you can see the first meaningful results much faster than you’d think. This isn't one of those year-long projects where you're just waiting for something to happen.
By zeroing in on a single, high-impact area—like automating your monthly financial reports or finally getting clarity on sales performance—we can often get a foundational dashboard built and live in just a few weeks. That first win provides instant clarity, cuts out hours of manual work, and delivers a very quick return on investment.
Do I Need to Hire a Data Scientist?
No, and honestly, for most SMBs, that would be the wrong move. The whole point of working with a consultancy like Vizule is to get access to that deep technical expertise without the huge overhead and risk of a full-time hire.
We take care of the entire technical lift for you. That includes the initial data mapping, the messy business of cleaning everything up, building the robust data models, and designing the insightful dashboards. We act as the bridge, translating your business goals into a working analytics system. Our job is to empower you and your team to use the insights, not to turn you into data experts.
What if my data is messy and spread across multiple systems?
This is the most common situation we encounter. A business with messy, siloed, and untrustworthy data isn't a blocker; it's the starting point for almost every successful data transformation.
A core part of our Map-Model-Mobilise framework is built specifically to handle this chaos head-on. We work with you to clean, structure, and centralise your information, creating a reliable 'single source of truth' that you and your team can finally trust for critical decision-making.
Ready to turn your data from a source of frustration into your most valuable asset? The team at Vizule can show you how. We specialise in building the automated reporting stacks and financial models that give SMB leaders the clarity and control they need to scale with confidence.


