

Data transformation is the process of converting raw, messy data from its original format into a clean, structured, and usable state. For founders and business operators, it’s the critical step that turns chaotic information from spreadsheets, CRMs, and accounting software into a reliable foundation for business insights.
In simple terms, it's how you go from numbers you can't trust to clear, automated Power BI dashboards that help you make smarter decisions, faster.
Is Your Data a Mess? Let's Fix It.
If you're running a business, you know the frustration. You have valuable data trapped in systems that don't talk to each other—Excel files over here, customer info in your CRM there, and financials locked away in your accounting software. Getting a single, clear picture of your business performance feels like a constant battle.
This isn't just a minor headache; it's a major roadblock to growth. When you can’t trust your numbers, you’re left making decisions based on gut feelings instead of hard evidence. It's a frustrating cycle of manual reporting, endless copy-pasting, and a constant nagging doubt about the accuracy of your own reports.
From Raw Ingredients to a Gourmet Meal
Think of data transformation like a chef preparing a gourmet meal. A chef doesn't just throw raw ingredients onto a plate. They start with a pile of mismatched items—vegetables that need washing and chopping, spices that need measuring, and proteins that need trimming.
It's the chef's process of cleaning, preparing, and skillfully combining them that creates a delicious, cohesive dish.
Data transformation does the exact same thing for your business information. It takes raw data in all its messy forms and puts it through a process of cleaning, structuring, and enriching. This is what prepares it for powerful business intelligence tools like Power BI.
The goal is simple: to create a single source of truth. When your data is transformed, you no longer have to question whether the sales report from last week matches today's finance dashboard. Everything is consistent, accurate, and ready for analysis.
Understanding the hazards of poor infrastructure and untrustworthy data is the first step. It shines a light on why just having data isn't enough; that data has to be reliable to be valuable.
What Does This Look Like in Practice?
For a small or medium-sized business, data transformation solves tangible, everyday problems. It’s the bridge between the messy data you have and the clear insights you desperately need.
To make this more concrete, here’s a quick look at the journey your data takes. This table shows the tangible shift from raw, unusable data to a clean, analysis-ready format that powers real business insights.
Data Before and After Transformation
| Data Characteristic | Before Transformation (Raw Data) | After Transformation (Insight-Ready Data) |
|---|---|---|
| Consistency | Inconsistent formats (e.g., "NY", "New York", "N.Y.") | Standardized formats ("New York") |
| Completeness | Missing customer addresses or contact details | Gaps are filled or flagged for review |
| Accuracy | Typographical errors and outdated entries | Errors are corrected and data is validated |
| Structure | Scattered across multiple, siloed spreadsheets | Consolidated into a single, organized data model |
This process is what moves your data from being a source of confusion to a source of clarity.
So, what is data transformation at its core? It's the practical, essential process that turns your data from a liability into your most powerful asset. It’s how you finally move beyond spreadsheet chaos and unlock the kind of insight-led decision-making that drives smart, sustainable growth.
Ready to stop wrestling with messy data and start trusting your numbers? Book your free BI consultation with a Vizule expert today and discover how we can automate your reporting stack.
Why Data Transformation Gives You an Edge

Knowing what data transformation is is one thing. But the real question every business owner asks is, "So what? Why should I care?"
The answer is simple: clean, organised data is the foundation for scaling your business intelligently. It’s the engine behind your financial reports, the secret sauce in your sales forecasts, and the truth-teller in your KPI dashboards. Without it, you're just guessing.
The Tale of Two Businesses
Let’s paint a picture. Imagine two businesses, both fighting for the same customers.
Business A is stuck in Excel chaos. The founder blocks out their entire Monday morning to manually pull reports from their CRM, accounting software, and a handful of messy spreadsheets. They spend hours copying and pasting everything into one giant Excel file, fighting with broken formulas and praying the numbers add up. Decisions are always late, reactive, and mostly based on gut feel because the data is a week old and full of errors.
Business B has automated its data transformation. Every morning, the leadership team logs into a Power BI dashboard showing real-time sales figures, cash flow, and customer behaviour. When a new trend starts to emerge, they see it immediately and can act on it with total confidence.
This isn't some luxury just for massive corporations anymore. For any small or medium-sized business that wants to seriously compete, it's a must-have. The difference between Business A and Business B isn't their product—it's their ability to use data as a strategic weapon.
From Putting Out Fires to Planning Ahead
Data transformation fundamentally changes how you run your business. It flips the script, moving you from a reactive, "what just happened?" mindset to a proactive, "what's next?" strategy.
Instead of just looking back at last month's numbers, you can start asking the real money-making questions:
- Financial Forecasting: Which of our products are actually the most profitable? Where should we invest next quarter to drive growth?
- Operational Efficiency: What are the biggest bottlenecks in our sales pipeline that are holding back revenue?
- Customer Insights: Who are our best customers—the ones with the highest lifetime value—and how do we find more of them?
Getting answers to these questions is only possible when your data is clean, centralised, and ready for analysis. That’s the competitive edge data transformation delivers. By turning raw, messy data into a reliable asset, you give yourself the power to make smarter, faster decisions. To dig deeper into this, check out our guide on the benefits of data-driven decision-making.
In a crowded market, the business that knows its numbers best is the one that wins. Data transformation makes sure you’re not just looking at numbers; you’re looking at the right numbers, right when you need them.
And the market is catching on fast. The global digital transformation market—where data is a central piece of the puzzle—has been on a tear. In 2024, it was valued at around $1,070.43 billion. By 2030, it’s expected to explode to $4,617.78 billion. That growth is being fueled by businesses of all sizes finally getting the tools they need to scale. You can read more about it in the full market analysis on Grand View Research.
Bottom line? Getting a handle on your data is no longer optional. It's the critical ingredient for survival, growth, and building a business that can handle whatever comes next.
The Core Steps of Data Transformation
For a lot of business owners, the whole idea of "data transformation" can feel like a technical black box. But it's really not that mysterious. It’s a logical journey from the chaos of raw data to the clarity of real insights. There's less magic involved and more of a proven, practical workflow.
I like to compare it to building a house. You wouldn't just dump a pile of lumber on a plot of land and start nailing boards together. You'd begin with a blueprint, gather the right materials, and then assemble everything according to a clear plan. Data transformation works the same way.
Following these steps ensures nothing is left to chance, turning your disconnected data points into a solid foundation for growth.
Step 1: Discovery and Mapping
The very first step is always Discovery. This is where we figure out what you actually want to achieve. Are you trying to build a reliable cash flow forecast? Do you need a better handle on customer lifetime value? Your business goals are what drive the entire project from start to finish.
Once we know the destination, we get into Mapping. This is the blueprint phase. We identify all your data sources—your CRM, accounting software, e-commerce platform, and yes, even those infamous spreadsheets. Then, we map out how information from each source needs to connect to answer your most important business questions. A simple example is mapping the "customer ID" from your sales system to the "customer account" in your billing software so they can talk to each other.
A solid market research methodology isn't so different; it outlines how to gather and make sense of information. Both processes start with a clear objective and a plan for connecting disparate pieces of information to create a complete picture.
Step 2: Extraction and Execution
With a clear blueprint in hand, we move on to Extraction. This is where we gather your raw materials. We use specialized tools to pull the data we need from all those different systems. Think of it as collecting all the lumber, pipes, and wiring for your house and getting them all to the construction site.
Next up is the most critical stage: Execution. This is where the actual transformation happens. That raw, messy data is finally cleaned, standardized, and structured. In our house analogy, this is the construction phase—where raw materials are cut to size, assembled, and refined into a finished product.
The execution stage involves a few key jobs:
- Cleaning: Fixing typos, getting rid of duplicate entries, and handling missing values. A classic example is standardizing "NY," "New York," and "N.Y." into a single, clean "New York" format.
- Standardizing: Making sure all data follows a consistent format. This could mean ensuring all dates are
YYYY-MM-DDor that all currency values are in GBP. - Enriching: Sometimes, we add new information to make the existing data more valuable. For instance, we might add demographic data to your customer list based on their postcodes.
This detailed work is what guarantees the final output is accurate, reliable, and ready for you to use.
This infographic breaks down the high-level flow, from planning the work to organising the final data.
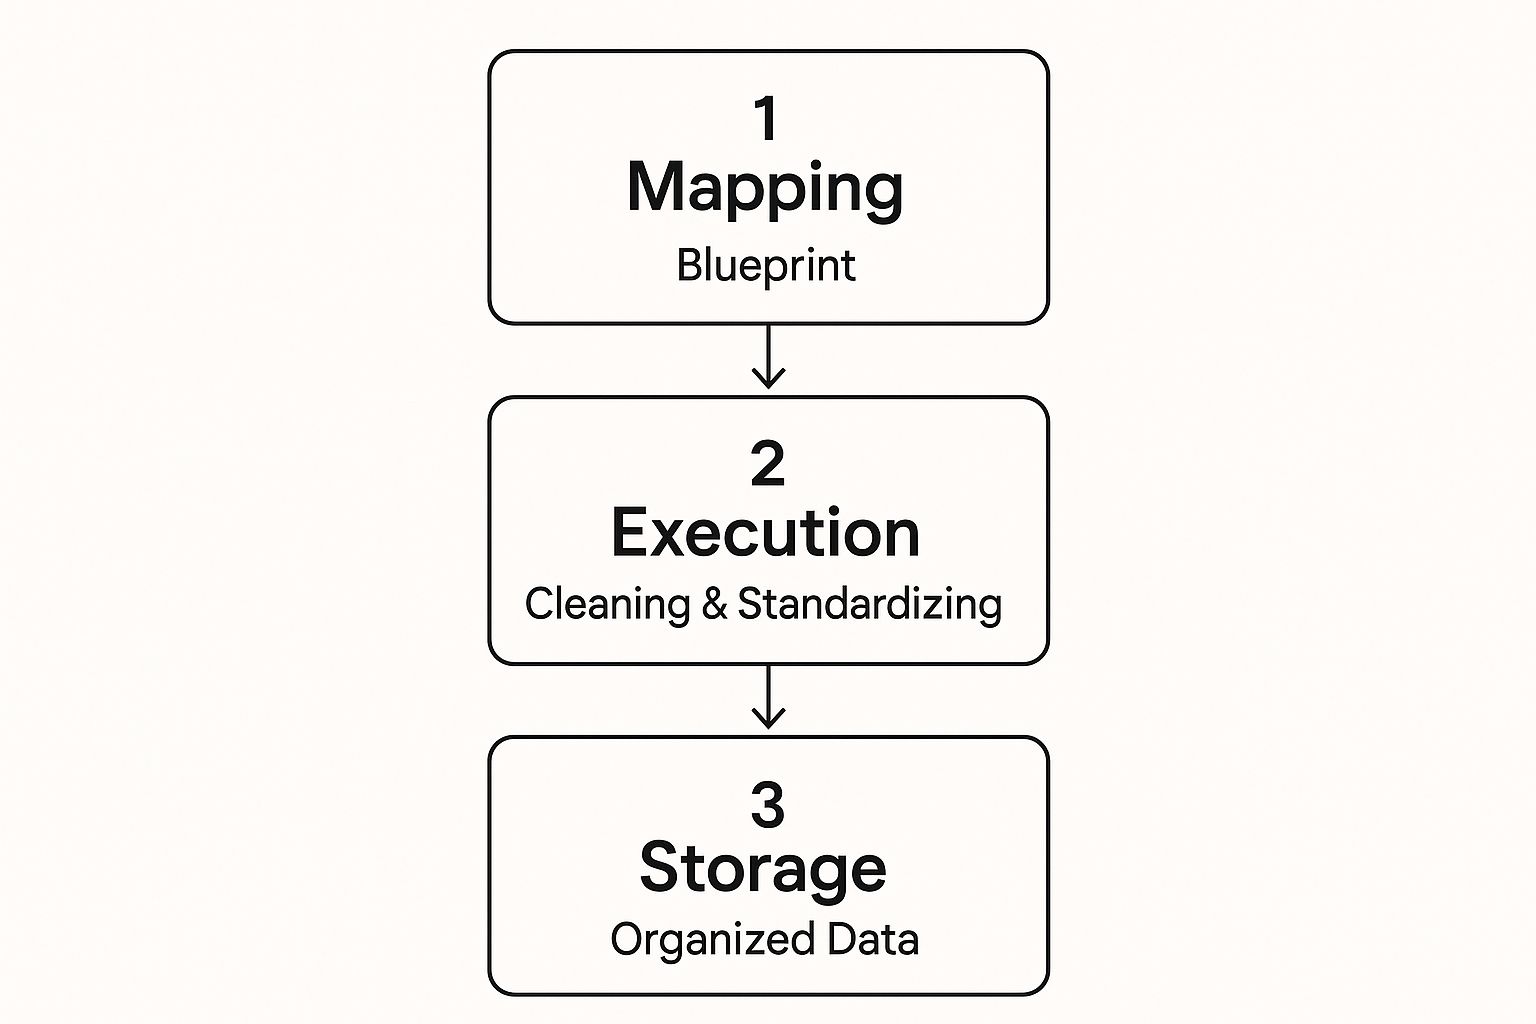
As you can see, the journey is straightforward: a strategic blueprint (Mapping) leads to the hands-on work of cleaning and standardizing (Execution), which results in a valuable, organized asset (Storage).
Step 3: Loading and Storage
The final step is Loading and Storage. Once your data has been transformed, it needs a new home—a place where it can be easily accessed for reporting and analysis. This "home" is typically a data warehouse or a data model inside a business intelligence tool like Power BI.
Instead of being trapped in separate silos, your clean, consolidated data is now stored in one central, organized repository. This becomes your company's single source of truth. From here, you can build dashboards, generate reports, and run analyses with full confidence that everyone is working from the same, accurate numbers.
This entire structured process is what we in the industry call a "data pipeline." It's the automated system that continuously moves data from its raw sources, through the transformation steps, and into your hands as actionable insights.
Building out this pipeline is the secret to escaping the grind of manual reporting for good. To see what goes into it, you can learn more about how to build a data pipeline that automates your entire workflow. By breaking the process down into these logical steps, data transformation becomes a manageable and incredibly powerful tool for any business owner who's ready to finally trust their data.
Practical Data Transformation Techniques for SMBs

So, you understand the theory. But what does data transformation look like on the ground? This is where the rubber meets the road—applying specific techniques that solve real, everyday business headaches.
Let's ditch the abstract concepts and dive into the hands-on methods that turn messy data into a reliable asset. Think of these as the essential tools in your data workshop, each one perfectly designed for a specific job.
Data Cleansing: Fixing the Foundation
First up, and arguably the most crucial, is data cleansing. You might also hear it called data cleaning or scrubbing, but the mission is always the same: hunt down and fix the errors, duplicates, and inconsistencies lurking in your data.
Imagine you're pulling a customer list from Shopify. You’ll likely find the same person listed multiple ways: "Jane Doe," "J. Doe," and "jane.d@email.com." Data cleansing is the process that spots these are all the same person and merges them into a single, clean record. It corrects typos, fills in missing postcodes, and gets rid of the duplicate entries that throw off your reporting.
Without this step, you might end up sending one customer three identical marketing emails or wildly miscalculating your total number of unique customers. It’s foundational.
Data Aggregation: Seeing the Big Picture
Next, we have data aggregation. This is all about summarizing raw, granular data into a more useful, big-picture format. Your systems are collecting data constantly—every click, every sale, every stock movement. That level of detail is just noise when you're trying to make strategic decisions.
Aggregation takes that mountain of individual data points and rolls them up. For instance, it can turn thousands of daily sales transactions into a single, clear number: "Total Monthly Revenue." This allows you to spot trends over time without getting bogged down in the minutiae. It’s how you get from an endless spreadsheet of transactions to a clean monthly performance report.
Data aggregation is like zooming out from a single tree to see the entire forest. It’s what helps you spot the real patterns and track progress against your most important business goals.
Data Enrichment: Adding Valuable Context
Data enrichment is where things get really powerful. This is the process of enhancing your existing data by adding useful information from other sources. It adds layers of context that your internal data doesn't have on its own, making your analysis far more insightful.
Let’s say you have a list of customer postcodes. That's useful, but what if you could add the corresponding sales territory to each one? Through enrichment, you can append that territory data to every customer record. Instantly, you can analyse sales performance by region, pinpoint your most profitable areas, and allocate your sales team's time far more effectively.
Data Formatting: Creating Consistency
Finally, there’s data formatting, the vital job of standardizing all your data into one consistent format. It’s amazing how many different ways your various systems can store the exact same type of information.
One system might log dates as "10/05/2024," while another uses "May 10, 2024." Your sales platform could record revenue in GBP while your analytics tool defaults to USD. Data formatting is what fixes all of this, ensuring every date, currency, and unit of measurement is uniform across your entire dataset. This kind of consistency is non-negotiable if you want accurate reports and trustworthy dashboards in a tool like Power BI.
Matching Your Problem to the Right Technique
Each of these techniques solves a very specific kind of data problem. To make it easier, here’s a quick-reference guide to help you match your current challenges to the right solution.
| Your Business Problem | Example | Relevant Technique |
|---|---|---|
| My customer list is full of typos and duplicates. | "J. Doe" and "John Doe" are listed as separate customers. | Data Cleansing |
| I can't see high-level trends from daily transaction logs. | I need to know our total sales for last quarter, not just by day. | Data Aggregation |
| My sales data lacks geographic or demographic context. | I have customer addresses but don't know which sales region they're in. | Data Enrichment |
| My reports break because dates and currencies don't match. | One report uses DD/MM/YYYY and another uses MM-DD-YY. | Data Formatting |
By understanding which tool to use for which job, you can start tackling your data issues one by one, methodically turning chaos into clarity.
Ready to apply these techniques to your own data challenges? Connect with us to design your financial dashboard in Power BI and see how we can transform your data into your most valuable asset.
Common Mistakes and How to Avoid Them
Taking the plunge into a data transformation project can feel like a huge leap. But here's the good news: most of the common pitfalls are entirely avoidable if you know what to look for. By sidestepping these early-stage mistakes, you can save a lot of time, money, and frustration.
Think of it as getting a cheat sheet from someone who's done this before. Instead of discovering every roadblock the hard way, you get a map of what to watch out for.
Mistake 1: Starting Without a Clear Business Goal
One of the quickest ways to derail a data project is to focus on the technology before identifying the business problem. Many companies get excited about tools like Power BI without first asking, "What specific question are we actually trying to answer?" or "Which broken report is burning the most staff hours?"
This tech-first approach almost always ends with impressive-looking dashboards that nobody uses. Why? Because they don't solve a real, everyday pain point for the team.
How to Avoid It: Always start with the end in mind. Before you even think about software, nail down one or two critical business challenges. Are you flying blind on cash flow forecasting? Is your sales pipeline a complete mess? Define the specific outcome you need, and let that business goal steer every single decision you make.
Mistake 2: Overlooking Data Governance
"Data governance" sounds like a stuffy, corporate buzzword, but for an SMB, it’s actually simple and practical. It just means setting a few basic ground rules for how you collect, manage, and use your information. Skipping this step is like building a house without a blueprint—it doesn't take long for chaos to set in.
Without clear rules, you'll end up with inconsistent data entry, duplicate customer records, and a team that doesn't trust the numbers. This is exactly how you end up right back in "Excel hell," even after investing in powerful new tools.
How to Avoid It:
- Assign Ownership: Make one person responsible for the quality of a specific dataset. For example, the sales manager owns the CRM data.
- Define Key Metrics: Create a simple document defining your most important terms. What exactly counts as a "new lead"? What is the definition of an "active customer"?
- Standardise Entry: Set up basic rules for data entry, like always using the full company name or a specific date format (DD/MM/YYYY).
These small steps create a foundation of trust and ensure your data remains a reliable asset for the long haul.
Mistake 3: Ignoring the Human Element
You can have a perfect data model and the most beautiful dashboard in the world, but they are completely useless if your team doesn't understand them, trust them, or know how to use them. A classic mistake is to launch a new system with zero training and just expect everyone to jump on board.
Change is hard. Moving your team from the spreadsheets they've used for years to a new BI platform requires support and clear communication.
How to Avoid It: Plan for adoption from day one. Get key team members involved in the process early, host short training sessions focused on their specific roles, and clearly show them how this new system is going to make their jobs easier, not harder. Celebrate small wins to build momentum and prove the real-world value of trusting the new reports.
At the end of the day, avoiding these common errors is all about being deliberate. By focusing on business goals, setting up simple rules, and bringing your team along for the ride, you're setting your data project up for success right from the start.
Ready to build a data strategy that dodges the pitfalls? See how Vizule can help automate your reporting stack and build a foundation you can finally trust.
How Vizule Turns Your Data Chaos Into Clarity
Understanding what data transformation is in theory is one thing. Actually making it work for your business is another. This is where the rubber meets the road, and it's where we come in.
At Vizule, our entire mission is to guide founders and SMBs out of the frustrating, time-sucking vortex of "Excel hell" and into the clear, calm waters of automated, insightful Power BI dashboards. We bridge that painful gap between knowing you have a data problem and actually solving it for good. Our approach isn't about throwing tech at the wall; it's about getting to the heart of your business goals and building a data foundation that serves them.
A Familiar Story, Reimagined
Let me tell you about a client we worked with recently. He was an e-commerce founder who was sinking over 10 hours every single week into manually patching together sales and inventory reports. He’d pull data from Shopify, his warehouse software, and a handful of marketing platforms into a monster spreadsheet that was always breaking, always out of date. He was making big decisions based on numbers he couldn't fully trust. Sound familiar?
Our process turned that whole situation on its head. We started by mapping out the critical business questions he needed answers to, then traced them back to the specific data sources that held those answers. From there, we built an automated pipeline to do all the heavy lifting.
This involved a few key steps:
- Connecting all those separate systems into one cohesive, single source of truth.
- Cleaning up and standardizing the messy stuff, like inconsistent product names and jumbled customer data.
- Aggregating daily transactions into meaningful weekly and monthly performance metrics he could actually use.
- Building a robust financial model right inside Power BI so he could track profitability in real-time.
The result? He got an entire day back, every single week. But more importantly, he finally had numbers he could bet the farm on. He quickly uncovered which marketing channels were bringing in the highest-value customers—an insight that was completely buried in the noise before.
Your Path from Chaos to Control
Our approach is designed to deliver value fast, zeroing in on your most important systems first. We specialise in the kind of practical data integration consulting that solves the immediate headaches small businesses face. We handle the technical mess so you can get back to running your business, armed with clear, reliable insights that fuel smarter growth.
Imagine what you could do with an extra day in your work week. Imagine making every key decision with complete confidence in the data behind it. That's the clarity we deliver.
Ready to make that happen for your business? Book a free discovery call with our BI consultants today and let's talk about your specific data challenges and map out your path to automated reporting.
Got Questions? We've Got Answers
Stepping into a data transformation project can feel like a big move, and it's natural to have a few questions swirling around. We hear a lot of the same concerns from founders and business owners, so let's tackle them head-on.
Is This Kind of Thing Only for Big Companies?
Not a chance. In fact, that’s a common myth. Years ago, this level of data work was reserved for massive corporations with equally massive budgets. Today, modern tools like Power BI have completely changed the game, making powerful data transformation accessible and affordable for small and medium-sized businesses.
The secret isn't a huge budget; it's a smart strategy. By focusing on your most pressing business questions first, a targeted project can deliver a serious ROI just by saving your team countless hours and wiping out costly reporting mistakes.
How Long Does This Take?
Probably not as long as you think. The exact timeline always depends on how many data sources you have and how complex they are, but we're not talking about a multi-year saga.
For most businesses we work with, an initial project focused on core financial and operational reporting starts delivering real, tangible value in a matter of weeks, not months. Our whole approach is to zero in on your biggest headaches first, so you see a return on your investment fast.
Do I Need to Hire a Full-Time Data Expert?
Nope, that’s exactly why partners like Vizule exist. Think of us as your on-demand data team. We handle all the heavy lifting—designing the technical architecture, building the transformation workflows, and creating the automated dashboards that deliver insights right to your screen.
We bring the expertise so you can stay focused on what you do best: running your business. It's the perfect way to get enterprise-level data capabilities without the overhead and commitment of hiring an in-house specialist.
Ready to stop guessing and start making decisions with confidence? The team at Vizule specialises in turning messy data into your most valuable asset.
