


As a founder or operator, you're constantly making high-stakes decisions with limited resources. But what if you could trade gut-feel for certainty? What if every strategic move was backed by clear, undeniable evidence from your own business data? This is the power of data-driven decision-making (DDDM). It’s not just a buzzword for large corporations; it's a practical framework that helps you eliminate costly mistakes, understand what truly drives your business, and unlock sustainable growth.
Many SMB leaders are stuck in Excel chaos, wrestling with siloed information and reports that are out-of-date the moment they're created. This operational drag leads to missed opportunities and reactive, rather than proactive, management. The good news is that modern business intelligence tools, like Power BI, make it easier than ever to transform that chaos into clarity, connecting your financial and operational data into a single source of truth.
In this guide, we'll break down the tangible benefits of data driven decision making for SMBs. We will explore how to move beyond basic reporting to create a playbook that enhances forecast accuracy, boosts operational efficiency, and solidifies your competitive advantage. You will learn how leveraging your data as your most valuable asset can directly impact your bottom line.
1. Improved Accuracy and Reduced Bias
One of the most significant benefits of data-driven decision making is its power to ground your strategy in objective reality rather than intuition or ingrained assumptions. Every business leader has biases shaped by personal experience, and these cognitive shortcuts, while often helpful, can lead to costly errors in judgement. A data-first approach systematically strips away these subjective influences, promoting decisions based on quantifiable evidence.

This method forces you to confront what the numbers are actually saying, not what you think they should be saying. By relying on clean, structured data pulled from your operations, finance, and sales platforms into a tool like Power BI, you replace gut feelings with validated insights. This shift minimises the risk of confirmation bias (favouring information that confirms existing beliefs) and emotional reasoning, leading to more reliable and accurate outcomes.
Real-World Impact: A Logistics SMB Scenario
Imagine a mid-sized logistics company planning its next fleet expansion. The operations manager, a veteran of the industry, has a gut feeling that they should invest heavily in larger trucks. However, a Power BI dashboard integrating delivery data, fuel costs, and client order sizes reveals a different story: a growing demand for smaller, more frequent local deliveries. The data shows that investing in a fleet of smaller, more fuel-efficient vans would yield a higher ROI and better serve their most profitable customer segment. By trusting the data over intuition, the company avoids a costly capital expenditure mistake.
How to Implement This in Your Business
You don't need a massive budget to start reducing bias. The key is establishing a clear framework.
- Establish a Single Source of Truth: Centralise your data from various systems (CRM, accounting software, operations tools) into a business intelligence platform to ensure everyone is working from the same numbers.
- Triangulate Your Data: Never rely on a single data source. Cross-reference insights from your CRM, financial software, and operational platforms to validate findings and get a complete picture.
- Document Your 'Why': Create a formal document outlining the key metrics and criteria used for every major decision. This creates a transparent, repeatable process and holds the team accountable to the data.
- Encourage a Culture of Inquiry: Foster an environment where team members feel empowered to question assumptions and ask, "What does the data say?" This shifts the focus from opinions to evidence.
By building these habits, you create a system where decisions are defensible, transparent, and far more likely to be correct.
Key Insight: Objective data acts as a check against the powerful pull of human intuition and bias. A formalised, data-centric process ensures that your business strategy is built on a foundation of fact, not feeling, dramatically improving the accuracy and reliability of your decisions.
2. Enhanced Strategic Planning and Forecasting
Data-driven approaches transform strategic planning from an exercise in educated guesswork into a more scientific process grounded in evidence. By analysing historical data from your sales pipeline, financial reports, and operational workflows, you can build predictive models in Power BI that identify emerging trends, market shifts, and future opportunities with far greater precision. This capability allows you to move beyond reactive adjustments and proactively shape your company's long-term trajectory.

This method empowers you to anticipate customer needs, optimise resource allocation, and mitigate risks before they materialise. By leveraging financial models, operational metrics, and market data, you can build a forward-looking strategy that is both ambitious and realistic. This is one of the key benefits of data driven decision making, as it provides a solid, quantifiable foundation for your cash flow reporting and business planning.
Real-World Impact: A SaaS Founder's Story
A startup founder is preparing her annual budget and growth targets. In the past, this was based on a simple percentage increase over last year's revenue. Now, using an automated financial model in Power BI, she can analyse customer churn rates by cohort, track sales cycle length, and model the impact of a planned price increase on future cash flow. The model reveals that while top-line growth is strong, a specific customer segment acquired six months ago is churning at an alarming rate. Instead of a blanket increase in marketing spend, she reallocates resources to a customer success initiative targeting that cohort, building a more sustainable, data-backed plan for growth.
How to Implement This in Your Business
Accurate forecasting doesn't require an Amazon-sized budget. It starts with building the right framework to connect your data sources.
- Integrate Financial and Operational Data: The most powerful forecasting models combine data from across the business. Connect your accounting software (like Xero or QuickBooks) with your CRM and operational tools.
- Update Models Regularly: Your business and market are dynamic. Ensure your forecasting models are continuously updated with fresh operational and financial data to maintain their relevance and accuracy.
- Incorporate External Data: Your business doesn't operate in a vacuum. Integrate external market data, economic indicators, and industry trends into your planning processes for a more holistic view.
- Develop "What-If" Scenarios: Use data to model various scenarios. What happens to your cash flow if a major client leaves? How does a 10% increase in material costs affect your margins? This allows you to create data-backed contingency plans. Learn more about how to improve forecast accuracy with Vizule.
By building a dynamic forecasting engine, you can navigate uncertainty with confidence and make strategic decisions that secure future growth.
Key Insight: Data-driven forecasting elevates strategic planning from subjective prediction to objective probability. By modeling future scenarios based on historical and real-time data, you can build a resilient, forward-looking strategy that anticipates change rather than just reacting to it.
3. Faster and More Confident Decision Making
In a competitive market, speed is a critical advantage. Relying on outdated reports or lengthy debates over subjective opinions slows your organisation down, creating opportunities for nimbler rivals. One of the core benefits of data-driven decision making is its ability to accelerate this process, empowering leaders to act quickly and with greater conviction. Access to real-time data and automated analytics replaces guesswork with validated evidence.

When your team can access up-to-the-minute dashboards and financial models, the time between identifying a problem and implementing a solution shrinks dramatically. This agility allows you to respond swiftly to market shifts, customer behaviour, and operational issues. Instead of spending weeks compiling reports, your team can focus on interpreting insights and taking decisive action, confident that their choices are backed by solid numbers.
Real-World Impact: An E-commerce Operator's Quick Pivot
An e-commerce manager notices a sudden dip in the conversion rate for a key product. In the past, it would take days of pulling manual reports from Google Analytics, Shopify, and their ad platform to diagnose the issue. With an integrated Power BI dashboard, she sees the problem in minutes: a recent website update caused a bug in the mobile checkout process, where 70% of their traffic originates. The dashboard automatically flagged the drop in the mobile conversion KPI. She immediately alerts the development team, the bug is fixed within an hour, and a potentially disastrous sales weekend is saved.
How to Implement This in Your Business
Embedding speed and confidence into your decision-making culture requires a structured approach to data accessibility and interpretation.
- Build Automated KPI Dashboards: Centralise your most important metrics from sales, marketing, finance, and operations into a single, automated dashboard. This gives everyone a real-time view of business health.
- Set Up Automated Alerts: Configure your business intelligence platform to send alerts when key performance indicators (KPIs) go above or below a predefined threshold. This ensures you are immediately aware of critical changes.
- Establish Data Quality Checkpoints: To trust your data for fast decisions, it must be accurate. Implement automated data validation rules and regular quality checks to ensure your analytics are built on a reliable foundation.
- Train for Rapid Interpretation: Equip your teams with the skills to read and understand dashboards quickly. Focus training on connecting the dots between different metrics and identifying the most important insights for immediate action.
By creating a system for fast, reliable data access, you empower your team to move with purpose and precision.
Key Insight: Real-time data and automated analytics transform decision making from a slow, deliberative process into a fast, confident response mechanism. This agility is a powerful competitive advantage, enabling businesses to seize opportunities and mitigate risks before others even notice them.
4. Increased Operational Efficiency and Cost Reduction
One of the most immediate and tangible benefits of data driven decision making is its ability to spotlight and eliminate operational waste. By shifting from guesswork to granular analysis, you can pinpoint inefficiencies in workflows, supply chains, and resource allocation that drain your budget. This data-first mindset transforms your operations from a cost centre into a strategic asset for growth and profitability.
This approach involves systematically collecting and analysing data from every stage of your business processes, from production to delivery. It allows you to see precisely where time, money, and materials are being lost, enabling targeted interventions that drive significant savings. Instead of implementing broad, disruptive changes, you can make precise, data-backed adjustments that enhance productivity without sacrificing quality.
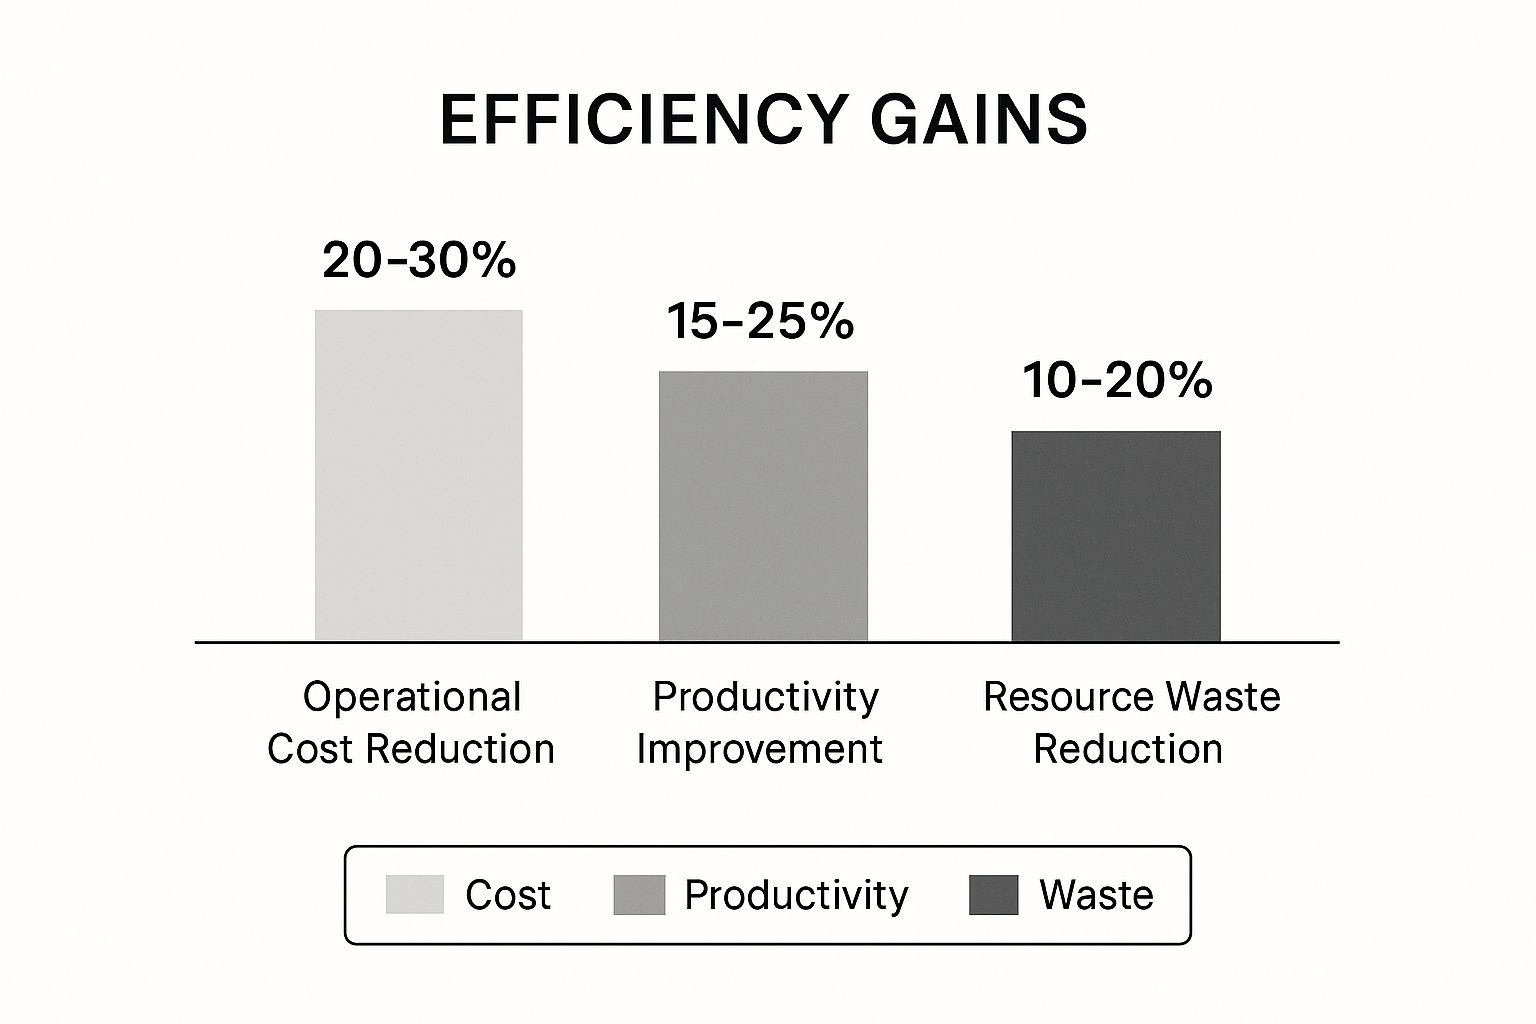
This bar chart visualises the direct impact of operational data analysis, showing potential gains across cost, productivity, and resource management. As the data illustrates, businesses that successfully implement these strategies can achieve substantial bottom-line improvements by turning insights into action.
Real-World Impact: A Services Business Streamlines Operations
The founder of a growing digital marketing agency is concerned about project profitability. Projects seem to be taking longer than quoted, eating into margins. By implementing time-tracking software and integrating the data into a Power BI dashboard, she discovers that one particular service—let's call it "SEO Audits"—consistently runs 30% over budget on hours. Digging deeper, the data shows the bottleneck is a manual keyword research process. By investing in an automation tool for that specific task, she reduces the time spent on audits by 40%, instantly boosting the profitability of that service line and freeing up her team for higher-value work.
How to Implement This in Your Business
Unlocking these efficiencies is achievable for any SMB ready to move beyond Excel chaos. The key is a systematic approach to operational intelligence.
- Establish Baseline Measurements: You can't improve what you don't measure. Use a tool like Power BI to establish clear baseline KPIs for your key processes—like project completion time or cost per acquisition—before implementing any changes.
- Start with High-Impact Areas: Identify one or two processes where inefficiencies are most costly or apparent. Focus your initial data collection and analysis efforts there for a quick win.
- Involve Frontline Workers: Your team on the ground often has the best insights into daily bottlenecks. Empower them to help identify inefficiencies and contribute to data-backed solutions.
- Implement Changes Gradually: Introduce process improvements incrementally. This minimises disruption and allows you to accurately measure the impact of each specific change.
By building a culture of continuous, data-informed improvement, you create a resilient and highly efficient operation.
Key Insight: Data transforms operational management from a reactive, problem-solving function into a proactive, value-creating engine. By methodically identifying and eliminating waste, you can directly reduce costs, boost productivity, and build a stronger financial foundation for your business.
5. Enhanced Risk Management and Mitigation
In an uncertain business environment, moving from reactive problem-solving to proactive risk mitigation is a competitive advantage. Data-driven decision making provides the framework to identify, assess, and neutralise threats before they can cause significant disruption. Instead of relying on past experience alone, this approach uses historical and real-time data to forecast potential issues, from financial fraud to operational bottlenecks and customer churn.
This method empowers organisations to quantify risk and develop targeted strategies based on probability and potential impact. By analysing patterns and monitoring key risk indicators (KRIs) across your financial and operational platforms, you can transform risk management from a guessing game into a calculated science. This data-first mindset protects your business from financial losses, reputational damage, and operational failures.
Real-World Impact: A B2B Supplier Avoids a Cash Crunch
The owner of a manufacturing supplies business uses a Power BI dashboard to monitor accounts receivable. The system is set up to flag invoices that are more than 60 days overdue. An alert pops up showing that one of their largest clients, usually a prompt payer, has three large outstanding invoices. This data-driven trigger prompts an immediate, but friendly, call from the finance team. They discover the client is facing a temporary cash flow issue. By getting ahead of the problem, the supplier is able to negotiate a payment plan, securing the cash they were owed and preserving a key customer relationship—averting a potential bad debt write-off that would have squeezed their own cash flow.
How to Implement This in Your Business
Proactive risk management is within reach for any business willing to leverage its data. The focus is on creating a system to monitor and respond to threats.
- Establish Risk Thresholds: Define clear, data-driven thresholds for key metrics. For example, what level of customer churn, inventory surplus, or accounts receivable ageing triggers an alert?
- Integrate Risk Data: Break down data silos. Ensure your financial, operational, and customer data are integrated into a central BI platform like Power BI to provide a holistic view of potential risks.
- Create Response Playbooks: Use data insights to develop pre-defined action plans. If a specific KRI is breached, what is the immediate, standardised response from your team?
- Monitor Leading Indicators: Don't just track past failures (lagging indicators). Monitor leading indicators—like a drop in customer support tickets or website engagement—that might predict future problems.
By building a systematic, data-informed process, you can anticipate challenges and protect your bottom line more effectively.
Key Insight: Data transforms risk management from a reactive, intuitive exercise into a proactive, evidence-based strategy. By identifying patterns and monitoring key indicators, you can mitigate threats before they escalate, safeguarding your financial stability and operational continuity.
6. Competitive Advantage and Market Leadership
Beyond internal efficiencies, one of the most powerful benefits of data-driven decision making is its ability to create a sustainable competitive advantage. Organizations that embed data into their core strategy can respond to market shifts faster, uncover emerging opportunities before rivals, and optimise operations with a precision that competitors simply cannot match. This level of data maturity is often a direct path to market leadership.
This approach transforms data from a simple reporting tool into a strategic asset. By analysing customer behaviour, supply chain logistics, and market trends, you can make proactive moves instead of reactive adjustments. This allows you to outmanoeuvre competitors by anticipating customer needs, setting more effective pricing strategies, and allocating resources to the highest-impact initiatives, cementing your position as a leader in your industry.
Real-World Impact: A Local Retailer Wins Against Giants
A local chain of boutique coffee shops is competing against large national brands. They can't win on price, so they decide to compete on customer experience. Using sales data from their POS system integrated with their loyalty app, they discover a powerful insight: customers who buy a pastry with their morning coffee have a 50% higher lifetime value. They use this data to create a targeted "morning pairing" promotion, offering a small discount on a pastry with any coffee purchased before 10 AM. The campaign is a huge success, increasing both average transaction value and customer loyalty, giving them a profitable edge the larger, less agile chains can't easily replicate.
How to Implement This in Your Business
Gaining a data-driven edge requires a strategic focus on building data capabilities that are difficult to replicate. For a deeper dive, explore how to drive growth with effective data analysis for your business.
- Focus on Unique Data: Identify and cultivate proprietary data sources that your competitors can't easily access. This could be unique customer interaction data, specific operational metrics, or granular product usage analytics.
- Build Core Competencies: Treat business intelligence and analytics as a core business function, not just IT support. Invest in the right tools and training to empower your team to extract actionable insights.
- Innovate Your Analytics: Don't just track standard KPIs. Continuously experiment with new analytical models and forecasting techniques to uncover hidden patterns and predictive insights that give you an edge.
- Democratise Data Access: Use user-friendly tools like Power BI to give more people on your team access to relevant data, empowering them to find opportunities for innovation in their own roles.
By viewing data as a strategic weapon, you can create a moat around your business that is difficult for others to cross.
Key Insight: A mature data strategy does more than improve decisions; it becomes a core competitive advantage. By leveraging unique data and advanced analytics, you can anticipate market trends and outperform competitors, turning insight into market leadership.
7. Measurable ROI and Performance Tracking
One of the most powerful benefits of data driven decision making is the ability to move beyond vague assumptions and directly quantify the impact of your actions. Without clear metrics, strategic initiatives operate in a grey area where success is subjective and failures are difficult to diagnose. A data-driven approach instills a culture of accountability by linking every decision, campaign, and operational change to measurable outcomes.
This methodology transforms how you justify investments and allocate resources. Instead of relying on anecdotal evidence, you can present stakeholders with concrete data showing the return on investment (ROI) for a new marketing channel or the efficiency gains from a process improvement. This clarity allows you to double down on what works, pivot away from what doesn’t, and prove the tangible value of your team's efforts with confidence.
Real-World Impact: Proving Marketing Spend to the Board
A marketing manager at a B2B tech company is asking for a budget increase to invest in LinkedIn advertising. The leadership team is skeptical, preferring to stick with traditional methods. Using a Power BI dashboard that integrates data from LinkedIn, their CRM, and their financial software, the manager can show a complete picture. She demonstrates not only the number of leads generated but also the conversion rate of those leads into actual sales, the average deal size, and the final ROI. The data clearly shows that while LinkedIn leads are more expensive to acquire, they close at a higher rate and result in larger deals, delivering a 3x ROI compared to other channels. The budget is approved on the spot.
How to Implement This in Your Business
Tracking performance doesn't have to be complex. The key is connecting actions to outcomes through a structured measurement framework.
- Establish a Baseline: Before launching any new initiative, measure your current performance. This baseline is the essential starting point against which you will measure all future impact.
- Use Leading and Lagging Indicators: Track lagging indicators (like quarterly revenue) to measure past success, but also use leading indicators (like website demos booked or sales pipeline growth) to predict future outcomes.
- Create Reporting Cadences: Implement regular reporting cycles (weekly, monthly, quarterly) using a centralised dashboard. This keeps stakeholders informed and ensures performance stays top of mind.
- Link Metrics to Business Goals: Every key performance indicator (KPI) you track should directly connect to a high-level business objective. If a metric doesn't help you measure progress toward a core goal, it's likely a vanity metric.
By building this system, you create a direct line of sight between your decisions and their financial and operational consequences.
Key Insight: A data-driven framework makes performance transparent and ROI tangible. By tying every strategic decision to clear, quantifiable metrics, you can optimize resource allocation, prove value to stakeholders, and ensure your business is consistently investing in what drives real growth.
From Data Chaos to Strategic Clarity: Your Next Step
We've explored the profound impact of embedding data into the core of your operations. Moving beyond intuition and "best guesses" isn't just a modern trend; it's a fundamental shift in how successful businesses operate, scale, and innovate. The journey from scattered spreadsheets to a unified, automated reporting system is where the real transformation happens. It’s the difference between reacting to the past and proactively shaping the future.
The benefits of data driven decision making are not reserved for large corporations with massive data science teams. For ambitious SMBs and founders, this approach is a powerful competitive lever. As we've seen, it empowers you to enhance forecast accuracy, reduce operational waste, understand customer behaviour with incredible precision, and mitigate risks before they escalate. It’s about making smarter, faster, and more confident choices at every level of your organisation.
Key Takeaways: From Theory to Action
Recapping the core advantages, it’s clear they are all interconnected, creating a powerful flywheel effect for growth:
- Clarity Over Confusion: By replacing biased assumptions with objective data, you gain unparalleled accuracy in your understanding of business performance.
- Proactive Strategy: Data-driven forecasting and strategic planning turn your financial models from static documents into dynamic roadmaps for growth.
- Operational Excellence: Identifying and eliminating inefficiencies becomes a systematic process, directly improving your bottom line and freeing up valuable resources.
- Competitive Edge: Using data to understand your market and customers allows you to make smarter moves that put you ahead of the competition.
The common thread is visibility. When your financial and operational data are connected, automated, and presented clearly in a tool like Power BI, you unlock the ability to ask better questions and get reliable answers instantly. You stop spending valuable hours compiling reports and start investing that time in strategic initiatives that drive the business forward.
Your Path to a Data-Driven Culture
Making this transition doesn't require a complete organisational overhaul overnight. It starts with a single, crucial step: committing to building a single source of truth. The goal is to create a reliable, automated reporting stack that empowers your team with the insights they need, when they need them. This is where an expert implementation of business intelligence tools can completely change the game for your business.
Instead of wrestling with disconnected data silos and manual Excel updates, you can have dynamic dashboards that align your entire team around key performance indicators. This foundational step is the most critical part of harnessing the true benefits of data driven decision making and building a resilient, scalable business.
Ready to move from data chaos to strategic clarity? Vizule specialises in connecting the dots in your data, building the automated Power BI reporting and financial modelling systems that empower SMBs to unlock insight-led growth. Book your free discovery call today and let's create a clear roadmap to transform your data into your most valuable asset.


