


If you’re running a small or medium-sized business, you know the feeling. The end of the month rolls around, and suddenly it’s a mad dash to pull reports. You’re exporting data from one system, wrangling VLOOKUPs in another, and trying to stitch it all together into spreadsheets that, if you’re being honest, you don’t fully trust.
This frantic, manual grind isn’t just a waste of time—it’s actively holding your business back. Digital transformation in finance is the key to breaking this cycle, moving from reactive reporting to proactive, insight-led decision-making that fuels growth.
Leaving Excel Chaos Behind
For far too many founders and finance teams, the entire operation rests on a wobbly foundation of spreadsheets. You pull sales figures from your CRM, transaction logs from your payment processor, and manually key in expenses. You’re aiming for a crystal-clear picture of your performance, but what you usually get is a messy, error-prone process that eats up days of your team’s precious time.
This constant reporting cycle is more than just an operational headache; it’s a huge strategic liability. The process of modernizing outdated systems for financial innovation is essential because when your data lives in separate silos and your reports are static, you pay a heavy price.
The True Cost of Manual Reporting
The real cost of sticking with manual reporting goes way beyond the hours spent copying and pasting. It introduces fundamental risks that can easily suffocate growth.
- Delayed Decisions: When it takes a full week just to close the books, you’re always driving by looking in the rearview mirror. By the time you get the insights, they’re already out of date, making it impossible to react quickly to market changes or fix internal problems.
- Missed Opportunities: Without a live, accurate view of your financials, you could miss the perfect moment to invest in a winning marketing channel. Worse, you might not spot a looming cash flow gap until it’s an emergency.
- A Persistent Lack of Clarity: Inconsistent formulas and disconnected spreadsheets create a constant sense of doubt about your numbers. This forces you to fall back on gut feelings for major decisions instead of relying on solid data.
Think about it. A founder needs to know their exact cash position to see if they can afford a critical new hire. They pull a report from their accounting software, but it doesn’t line up with the sales data in their CRM. Hours are wasted trying to figure out the discrepancy, and a key growth decision gets put on hold. That’s the reality of Excel chaos.
This is exactly why exploring https://vizule.io/data-analytics-for-small-business/ is no longer a luxury—it’s a necessity. Moving away from these manual processes gives you back control.
The first real step in any meaningful digital transformation in finance is admitting that the old way just isn’t cutting it anymore. It’s about making the shift from being a reactive bookkeeper to becoming a proactive, data-driven leader. This change lets you stop managing spreadsheets and start managing your business with the clarity and confidence needed to truly scale.
What Does Digital Transformation in Finance Really Mean for SMBs?
Let’s cut through the jargon. When you hear “digital transformation,” it’s easy to picture massive, multi-million dollar projects with fleets of consultants. For a small or medium-sized business owner, that picture is not only intimidating, it’s completely irrelevant.
For you, digital transformation in finance isn’t about overhauling your entire company. It’s about making a fundamental shift: turning your finance function from a backward-looking bookkeeper into a forward-looking strategic partner.
Think about it. Running your business on static spreadsheets is like trying to navigate a busy highway using only your rearview mirror. You see where you’ve been, but you have no idea what’s coming. A modern financial system gives you a full GPS dashboard—real-time traffic, alternate routes, and a clear view of the road ahead.
The Three Pillars of Financial Transformation
For any SMB, this journey is built on three practical, achievable pillars. Each one moves you away from manual chaos and toward automated clarity, and they are surprisingly accessible with today’s tools.
- Connecting Your Data: Right now, your most valuable information is probably scattered everywhere. Sales figures are in your CRM, payment details are in Stripe or Shopify, and the core financials are in QuickBooks or Xero. The first step is to build bridges between these islands of data to create a single source of truth. This simple act ends the constant arguments over which numbers are the “right” ones.
- Automating the Grunt Work: How many hours do you or your team lose every single month pulling the same P&L, balance sheet, and cash flow reports? The second pillar is all about putting that repetitive work on autopilot. Forget manual exports and endless copy-pasting; you build a system that generates and updates your key reports for you.
- Unlocking Real Insights: Once your data is connected and your reports are automated, the final pillar is all about making sense of it. This is where tools like Power BI come in, turning rows of raw numbers into clear, interactive dashboards. Suddenly, you can spot trends, drill down into specifics, and get answers to critical questions in minutes, not days.
This isn’t just a hypothetical trend; it’s where the smart money is going. A recent Broadridge study on next-gen technology found that financial services firms plan to dedicate 29% of their total IT budgets to tech innovation in 2025—a big jump from 22% in 2024. This isn’t spending for spending’s sake; it’s driven by the proven, positive impact this has on business performance.
A Financial Reporting Comparison
To truly grasp the difference, let’s compare the old way of doing things with the new, automated approach. The table below shows just how much things change when you move from manual processes to a dynamic system.
| Financial Task | The Old Way (Manual & Static) | The New Way (Automated & Dynamic) |
|---|---|---|
| Monthly Reporting | Hours spent exporting data, fixing formats, and emailing PDFs. | Reports are generated automatically and always on. |
| Finding Answers | “I’ll have to pull another report and get back to you next week.” | Drill down into data instantly on an interactive dashboard. |
| Data Accuracy | High risk of copy-paste errors; multiple versions of the “truth.” | Data is pulled directly from the source, ensuring one version of the truth. |
| Forecasting | Based on outdated numbers and gut feelings. | Based on real-time data, enabling more accurate trend analysis. |
The contrast is stark. The new way frees up your most valuable resource—time—to focus on strategy instead of tedious data entry.
From Static Numbers to Dynamic Decisions
The real goal here is to completely change how you use your financial data. You stop getting a stale PDF report a few weeks after the month ends and start using a live dashboard you can actually explore.
Here’s a great example of how a Power BI dashboard can pull everything together into one clean, interactive view.

A dashboard like this puts your key metrics—revenue, gross margin, profit—all in one place, updated in near real-time.
This shift empowers you to move beyond what happened to understanding why it happened. You can filter by product line, region, or sales rep to pinpoint what’s driving performance—or what’s holding it back.
As we dive deeper, it’s clear that systems built around powerful AI and automation in FinOps are central to making this happen. At the end of the day, digital transformation gives you the tools to make smarter, faster decisions because you finally have a complete and reliable picture of your company’s financial health.
Building Your Modern Finance Stack
A successful finance team doesn’t just run on a single piece of software. It’s powered by an interconnected system—a “stack”—where different tools work together to automate routine work and, more importantly, deliver real insights. For a growing small or mid-sized business, this stack doesn’t have to be complicated or break the bank. It just needs to be smart.
Think of it like building a high-performance engine. You wouldn’t just grab random parts; you’d select specific, high-quality components designed to fit together perfectly to generate power and speed. A modern finance stack does the same thing for your company’s decision-making.
At Vizule, we’ve found that the most effective stacks for our clients are built around three core components. Let’s walk through what they are and why each one is so critical.
The Central Data Hub
First things first: you need a “single source of truth.” If you’re like most businesses, your financial data is probably scattered across a handful of separate systems. Your accounting lives in QuickBooks, payment data is in Stripe, and customer information is tracked in your CRM. These disconnected silos are the real reason you’re wasting so much time trying to make sense of your numbers.
A central data hub acts as the meeting point for all this information. It plugs directly into your various platforms and pulls everything into one organized, reliable place.
- What it is: A secure, cloud-based repository (think of it as a data warehouse) that automatically syncs information from all your business apps.
- Why it matters: This completely gets rid of manual data exports and the headache of reconciling conflicting reports. When everyone from finance to sales is looking at the same unified data, you can finally trust what you’re seeing.
The Business Intelligence Engine
Once all your data is in one place, you need an engine to turn those raw numbers into something you can actually use. This is where a powerful tool like Microsoft Power BI comes in. It connects to your data hub and lets you see what’s happening in your business in ways a spreadsheet never could.
Instead of static tables of numbers, you get interactive dashboards. You can look at your Profit & Loss statement, click on a single month to see every transaction that makes it up, or filter your sales performance by region with a click. Our work in business intelligence for finance is all about building these dynamic views that get you answers, fast.
Imagine asking, “Which of our products had the best profit margin last quarter?” Instead of a week-long data-pulling exercise, you get the answer in seconds by simply filtering a dashboard. That’s the power of a BI engine.
The Dynamic Forecasting Model
The final piece of your stack is built to replace that fragile, formula-heavy forecasting spreadsheet you’re probably wrestling with. We’ve all been there—traditional Excel models are a pain to update, and trying to run different scenarios is nearly impossible. One broken formula can invalidate the whole thing.
By moving your financial model into a tool like Power BI, you create a forecasting tool that’s both dynamic and resilient. Because it’s connected directly to your central data hub, the model updates automatically as new actuals flow in.
This unlocks powerful, driver-based planning. You can easily build out different scenarios—a best-case, worst-case, and your most likely forecast—and instantly see how each one impacts your cash flow and bottom line.
- Best Case Scenario: What happens if we increase customer retention by 10%?
- Worst Case Scenario: What is the impact if our lead acquisition cost goes up by 20%?
This capability shifts the finance function from just reporting on what happened in the past to actively helping shape the future. It’s a fundamental change that turns finance into a truly strategic partner in the business.
This move toward integrated, intelligent systems is happening everywhere. Just look at the rapid growth of digital-only neo-banks, which are projected to expand at a compound annual rate of 46.5%. This explosive growth shows a massive consumer shift towards digital-first experiences. It’s a trend fueled by using connected data for hyper-personalization, which can boost sales by 10% or more. You can discover more insights about these digital finance trends on anaptyss.com.
Want to automate your reporting and finally trust your data? Book a free call with our BI consultants today.
A Practical Roadmap to Financial Clarity
Jumping into a digital transformation can feel daunting, especially when you’re already juggling the day-to-day demands of running a business. It sounds like a massive, long-term project. But it doesn’t have to be. With the right roadmap, it becomes a series of manageable steps that deliver real value, fast.
At Vizule, we’ve developed a straightforward, three-step framework that turns the vague idea of “transformation” into a concrete plan. Think of us as your guide, leading you from the chaos of messy spreadsheets to the confidence of clear, reliable data. This isn’t about boiling the ocean; it’s about making smart, targeted improvements that have an immediate impact on your business.
The journey looks something like this:
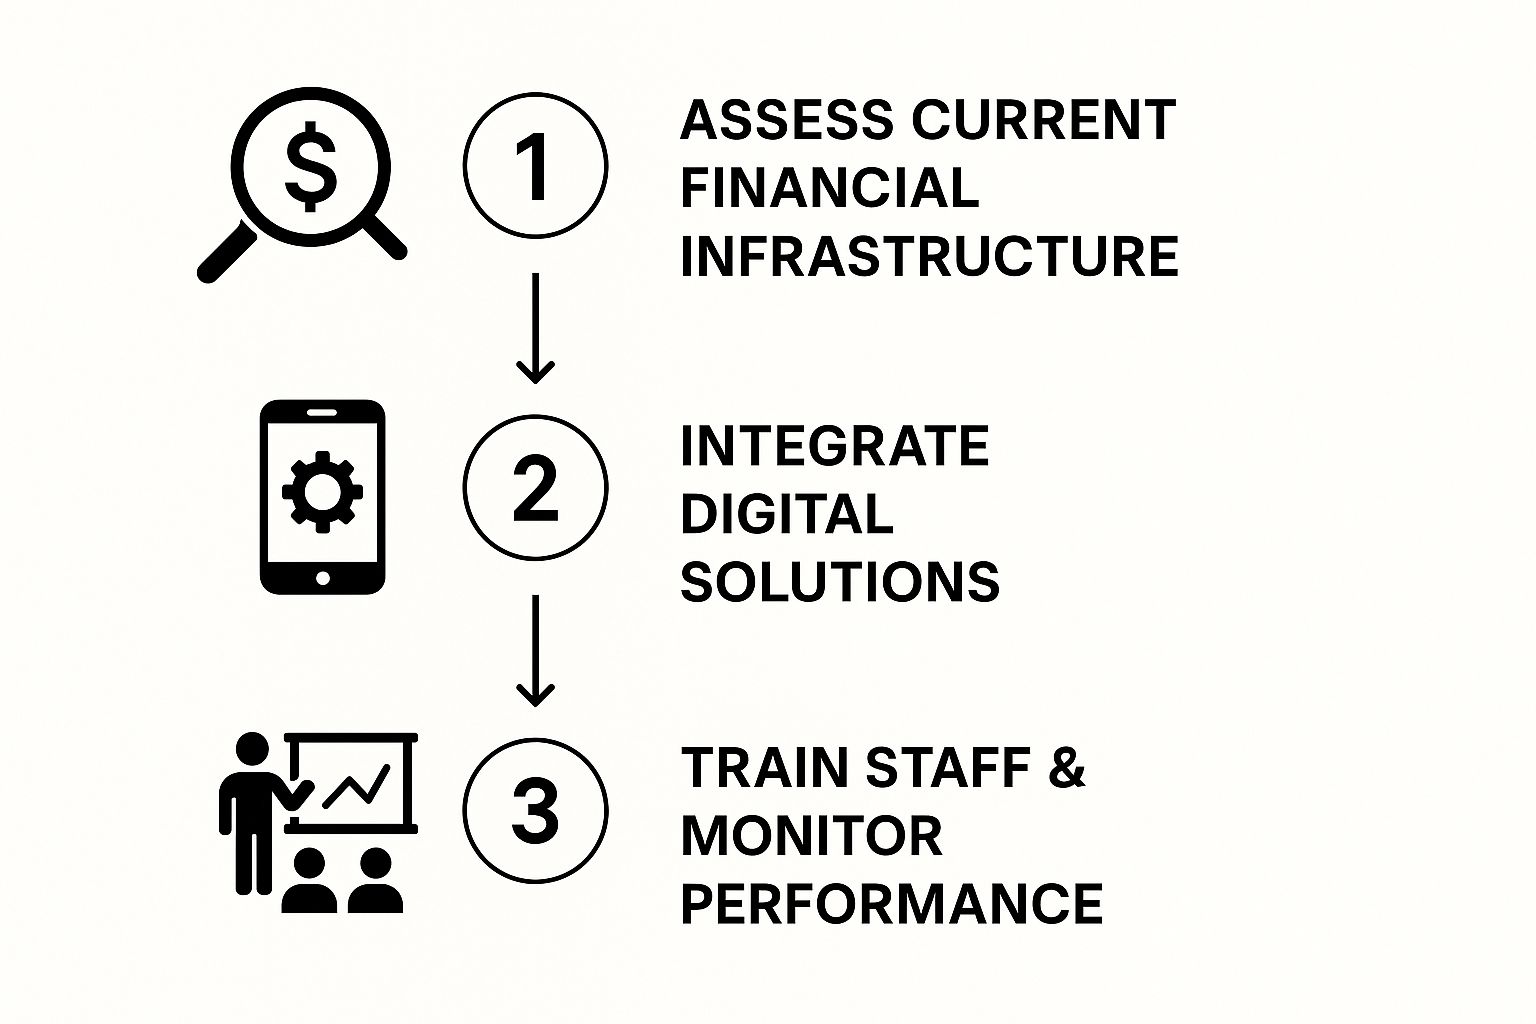
As you can see, it’s a logical flow. We start by understanding where you are today before we start building a better future with new tools and processes.
Step 1: Map The Territory
Before you can build anything new, you need a solid blueprint. The first phase is all about mapping your current data landscape and getting crystal clear on what success actually looks like for your business. Honestly, this is the most critical step. It ensures we’re solving the right problems from the get-go.
We start by sitting down with you to figure out the key business questions you need to answer. What metrics truly drive your business forward? It’s not about tracking everything under the sun; it’s about tracking what actually matters.
Here’s what this phase involves:
- Auditing Your Data Sources: We dig in and find where all your critical information lives—from your accounting software and CRM to payment platforms and those dozens of operational spreadsheets.
- Defining Your KPIs: We work with you to pinpoint the Key Performance Indicators tied directly to your strategic goals. This makes sure we’re measuring the things that will actually move the needle.
- Creating the Blueprint: The result is a clear plan of action. It outlines exactly what dashboards we’ll build, what data we’ll connect, and the specific insights you’ll gain.
Step 2: Model Your Data
With the map in hand, we move on to the modeling phase. This is where our technical experts roll up their sleeves and turn your messy, disconnected data into a reliable, automated, and genuinely powerful asset. We do the heavy lifting of building your new financial engine right inside Power BI.
This is the turning point. It’s where your data goes from being a liability—a source of manual work and frustration—to a real strategic advantage. It becomes the bedrock for every important decision you make.
During this stage, our team connects all those data sources we identified, cleans up and structures the information, and builds the robust data models that will power your analytics. From there, we create the core financial and operational dashboards you need, like a real-time Profit & Loss statement, an interactive cash flow forecast, or a sales performance tracker.
The whole point is to establish a single source of truth. If you’re not familiar with the term, learning why establishing a single source of truth for your data is so fundamental is a game-changer for eliminating reporting errors and getting everyone on the same page.
Step 3: Mobilize Your Team
A powerful dashboard is completely useless if it just sits there collecting digital dust. The final—and arguably most important—step is to mobilize. This is all about embedding these new tools and insights into the daily and weekly rhythms of your business. After all, technology alone doesn’t create change; people and processes do.
This phase is focused on adoption and empowerment. We don’t just build a dashboard, hand over the keys, and walk away. We provide hands-on training for you and your team, making sure everyone is comfortable using the new tools to find answers and make smarter decisions.
We’ll help you set up new reporting cadences and meeting structures that put data at the heart of the conversation. This final step is what makes the transformation stick, creating a lasting culture of clarity and confidence that helps you scale your business the right way.
How This Transformation Changes the Game for SMB Leaders
Let’s get one thing straight: digital transformation in finance isn’t just about swapping out old software for new. It’s about a fundamental shift in how you lead your business. You move from getting bogged down in the technical ‘how’ of gathering numbers to focusing on the strategic ‘why’—and that’s where the real magic happens. This is how your financial data stops being a history lesson and becomes your biggest competitive advantage.
When your reporting runs on its own and the data is solid, you’re no longer spending your days chasing down numbers. Instead, you’re using them to make smarter, faster decisions. You’re out of the spreadsheet mines and in the driver’s seat, steering the company with a clear view of the road ahead.
Finally Get a Clear, Real-Time View of Your Business
The most powerful, immediate change you’ll see is the jump from static, month-end reports to live, interactive dashboards. This gives you a level of visibility that feels like a superpower, letting you see around corners and catch small issues before they snowball into big problems.
Picture this: you log in on a Tuesday morning and see your most important metrics—revenue, gross margin, customer acquisition cost—all right there, updated to the minute. You notice that the profit margin on one of your key product lines has dipped slightly over the last three weeks. With your old spreadsheets, you wouldn’t have spotted that until you were closing out the quarter. Now, with a Power BI dashboard, you’re seeing it happen in real-time.
This lets you ask the right questions, right away:
- Is this a pricing problem? You can drill down into the sales data to see if a recent promotion is eating into your margins.
- Are our costs creeping up? A quick look at expense data can tell you if the cost of goods sold has increased.
- Is it happening in a specific region? You can filter by location to isolate exactly where the issue is coming from.
This kind of proactive problem-solving is simply impossible when you’re stuck waiting weeks for someone to compile a report.
Get Your Entire Team on the Same Page
How many meetings have been wasted arguing over whose numbers are right? Finance has one spreadsheet, the sales team has a different one pulled from the CRM, and you spend the whole time debating the data instead of deciding what to do with it. A true financial transformation creates a single source of truth.
When everyone is working from the same unified data, those arguments just… disappear. Finance, operations, and sales are all looking at the same KPIs. This builds trust and creates a culture where conversations are about strategy and solutions, not about who has the “correct” spreadsheet.
This fundamentally changes the finance team’s role. It’s no longer just about reporting on what happened last month. It’s about giving the entire organization the tools to plan, forecast, and execute with confidence. As a recent analysis from Deloitte points out, the companies best positioned to thrive were those with clear digital roadmaps and modern finance operations. This isn’t just a “nice-to-have”; it’s essential for future-proofing your business. You can read more about Deloitte’s 2025 finance predictions on their site.
Scale Your Business with Confidence
Every ambitious business owner wants to grow. But trying to scale on a foundation of manual processes and shaky data is like building a skyscraper on sand—it’s just a matter of time before things start to crumble. Automating your financial reporting frees up your most valuable asset: your time.
Instead of losing the first week of every month to Excel hell, you and your team can focus on work that actually moves the needle:
- Fine-tuning your pricing strategy based on real profitability analysis.
- Identifying who your most profitable customers are and finding more like them.
- Proactively managing cash flow to fund your next big growth initiative.
- Building accurate, driver-based forecasts to plan for expansion.
This is what leading with confidence looks like. You’re not reacting to outdated information anymore. You’re making proactive, data-driven decisions that fuel smart, sustainable growth.
Ready to stop managing spreadsheets and start leading with insight? Book a free call with our BI consultants today and discover how Vizule can help you automate your reporting and finally trust your data.
Your Top Questions About Financial Transformation, Answered

Making the jump to a more data-driven finance function is a big move, and it’s smart to ask questions. You’re committing time and resources, and you need to know it’s the right call for your business.
We get it. Here are the honest answers to the most common questions we hear from founders and business leaders, designed to cut through the noise and give you a clear picture of what to expect.
“Is this kind of thing only for big corporations?”
That’s a myth we’re happy to bust. The answer is a hard no. Not too long ago, sophisticated business intelligence tools were incredibly expensive and complex, which kept them locked away in enterprise-level companies.
But the game has completely changed. Modern tools like Microsoft Power BI have put world-class analytics within reach for businesses of any size. The subscription costs are a tiny fraction of what legacy systems demanded.
Ultimately, the core principles are universal. Whether you have a team of ten or ten thousand, you need reliable data, automated reporting, and sharp insights to grow. In fact, smaller businesses often see a massive impact even faster because they can adapt and implement changes much more quickly than a corporate giant.
“What does it cost, and what’s the real ROI?”
Thinking about a financial transformation project purely as a cost is missing the bigger picture. It’s an investment in your company’s future—in its efficiency, intelligence, and ability to compete. While the exact price tag depends on how complex your data is and the project’s scope, the return on that investment is where the real story is.
Think for a moment about the cost of not doing this:
- How many payroll hours are burned every month on manual, repetitive reporting tasks?
- What’s the price of a single bad decision that was based on gut-feel or an outdated spreadsheet?
- How many profitable opportunities slipped by because you couldn’t get a clear, fast answer from your data?
The ROI isn’t just a single number; it’s a wave of positive changes. You see it in the hours your team gets back through automation, the costly mistakes you sidestep by having a single source of truth, and the new revenue you generate by spotting trends before anyone else. This investment pays for itself by turning your finance team from a cost center into a strategic engine for growth.
“My data is a total mess. Where would we even start?”
If you feel like your data is a chaotic mix of spreadsheets, accounting software, and CRMs that don’t talk to each other, you’re not alone. In fact, that’s the starting point for almost every business we partner with.
Here’s the good news: you don’t have to untangle that mess by yourself. A core part of any successful transformation project is bringing order to that chaos.
The very first step is mapping out all your different data sources and then building the digital “plumbing” to pull everything into one clean, central hub. We handle the technical heavy lifting of cleaning, standardizing, and structuring your information. A messy start isn’t a roadblock; it’s the entire reason projects like this are so valuable.
“I’m not a tech expert. How will my team adapt?”
This is a completely fair question, especially for non-technical founders and leaders. The idea of dropping a new data system on your team can feel daunting.
But here’s the key: modern analytics tools are built for regular business users, not data scientists. The objective isn’t to force your team to learn complex software. It’s to give them simple, intuitive dashboards that feel more like using a well-designed website.
Expert guidance is what makes the transition smooth. We don’t just build a tool and walk away.
- Designed for Humans: We create dashboards that are clean, visually clear, and built to answer your most critical questions at a glance.
- Practical Training: Our training is hands-on and tailored to your team, showing them exactly how to use the reports to make their jobs easier.
- Ongoing Partnership: We stick around. As your business grows and your questions evolve, we’re here to help you adapt your tools accordingly.
This is about empowerment, not complication. With the right setup and support, your team will quickly embrace a smarter, data-driven way of working.
Ready to stop wondering and start building? The team at Vizule is here to guide you, helping turn your data chaos into a clear competitive advantage.
Connect with us to design your financial dashboard in Power BI


