


As a business owner or operator, you rely on data to make critical decisions. But what happens when your reports are built on a foundation of 'dirty data'? Duplicate customer entries in your CRM, missing sales figures in your financial model, and inconsistent formatting across spreadsheets aren't just minor annoyances—they are silent profit killers. This is the root cause of unreliable KPI dashboards, inaccurate forecasts, and countless hours wasted manually correcting data before you can even begin analysis. The problem isn't your strategy; it's the integrity of your data.
Many SMBs get stuck trying to wrangle information directly in Excel. While understanding the basics is useful (for a deep dive, check out How to Clean Data in Excel Like a Pro), this manual approach simply doesn't scale. Before you can unlock the power of automated, insight-led decision-making with tools like Power BI, you must first clean house.
This guide cuts through the technical jargon to provide a practical, founder-friendly roadmap. We'll explore nine essential data cleansing techniques that transform messy, siloed information into a single source of truth. By implementing these methods, you can build a reliable data pipeline, automate your reporting stack, and finally gain the confidence to trust your numbers and scale your business intelligently. Forget the guesswork and start making decisions based on data you can count on.
1. Taming the Clones: Mastering Data Deduplication
Duplicate data is more than just a minor annoyance; it’s a direct threat to your financial reporting and operational efficiency. Data deduplication is one of the most fundamental data cleansing techniques, involving the identification and removal of redundant records from your datasets. The goal is to ensure every unique entity—whether a customer, product, or transaction—is represented only once.
For a growing SMB, unchecked duplicates lead to costly errors. Imagine your sales team contacting the same lead multiple times, frustrating a potential customer, or your finance department overestimating customer lifetime value because one client exists under three different spellings. This technique systematically prevents such issues, creating a single source of truth that is essential for building an accurate forecasting model or a reliable cash flow report.
How Deduplication Works in Practice
Deduplication isn't a simple "find and delete" operation. It uses smart algorithms to compare records across multiple fields.
- Exact Matching: This is the simplest form, identifying records that are identical based on a unique identifier like an email address, customer ID, or transaction number.
- Fuzzy and Probabilistic Matching: These advanced methods identify likely duplicates even with minor variations, such as typos ("John Smith" vs. "Jon Smyth"), different address formats, or incomplete data. They often assign a probability score to potential matches, allowing for a more nuanced review.
For example, a bank might use deduplication to consolidate a single customer's profile from their checking account, mortgage, and credit card systems into one master record. This provides a holistic view for both customer service and risk assessment. Similarly, e-commerce giants like Amazon use it to merge multiple listings for the same product from different sellers, improving the customer shopping experience.
This infographic summarises the core components of a successful data deduplication strategy.
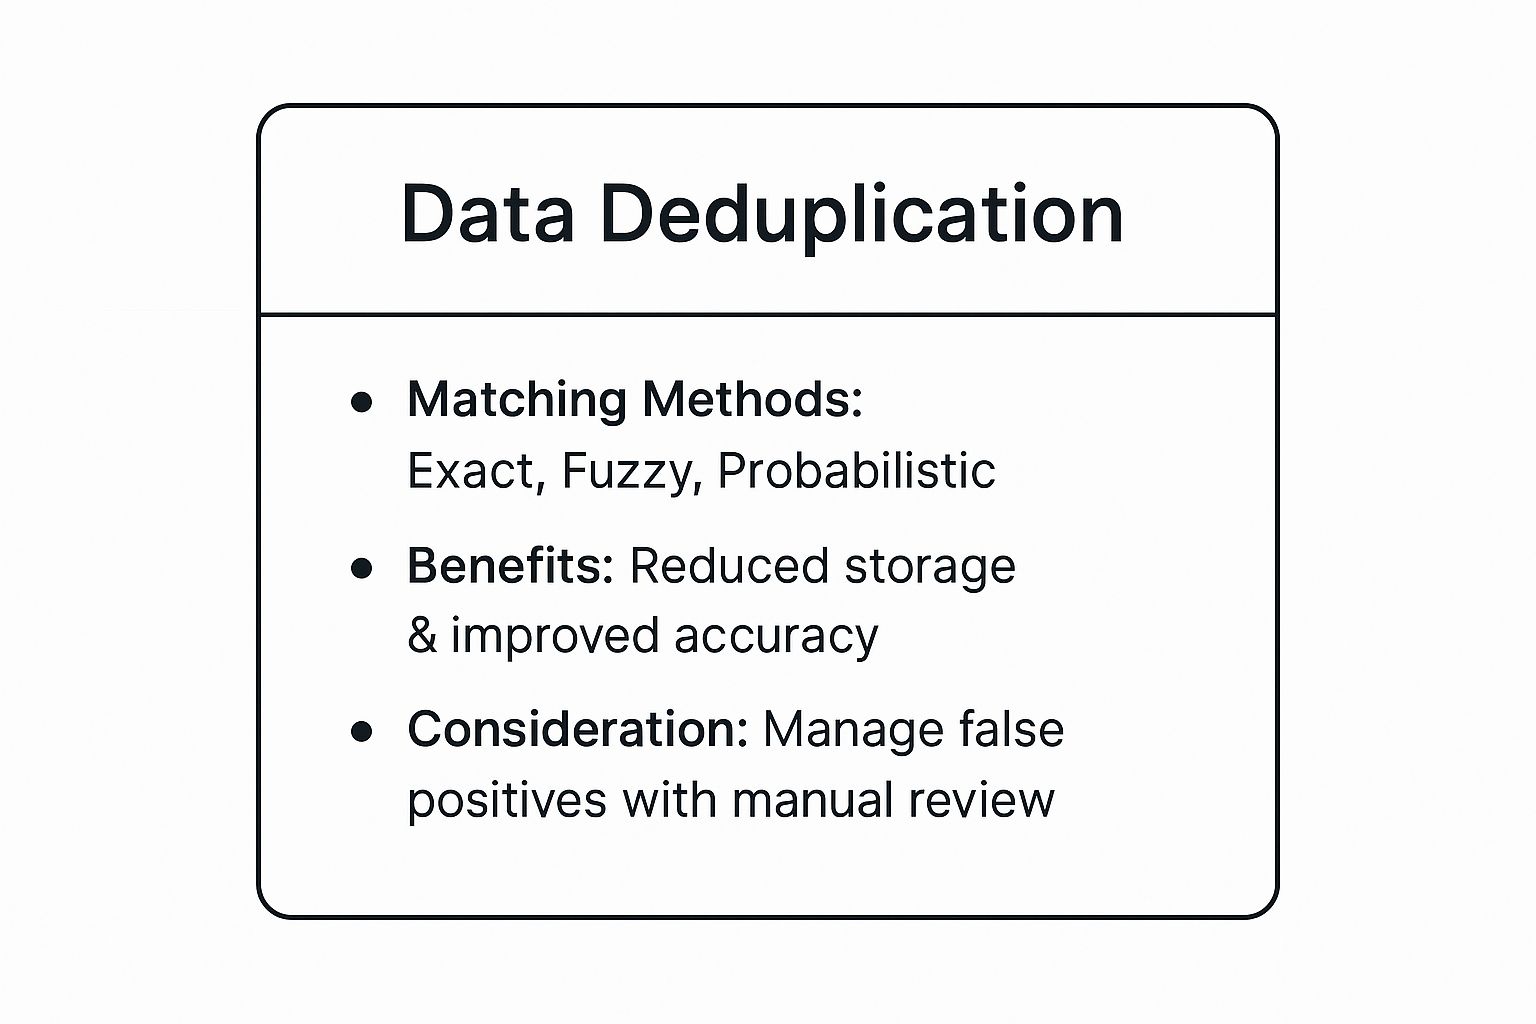
As the summary highlights, the key is to balance automated matching methods with strategic oversight to manage potential inaccuracies.
Actionable Tips for Effective Deduplication
To implement this technique effectively, always start with a clear plan.
- Prioritize Unique Identifiers: Begin by running exact match routines on clear unique identifiers like email addresses or customer IDs. This is the low-hanging fruit and carries the lowest risk of error.
- Combine Fields: For more complex fuzzy matching, use a combination of fields (e.g., Name + Address + Date of Birth) to increase the accuracy of your duplicate detection and reduce false positives.
- Establish a Merge Strategy: Before deleting anything, define your "golden record" rules. Decide which record to keep based on criteria like completeness or the most recent update, ensuring you don't lose valuable information during the merge.
- Backup Everything: Never perform a bulk deduplication process on your live database without a complete, verified backup.
Mastering deduplication is the first critical step toward building a data foundation you can trust. If you're struggling to consolidate customer data or clean up your sales pipeline, book your free BI consultation to see how Vizule can help automate your reporting stack.
2. Forging Consistency: The Power of Data Standardization
Inconsistent data formats are silent saboteurs of accurate financial analysis and operational reporting. Data standardization is the crucial process of converting data into a common, consistent format, ensuring that values representing the same information are structured identically. Without it, simple tasks like comparing sales across regions or calculating quarterly revenue become exercises in frustration and error, pulling your team back into Excel chaos.
For finance and ops teams, the lack of standardization obscures critical insights. Imagine trying to aggregate sales data where one system records dates as "DD-MM-YY" and another as "Month D, YYYY." This technique eliminates such discrepancies, creating a unified dataset that is reliable for reporting, analytics, and financial modelling. It ensures that when you compare apples to apples, they are all measured the same way.
How Standardization Works in Practice
Standardization involves creating and enforcing a set of rules to govern data formats across your entire ecosystem. This isn't just about dates; it applies to addresses, currencies, units of measurement, and categorical text.
- Rule-Based Conversion: This involves applying specific logic to transform data. For example, converting all state names to a two-letter abbreviation ("California" to "CA") or ensuring all currency values are stored in USD with two decimal places.
- Pattern Matching: Using tools like regular expressions, this method identifies and reformats data that follows a specific pattern. It's highly effective for cleaning up phone numbers, postal codes, or custom product SKUs to fit a required structure.
A clear example is in global finance, where institutions use the ISO 20022 messaging standard to ensure transaction data is uniform across different banks and countries. Similarly, healthcare systems rely on standards like FHIR to make patient data interoperable. This level of consistency is what allows for seamless data exchange and trustworthy aggregation.
Actionable Tips for Effective Standardization
A proactive approach is key to implementing data standardization successfully.
- Create a Data Dictionary: This is your rulebook. Document every standardization rule, from date formats (e.g., ISO 8601: YYYY-MM-DD) to approved abbreviations and naming conventions. This becomes the single source of truth for your team.
- Leverage Industry Standards: Don't reinvent the wheel. Where possible, adopt established standards like ISO for currencies and dates or USPS formats for addresses. This enhances interoperability with external systems.
- Preserve the Original: Before applying any transformation, store a copy of the original data in a separate field. This provides an audit trail and allows you to revert changes if a rule was applied incorrectly.
- Implement Validation Rules: Enforce standardization at the point of data entry. Use dropdown menus, input masks, and validation checks in your systems to prevent inconsistent data from being created in the first place.
Standardization transforms chaotic data into a structured asset, paving the way for reliable reporting and analytics. If inconsistent formats are hindering your ability to build accurate financial models, book your free BI consultation to see how Vizule can establish a single source of truth for your business.
3. Filling in the Blanks: The Art of Missing Value Imputation
Incomplete data is a silent killer of accurate financial models and reliable KPI dashboards. Missing value imputation is a powerful data cleansing technique that addresses this by strategically replacing null or missing values with substituted data. Instead of discarding entire records with gaps—which can shrink your dataset and introduce bias—imputation preserves your data’s volume and structural integrity.
For finance teams, this is critical. A single missing sales figure or an absent cost entry can invalidate an entire profitability analysis or break a forecasting model. Imputation allows you to create a complete picture by using statistical methods to estimate what those missing values likely were, ensuring your reports are comprehensive and your models run without errors.
How Imputation Works in Practice
Imputation is far more sophisticated than just plugging in an average. The method chosen depends entirely on the nature of the data and the reasons it's missing.
- Statistical Methods: These are the most common approaches. They include replacing missing values with the mean, median, or mode of the column. More advanced techniques like regression imputation predict the missing value based on its relationship with other variables in the dataset.
- Machine Learning Algorithms: For complex scenarios, algorithms like K-Nearest Neighbors (KNN) find similar data points and use their values to estimate the missing one. This is particularly effective for preserving the underlying relationships within the data.
For example, a healthcare analytics platform might impute a patient's missing heart rate reading by looking at their previous readings and data from other patients with similar profiles. Similarly, credit scoring agencies use advanced imputation to estimate missing financial details in a credit history, allowing them to produce a more complete risk assessment.
Actionable Tips for Effective Imputation
Implementing imputation requires careful thought to avoid distorting your data’s true story.
- Understand the "Why": Before imputing, analyze the pattern of missingness. Is it random, or is there a systematic reason? This understanding will guide your choice of imputation method.
- Use Domain Knowledge: Don't just rely on algorithms. Use your business expertise to set reasonable upper and lower bounds for imputed values. For instance, a negative value for "units sold" is impossible and should be constrained.
- Document and Flag: Always create a new column or flag to indicate which values were imputed. This transparency is crucial for future analysis and auditing, preventing imputed data from being treated as original source data.
- Consider Multiple Imputation: For critical financial models, use multiple imputation. This technique creates several completed datasets with different imputed values, allowing you to account for the uncertainty introduced by the imputation process itself.
By intelligently filling the gaps, you ensure your analytical foundation is solid. If missing data is derailing your cash flow reporting, book your free BI consultation to see how Vizule can help build a robust and complete data pipeline.
4. Spotting the Anomalies: Outlier Detection and Treatment
Outliers are data points that sit uncomfortably far from the norm, and they can severely skew your financial forecasts and operational metrics. Outlier detection is a critical data cleansing technique used to identify these anomalies, which could be genuine extreme values, data entry mistakes, or measurement errors. The process involves using statistical methods and domain expertise to decide whether to remove, adjust, or simply flag these unusual data points.
For an SMB operator, undetected outliers lead to flawed conclusions. A single misplaced decimal in a sales entry could inflate revenue projections, or an erroneous sensor reading could trigger a false alarm in your supply chain. This technique ensures that your analysis is based on a true representation of your business activity, preventing extreme values from distorting the bigger picture.

How Outlier Detection Works in Practice
Identifying outliers requires a mix of statistical rigour and business context. It's not just about deleting the highest and lowest values; it's about understanding why they exist.
- Statistical Methods: Techniques like the Interquartile Range (IQR) method or Z-scores are used to define a "normal" range. Data points falling outside this range are flagged as potential outliers.
- Machine Learning Algorithms: More advanced models, such as Isolation Forest or Local Outlier Factor, can identify complex patterns and anomalies in large, multi-dimensional datasets. These are particularly useful for fraud detection or predictive maintenance.
For example, payment processors like Stripe and PayPal use real-time outlier detection to flag potentially fraudulent transactions that deviate from a user's normal spending patterns. Similarly, healthcare systems can identify outlier patient readings (like a sudden spike in heart rate) to alert clinical staff, turning data anomalies into life-saving interventions.
Actionable Tips for Effective Outlier Treatment
Treating outliers requires careful consideration to avoid removing valuable information.
- Investigate First, Act Second: Always investigate the root cause of an outlier before removing it. It could be a simple data entry error that can be corrected, or it might be a legitimate, business-critical event.
- Use Robust Measures: When performing analysis, rely on statistical measures that are less sensitive to outliers, such as the median instead of the mean, to get a more accurate view of the central tendency.
- Consider Capping (Winsorizing): Instead of deleting an outlier, you can cap it by replacing it with the highest or lowest value within your "normal" range. This reduces its skewing effect while retaining the record.
- Document Everything: Keep a clear record of which outliers were identified and the rationale behind your decision to remove, amend, or keep them. This ensures transparency and consistency in your reporting.
Effectively managing outliers is essential for accurate forecasting and reliable analytics. If anomalies in your data are compromising your financial models, book your free BI consultation and let Vizule help you build a reporting framework you can trust.
5. Building a Moat: Data Validation and Verification
While many data cleansing techniques are reactive, data validation is a proactive defense against inaccuracies. It involves creating a set of rules and constraints to check data for correctness and consistency before it enters your database. This technique acts as a gatekeeper, preventing bad data from contaminating your systems and reports in the first place.
For finance and operations leaders, this is crucial. An invalid data entry, whether a mistyped invoice number or an incorrect currency code, directly impacts financial statements and forecasts. By validating data at the point of entry or during import, you establish a first line of defense that ensures higher data quality from the source, maintaining the integrity needed for reliable business planning.
How Validation and Verification Works in Practice
This technique is more than a simple check; it's a multi-layered process that enforces conformity to predefined standards.
- Format Checks: Ensures data conforms to a specific pattern. For example, verifying that a phone number contains only digits and is the correct length, or that a date is in a
YYYY-MM-DDformat. - Range and Constraint Checks: Confirms that data falls within an acceptable range. A healthcare system might validate that a drug dosage is within safe limits for a patient's age and weight.
- Referential Integrity and Cross-Field Checks: This ensures relationships between data points are logical. For instance, tax software validates that a dependent's Social Security number isn't already claimed on another return, maintaining logical consistency across the dataset.
A common example is an e-commerce platform like Shopify, which validates shipping addresses against official postal databases during checkout to reduce delivery failures. Similarly, banking applications use algorithms to validate credit card numbers instantly, preventing transactional errors at the source.
Actionable Tips for Effective Validation
To implement this technique, focus on integrating checks as early in the data lifecycle as possible.
- Validate at the Source: Implement validation rules in data entry forms, APIs, or data import scripts. This is far more effective than cleaning up errors later.
- Provide Clear Error Messages: When validation fails, guide the user with specific feedback. Instead of "Invalid Entry," use "Please enter a valid 10-digit account number."
- Use External Services: For critical data points like addresses, phone numbers, and emails, leverage external validation APIs. To effectively build a moat of accurate data, consider incorporating dedicated email verification tools as part of your proactive validation process.
- Distinguish Between Hard and Soft Rules: Decide which rules trigger a "hard stop" (preventing data submission) versus a "soft warning" (flagging a potential issue for review). This balances data integrity with user experience.
Strong validation is a cornerstone of effective data governance. By proactively ensuring your data is clean from the start, you build a reliable foundation for all your analytics. To learn more about setting these standards, explore these data governance best practices.
6. Data Parsing and Transformation
Raw data often arrives in formats that are unhelpful for direct analysis. Data parsing and transformation is the critical technique of breaking down complex or unstructured data fields into usable, structured components. This process essentially translates messy data into a clean, organised format that analytics tools like Power BI can understand and process.
For finance and ops teams, this is a daily reality. Think of transaction descriptions from a bank statement like "POS-PURCHASE-AMAZON-MKTPLACE-LX45-LONDON". Parsing this single string into separate fields for vendor (Amazon), transaction type (Purchase), and location (London) unlocks granular spending analysis. Without this data transformation, valuable insights remain trapped within disorganized text, making detailed financial reporting nearly impossible.
How Parsing and Transformation Work in Practice
This technique involves applying a set of rules or logic to deconstruct data and then reformat it. It’s a core component of moving data from systems like Excel to Power BI.
- Parsing: This involves breaking down a single data field into multiple fields. For example, splitting a 'Full Name' field ("John David Smith") into 'First Name', 'Middle Name', and 'Last Name'. It also applies to extracting elements from complex strings, like an address or a product SKU.
- Transformation: This is the process of converting data from one format or structure to another. This could mean changing a date format (MM-DD-YYYY to YYYY-MM-DD), converting data types (text to a number), or restructuring data into a flat, tabular format ready for analysis.
For instance, an e-commerce company might parse customer addresses from a single text box into separate columns for street, city, postal code, and country for accurate shipping and demographic analysis. Similarly, financial institutions parse complex transaction descriptions to automatically categorise spending, a process that powers many personal finance apps.
Actionable Tips for Effective Parsing and Transformation
To implement this technique without corrupting your data, a methodical approach is essential.
- Test Against Edge Cases: Before applying parsing logic to an entire dataset, test it against a diverse sample. Include edge cases like missing components, different delimiters, and unusual formats to ensure your rules are robust.
- Use Established Libraries: Don't reinvent the wheel. Leverage powerful, pre-built libraries or functions within tools like Power Query. These are optimised for performance and handle many complexities for you.
- Implement Error Handling: Define what should happen when data doesn't fit your parsing rules. Instead of letting it fail, flag these records for manual review or place them in a separate error log.
- Preserve the Original: Always keep a copy of the original, unparsed data column. This allows you to quality check your parsing logic and provides a reference if you need to adjust your rules later.
Effective parsing and transformation are foundational to preparing data for any meaningful financial modelling or business intelligence. If you need a deeper understanding of this process, you can explore the fundamentals of data transformation here.
7. Data Enrichment and Enhancement
Clean data is foundational, but enriched data is transformational. Data enrichment is a powerful technique that goes beyond cleaning by augmenting your existing datasets with additional, valuable information from internal or external sources. This process turns basic records into comprehensive profiles, enabling deeper insights and more effective business planning.
For an SMB founder, enrichment can be the key to unlocking competitive advantages. Imagine transforming a simple customer list into a strategic asset by adding demographic data for better market segmentation, or appending firmographic details like company size and industry to your sales leads. This technique adds layers of context, making your analytics more potent and your decision-making more precise.

How Enrichment Works in Practice
Enrichment involves matching your records with an external or internal database to append new fields. This can range from simple additions to complex, multi-source data fusion.
- External Data Appending: This is the most common form, where third-party data providers add specific information to your records. For example, a B2B company might use a service to append job titles and contact information to a list of leads, enabling a more targeted sales approach.
- Internal Data Derivation: Enrichment isn't just about outside data. You can also derive new, valuable fields from your existing information. A common example in finance is calculating Customer Lifetime Value (CLV) or customer tenure from transactional history, creating a crucial metric that wasn't explicitly present before.
For instance, a retail company could use an enrichment service to append demographic and lifestyle data to its customer database. This allows for hyper-targeted marketing campaigns and more accurate customer persona development. Similarly, a tech startup could use an API to enrich new sign-ups with company size and technology stack, helping qualify leads automatically.
Actionable Tips for Effective Enrichment
To get the most value from enrichment, approach it strategically to ensure data quality and relevance.
- Verify Data Sources: Before integrating any third-party data, thoroughly vet the provider. Ensure their data is compliant with regulations like GDPR and check its accuracy and refresh frequency.
- Establish a "Match and Merge" Logic: Carefully define the criteria for matching records between your dataset and the enrichment source. Use unique identifiers to avoid misattributing data to the wrong entity.
- Track Data Lineage: Always document where enriched data comes from and when it was added. This is crucial for maintaining data governance, troubleshooting issues, and managing data freshness over time.
- Start with Internal Derivations: Begin by creating new fields from the data you already own. Calculating metrics like tenure or lifetime value is a low-cost, high-impact way to enhance your analytical capabilities.
Data enrichment elevates your data from a simple record-keeping tool to a strategic intelligence asset. If you want to transform your raw data into actionable business insights, connect with us to design your financial dashboard in Power BI.
8. Data Type Correction and Conversion
Data type correction involves identifying fields stored with incorrect data types—like numbers stored as text or dates saved as strings—and converting them to the proper format. Without this, financial models miscalculate totals, date-based forecasts break, and Power BI dashboards deliver misleading insights. For any operator relying on a KPI dashboard, enforcing correct data types is essential for reliable, automated reporting.
How Data Type Correction Works in Practice
The process is straightforward but critical, especially when moving from Excel to Power BI:
- Schema Inference: Tools like Power Query automatically scan sample values to infer if a column should be numeric, date, text, or boolean.
- Explicit Conversion: If the auto-detection is wrong, you apply functions to manually recast the fields (e.g., converting a text field of '1,000' to a whole number).
- Error Handling: Good processes will flag conversion failures for review instead of just deleting the problematic record.
- Preservation: Best practice involves keeping a copy of the original columns in a staging query for audit and rollback purposes.
A classic SMB example is losing leading zeros on product IDs when importing a CSV into Excel, because Excel incorrectly assumes the column is numeric. Enforcing a "Text" format in Power Query prevents this. Similarly, turning text-based revenue values like "$1,500.50" into a decimal number data type is what enables correct sum and average calculations in your financial model.
Actionable Tips for Effective Type Conversion
- Profile Before You Convert: Run a quick data profile to spot irregular patterns or outliers that might cause conversion errors.
- Test on Samples: Execute conversions on a small subset of data first to catch any unexpected issues.
- Preserve Originals: Keep raw columns in separate, non-loading queries to support troubleshooting.
- Use Explicit Functions: Rely on the explicit conversion tools in your BI platform rather than hoping for implicit coercion.
- Handle Conversion Errors: Route invalid conversions to an exception report instead of letting them fail silently.
- Validate Post-Conversion: Briefly check value distributions and ranges against your business logic.
- Respect Locale Settings: Watch for different decimal separators (
,vs.) and date formats in global datasets. - Automate in ETL/ELT: Build these conversion steps into your scheduled data pipelines using tools like Power Query for BI automation.
Proper data type correction is the bedrock of a robust analytics stack. If you’re battling misaligned data, see how Vizule can help automate your reporting stack.
9. Error Detection and Correction
Small inaccuracies in your data, like typos and misspellings, might seem trivial, but they quickly cascade into significant reporting errors and operational headaches. Error detection and correction is a data cleansing technique focused on systematically identifying and fixing these mistakes, from simple transposition errors to complex logical inconsistencies. The goal is to enforce accuracy and uniformity across your datasets.
For a finance team, a single typo in a product code or a misspelled supplier name can disrupt everything from inventory management to accounts payable. This technique uses powerful algorithms and reference lists to prevent such issues, ensuring that your financial models and operational dashboards are built on a foundation of clean, reliable data. Without it, you risk making critical decisions based on flawed information.
How Error Detection Works in Practice
This process goes beyond a simple spell check, employing a variety of methods to find and fix errors with precision.
- Algorithmic and Rule-Based Checks: This involves using algorithms to measure the difference between two strings, identifying likely typos. You can also apply custom business rules, such as flagging a transaction date that falls on a public holiday when the business was closed.
- Reference Data Validation: This method cross-references your data against authoritative lists. For example, validating a list of customer addresses against a certified postal service database to correct and standardize entries.
- Phonetic Matching: Algorithms like Soundex are used to identify words that sound similar but are spelled differently. This is crucial for consolidating records for names like "Smyth" and "Smith."
Google’s "Did you mean?" search suggestion is a famous example, correcting user typos in real-time. Similarly, a tool like Grammarly uses sophisticated checks to fix spelling and grammar errors instantly, demonstrating the power of automated correction.
Actionable Tips for Effective Error Correction
A robust strategy combines automation with human oversight to maintain data integrity.
- Build Comprehensive Reference Lists: Create and maintain master lists for validation. Use these for validating data entries like city names, product SKUs, or department codes to catch invalid entries at the source.
- Implement Confidence Scoring: Not all corrections are certain. Use confidence scores to decide when to auto-correct an error (high confidence) versus flagging it for manual review (low confidence), balancing efficiency with accuracy.
- Log All Changes: Maintain a detailed audit trail of every correction made. This is essential for compliance, quality monitoring, and understanding the root causes of data quality issues over time.
- Prioritize High-Impact Errors: Focus your initial efforts on correcting errors in critical data fields that directly impact financial reporting, customer communication, or key operational processes.
Implementing these error correction strategies is a key step to improve your data quality and the reliability of your analytics. To learn more about building a robust data quality framework, you can explore our guide on how to improve data quality.
Data Cleansing Techniques Comparison Matrix
| Technique | Implementation Complexity 🔄 | Resource Requirements ⚡ | Expected Outcomes 📊 | Ideal Use Cases 💡 | Key Advantages ⭐ |
|---|---|---|---|---|---|
| Data Deduplication | Medium to High – involves complex matching rules and manual review | High – computationally expensive for large datasets, needs configuration | High – improved data quality, reduced redundancy | CRM systems, e-commerce, banking data consolidation | Reduces storage, improves accuracy, enhances analysis |
| Data Standardization | Medium – requires domain knowledge and ongoing updates | Medium – initial setup and maintenance effort | Medium to High – consistent, comparable data | Healthcare, finance, address normalization | Enables accurate matching, improves integration, reporting |
| Missing Value Imputation | Medium to High – choosing and tuning appropriate statistical/machine learning methods | Medium to High – can be computationally intensive | High – preserves data volume and improves model performance | Survey data, healthcare, credit scoring | Maintains dataset integrity, allows analysis without deletion |
| Outlier Detection and Treatment | Medium – variety of statistical and ML methods, requires domain insight | Medium – resource needs depend on dataset and method complexity | Medium to High – improved model accuracy, error identification | Fraud detection, manufacturing sensors, clinical data | Identifies errors, prevents skewed results, reveals anomalies |
| Data Validation and Verification | Low to Medium – defining rules and constraints upfront | Low to Medium – automated checks at entry points | High – prevents bad data entry, reduces downstream costs | Data entry systems, e-commerce checkout, financial systems | Proactively maintains data quality, reduces errors early |
| Data Parsing and Transformation | Medium to High – complex parsing and pattern recognition | Medium – processing of unstructured data can be intensive | Medium to High – structured data from complex formats | Unstructured logs, nested JSON/XML, name and address parsing | Enables analysis of unusable data, improves granularity |
| Data Enrichment and Enhancement | Medium – integration with multiple external/internal sources | High – data purchase cost and ongoing updates | High – richer profiles, better analytics | Marketing, sales prospecting, location-based services | Augments data value, fills gaps, improves targeting |
| Data Type Correction and Conversion | Low to Medium – automated tools exist but careful handling needed | Low to Medium – often built into ETL or analysis tools | Medium – proper operations and improved query performance | Data migrations, preprocessing for analytics | Prevents errors, improves storage and processing efficiency |
| Error Detection and Correction | Medium to High – multiple algorithms, requires reference data | Medium to High – depending on methods and data volume | High – improved accuracy and reliability | Search engines, address verification, spelling correction | Automates corrections, improves matching, reduces manual effort |
From Cleansing to Clarity: Automate Your Reporting Stack
We've walked through the essential data cleansing techniques, from foundational steps like deduplication to advanced processes like data enrichment. Each method is a critical building block in transforming your raw, often chaotic, data into a pristine, reliable asset. For SMB owners and operators, mastering these techniques isn't just a technical exercise; it's a strategic imperative. It's the difference between a financial forecast built on guesswork and one grounded in verifiable truth.
The journey from messy spreadsheets to automated, dynamic dashboards is paved with these deliberate data quality improvements. By consistently applying validation rules, correcting data types, and standardizing formats, you lay the groundwork for a robust business intelligence system. This is how you move beyond reactive, manual reporting that consumes countless hours and instead embrace a proactive, insight-led culture. When your team trusts the data, they can shift their focus from reconciling numbers to interpreting them, asking "why" instead of "is this right?"
Key Takeaways: From Theory to Actionable Strategy
The true power of these data cleansing techniques is unleashed when they are integrated into an automated workflow. This is where the real transformation for your business begins.
- Foundation First: Techniques like data standardization and type correction are the bedrock. Without this fundamental consistency, advanced analytics and financial models will inevitably fail or produce misleading results.
- Context is King: Outlier detection and missing value imputation are not one-size-fits-all. The right approach depends entirely on your business context, whether you're analyzing sales transactions, financial statements, or operational metrics.
- Automation Unlocks Value: Manually cleaning data is unsustainable. The goal is to build these cleansing steps into an automated data pipeline using a tool like Power Query within Power BI. This ensures every report and dashboard is consistently powered by clean data without manual intervention.
- Cleansing is a Continuous Process: Data quality is not a project with an end date; it's an ongoing discipline. As your business evolves and new data sources are added, your data cleansing strategies must adapt to maintain the integrity of your single source of truth.
Ultimately, the goal is to create an ecosystem where clean data is the default, not the exception. This is the fuel for every powerful business intelligence engine, from driver-based financial models in Power BI to dynamic KPI dashboards that align your entire organization. By mastering these data cleansing techniques, you are not just cleaning data; you are building a resilient foundation for scalable growth and confident, data-driven decision-making.
Ready to move beyond manual reporting and finally trust your data? At Vizule, we specialize in implementing these data cleansing techniques within Power BI to build robust financial models and automated dashboards for SMBs. We connect the dots in your data so you can focus on driving your business forward with clarity and confidence. Book your free BI consultation today and discover how to turn your data chaos into your most valuable asset.


