


A data product is a business-focused solution that turns your raw, messy data from various systems into a clear, reliable, and automated output—like an interactive Power BI dashboard. It’s designed to answer your most critical questions on demand. Think of it as the bridge that takes you from being overwhelmed by numbers to making confident, insight-led decisions.
Your Business Is Drowning in Data but Starving for Insight
Let's be honest. As a founder or operator, you're sitting on a mountain of information. You have sales figures in HubSpot, payment data in Stripe, financial records in Xero, and operational metrics scattered across countless spreadsheets.
Yet, when it comes to Monday morning's leadership meeting, getting a straight answer to a simple question feels like an impossible task. You spend hours manually pulling numbers, pasting them into Excel, and trying to make sense of it all. By the time the report is built, you're already questioning its accuracy. This weekly scramble doesn't just waste time; it erodes your confidence in the very data meant to guide you.
From Manual Reporting Chaos to Data Product Clarity
This constant cycle of data chaos is precisely the problem that data products are built to solve. Instead of seeing it as a complex technical tool, think of it as the ultimate solution to your reporting headaches. A well-designed data product acts like an automated member of your team, working 24/7 to connect the dots for you.
It elegantly combines information from different sources into a single, trustworthy view. The result? A refined, reliable output that serves a specific business purpose.
A data product isn't just about showing you numbers; it's about delivering answers. It's built with you, the business user, in mind, ensuring the insights are not only accurate but also immediately actionable.
Before a data product can deliver these powerful insights, the groundwork has to be solid. Organizations first need to implement effective data management strategies to ensure the data feeding the system is clean, consistent, and ready for analysis.
Imagine replacing that frantic spreadsheet scramble with a live Power BI dashboard. The table below illustrates the shift perfectly.
From Manual Reporting Chaos to Data Product Clarity
| Common Manual Challenge | Data Product Solution |
|---|---|
| Data Silos: Information is trapped in different systems (HubSpot, Xero, spreadsheets). | Centralized Hub: All data sources are automatically connected into a single, unified view. |
| Time-Consuming Reports: Hours are spent each week manually compiling and updating spreadsheets. | Automated Dashboards: Reports are always live and update in real-time without any manual effort. |
| Questionable Accuracy: Manual data entry and copy-pasting lead to errors and a lack of confidence. | Trusted Source of Truth: Data is cleansed and validated automatically, ensuring you can trust the numbers. |
| Reactive Decisions: You're always looking at last week's or last month's data. | Proactive Insights: Real-time metrics allow you to spot trends and make decisions on the fly. |
With a data product, you can finally get immediate answers to critical questions like:
- What is our real-time customer acquisition cost by marketing channel?
- Which product lines have the highest profit margins this quarter?
- Are we on track to meet our cash flow projections for the next 90 days?
That's the power of treating your data as a product. It's about building a dependable asset that empowers you to stop chasing numbers and start driving growth.
Thinking of Data Products Like Financial Statements

To really get your head around what data products are, let's use an analogy every business owner knows inside and out: financial statements.
You'd never dream of making a critical business decision by digging through a raw, unsorted list of bank transactions. It’s a complete mess—impossible to make sense of and totally unreliable for steering the ship.
Instead, you rely on a polished, trustworthy Profit & Loss statement or a Cash Flow report. These documents take countless raw inputs—invoices, payroll, expenses, revenue—and transform them into a clean, reliable output built for one specific job. A well-designed data product does exactly the same thing.
It takes the messy, raw data from all your different systems—your CRM, accounting software, operational tools—and turns it into a valuable asset. This could be anything from a sales forecasting model to a customer health dashboard or an automated marketing report. The point is, it’s built to give you a clear, dependable picture you can actually act on.
The Core Qualities of a True Data Product
Unlike a one-off spreadsheet report that goes stale the minute you create it, a genuine data product is a living, managed asset. It’s designed from the ground up to serve you, the end-user, and has several key characteristics that make it so powerful.
These qualities are what separate it from just another report, turning it into a sustainable tool that delivers continuous value.
- It’s User-Centric: A data product is built to solve a specific problem for its user. A sales dashboard, for example, isn’t just a random collection of charts; it’s designed to help a sales manager instantly see which reps are hitting their targets and which deals need a nudge.
- It’s Trustworthy and Reliable: The data is cleansed, validated, and automatically refreshed. This kills the manual errors and constant second-guessing that plague Excel-based reporting, creating a single source of truth your whole team can depend on.
- It’s Built for a Clear Purpose: Every data product has a job to do. One might track operational efficiency to cut costs, while another monitors customer churn to boost retention. This laser focus ensures it delivers actionable insights, not just interesting-but-useless information.
Think of a data product like a well-oiled machine. It has an owner, a clear function, and undergoes continuous improvement. It’s not a static document; it’s an operational asset designed to evolve with your business.
From Raw Data to Refined Asset
The journey from raw data to a finished data product looks a lot like the process of financial accounting. Just as an accountant follows strict rules to turn transactions into a balance sheet, a data consultant follows a clear process to turn raw data into an insightful dashboard.
This process involves a few key steps:
- Connecting the Sources: We start by securely linking to your various software platforms—think Xero, HubSpot, or Stripe—to pull in all the raw data.
- Cleaning and Modelling: Next, we transform that raw information. This means cleaning up inconsistencies, standardizing formats, and building a logical data model that connects different datasets. For instance, we can link a customer from your CRM directly to their payment history in Stripe.
- Designing the Output: Finally, we create the end product, whether it’s an interactive Power BI dashboard, an automated report, or a predictive model. The design is always focused on making the insights easy for a non-technical user to understand and act on.
This structured approach is what separates a robust data product from a simple report. It guarantees the final output isn't just a one-time snapshot but a durable, automated asset that empowers confident, data-backed decisions day after day.
Ready to transform your scattered data into a clear, reliable asset? Book your free BI consultation with Vizule, and let's discuss how we can build your first data product.
Why Data-Driven Decisions Are No Longer Optional

It’s easy to look at your company’s data headaches—the siloed spreadsheets, the endless manual reporting—and think they’re just your problems to solve. But they're symptoms of a much bigger shift. We're living through an explosion of data, which creates both a massive opportunity and a huge risk if you fail to keep up.
The sheer amount of information being churned out every single day has made old-school manual analysis completely obsolete. Trying to manage it all in Excel is like trying to empty the ocean with a bucket. It's a losing battle. This reality is exactly why investing in a data product isn't a luxury anymore; it’s a competitive necessity.
The Unstoppable Data Tsunami
To get a real sense of the scale here, just look at the numbers. By 2025, it’s estimated that the world will generate a staggering 181 zettabytes of data. A single zettabyte is a billion terabytes—a number so big it’s hard to wrap your head around. This is all coming from the 30 billion connected devices expected to be online.
Even more shocking? A remarkable 90% of all the world's data was created in just the last two years. You can discover more about these data trends for 2025 and what they mean for businesses, but the takeaway is clear. This isn't just a big-business trend; it directly impacts your company. Every customer interaction, sale, and marketing click adds to your data footprint, creating a rich but chaotic resource.
Navigating this data-rich environment without the right tools is like sailing in a storm without a compass. You have plenty of motion but no clear direction, making it impossible to chart a course for growth.
Embracing data products is how you turn this overwhelming flood of information into your greatest asset. It’s the modern way to stay agile, efficient, and ahead of what's next.
From Gut Feel to Data-Backed Confidence
For years, many successful founders have thrived on intuition and experience. That "gut feel" is absolutely invaluable, but it gets a lot riskier when the market moves faster and the competition gets smarter. Relying only on instinct today means you're almost certainly leaving money on the table or, worse, missing critical warning signs.
This is where making the switch to a more structured approach is vital. True data-driven decision-making isn’t about replacing your business instincts; it’s about supercharging them with hard evidence. Our guide on implementing data-driven decision-making in your business dives into how to make this shift practical.
With a data product, you can:
- Validate Your Assumptions: Got a hunch? Test it with real numbers before you bet the farm on a big strategic move.
- Identify Hidden Opportunities: Uncover patterns in customer behaviour or operational metrics that you would have otherwise completely missed.
- Act with Speed and Precision: Respond to market changes in hours or days, not weeks or months, because the insights you need are always right there.
Simply put, using data products is how modern businesses survive and thrive. It lets you move from guessing what works to knowing what works, turning your operations from reactive to proactive.
Real-World Examples of Data Products for Your SMB

Theory is one thing, but seeing what data products are in the wild makes their value click. Let's look at tangible examples that tackle the real, frustrating problems that small business owners face every day.
These aren't just technical tools for data scientists. They are practical solutions built to answer specific, high-stakes business questions. Think about swapping out that manual spreadsheet chaos for an automated asset that works for you 24/7.
Each of these examples is a self-contained product, built with a clear purpose and designed for a business user—not an analyst.
Example 1: The Sales Performance Dashboard
This is easily one of the most powerful, immediate-impact data products for any growing business. Instead of spending hours manually pulling reports from your CRM and accounting software, this Power BI dashboard handles it all for you automatically.
- The Pain Point It Solves: You're flying blind. You have no real idea which reps are hitting their numbers, which regions are lagging, or which product lines are actually making you money until weeks after the month is over.
- How It Works: The dashboard securely plugs into your CRM (like HubSpot) and your accounting system (like Xero). It then merges the data into one cohesive model that updates in real time.
- The Decisions It Enables: At a glance, you can see sales by territory, individual rep performance against quota, and product-line profitability. You can instantly spot which deals are at risk and jump in to save them, making your sales meetings proactive instead of just a review of what went wrong.
Example 2: The Customer Health Scorecard
For any business built on recurring revenue, keeping customers is everything. This data product is your early warning system, flagging at-risk customers long before they even think about canceling.
- The Pain Point It Solves: Customer churn feels totally random and unpredictable. You find out a customer is unhappy only when you get that cancellation email, and by then, it’s far too late.
- How It Works: It pulls together data from multiple touchpoints—support tickets from your helpdesk, product usage logs, and payment history from Stripe. From there, it uses simple business rules to assign a "health score" to every customer, highlighting anyone in the red zone.
- The Decisions It Enables: Your customer success team can finally focus their energy where it matters most. They can proactively reach out to customers with low scores, solve their problems, and turn a potential cancellation into a raving fan.
A data product isn't a static report; it's a dynamic tool that empowers your team to act. It transforms data from a historical record into a forward-looking guide for making smarter decisions.
Example 3: The Automated Financial Reporting Pack
That monthly board report or investor update is a massive time-sink. This data product automates the entire process, giving your finance team back days they would have otherwise spent wrestling with Excel. We dig into more ways to streamline operations in our guide to small business secrets for sustainable growth.
- The Pain Point It Solves: Building financial reports is a manual, error-prone nightmare. You waste days copy-pasting numbers into spreadsheets, and one bad formula can throw everything off.
- How It Works: This product connects directly to your financial systems (like QuickBooks or Xero) and automatically spits out your key statements—P&L, Balance Sheet, and Cash Flow—in a clean, board-ready format. It can even pull in key operational KPIs for a full picture of the business.
- The Decisions It Enables: You get accurate, professional reports on demand. This builds a huge amount of trust with your board and investors, and it lets you spend your time actually analyzing the numbers, not just compiling them.
These internal data products are fundamental for running a modern business. But some companies also look externally to inform their strategy. For instance, businesses in niche industries can use external data products, like a detailed Golf Course Operation Service Market Research Report, to get a handle on market trends and see where they stand against the competition.
Feeling like one of these could solve your biggest headache? See how Vizule can help automate your reporting stack and build the data product your business needs to grow.
How We Build Your First Data Product
Turning scattered data into a powerful business asset shouldn't feel like some mysterious, overly technical process. As your consultative partner, we stick to a transparent, business-first approach that’s built for founders and operators—people who care about outcomes, not jargon.
Our process is designed to move quickly. We go from identifying your single biggest challenge to delivering a tangible solution that gives you immediate value. We break down the entire journey into clear, manageable stages to make sure we’re always hitting your goals and the final data product is a perfect fit.
Step 1: Discovery and Strategy
Everything starts with your business, not your data. Before we even peek at a spreadsheet, we sit down with you to get to the heart of your most pressing challenges and strategic goals. We focus on the decisions you're struggling to make right now.
This discovery phase is everything. It guarantees that the data product we build is directly wired to a specific, high-value business outcome—like boosting profitability, cutting down customer churn, or getting a handle on cash flow. We define what success looks like first, which gives us a clear roadmap for the entire project.
Step 2: Data Connection and Modelling
Once the strategy is locked in, we get our hands dirty with the technical foundation. Our team securely connects to your key data sources, whether that’s financial data from QuickBooks, sales activity from your CRM, or operational metrics from a custom-built platform. We handle all the complexity of pulling these different systems together.
Next, we build a robust data model inside Power BI. Think of this as the logical blueprint for your data. It’s where we clean, organize, and link everything together to create a single, reliable source of truth. This foundational work is what separates a durable, long-lasting data product from a flimsy, one-off report.
Step 3: Dashboard Design and Insights
With a solid data model in place, we get to the exciting part: bringing your data to life. We design and build an intuitive, interactive Power BI dashboard that’s tailored to answer the questions we defined back in the discovery phase. Our design philosophy is simple: clarity over clutter.
We focus on visuals that give you answers at a glance. You won’t find any confusing charts or vanity metrics here. Instead, you get a clean, user-friendly interface that lets you explore your data, drill down into the details, and spot trends without breaking a sweat. This is where raw data finally becomes actionable insight.
The infographic below shows the typical lifecycle for taking a data product from a simple idea to a fully functional tool.
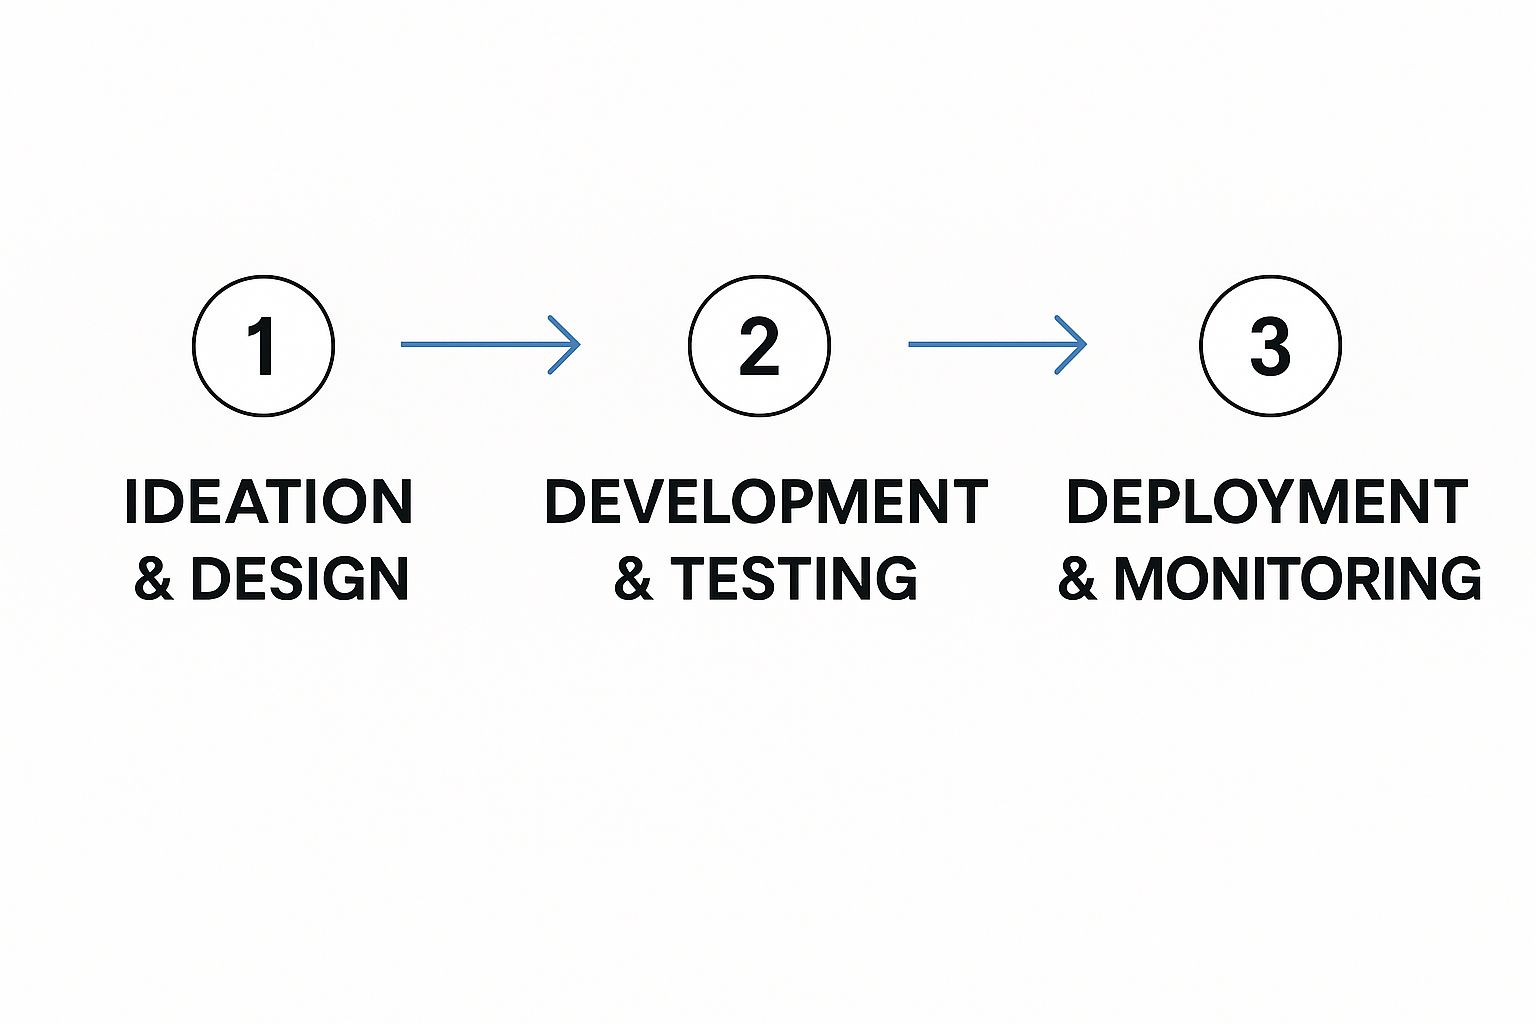
This flow really highlights how building a successful data product is a structured journey, from the initial design and development all the way through to ongoing monitoring and improvement.
Step 4: Automation and Handover
Finally, we make sure your new data product runs on autopilot. We set up automated data refreshes so your dashboard is always current with the latest information, no manual work required. The days of pulling weekly reports are officially over.
More importantly, we empower your team to actually use their new tool with confidence. We provide hands-on training and clear documentation so everyone understands how to navigate the dashboard and interpret the insights. Our goal is to make ourselves redundant by building your team's capability, leaving you with a sustainable asset that drives real growth.
Ready to see this process in action? Book your free BI consultation, and let's start mapping out the plan for your first data product.
The Tangible ROI of Investing in Data Products
Investing in a data product isn't just about chasing the latest trend; it's a strategic move with a clear, compelling return on investment. As a business owner, you know every dollar spent needs to justify itself, and putting money into data is no different. The good news? The value is not only measurable but significant, translating directly into better efficiency, smarter growth, and a stronger bottom line.
This isn't some niche concept, either. Businesses are pouring resources into analytics for a good reason. The global data analytics market, which is deeply connected to the rise of data products, was valued at around $28 billion in 2021. It's projected to skyrocket to $72.4 billion by 2025. You can read more on this incredible market growth, but the message is crystal clear: companies investing in data are riding a massive wave of economic value.
From Market Growth to Your Bottom Line
So, what does that massive market figure mean for your business? It means your competitors are likely getting smarter, faster, and more efficient by using their data. By building your own data products, you aren't just buying another tool; you're securing a competitive edge. The ROI shows up in several tangible ways that directly impact your P&L.
A well-designed data product delivers immediate value by eliminating wasted hours. Just think about the time your team spends manually pulling reports, hunting for numbers, and fixing endless spreadsheet errors. Automating these tasks frees them up to focus on high-value activities that actually drive revenue.
Investing in data products is fundamentally about buying back time and reinvesting it into growth. It transforms your team from data gatherers into strategic thinkers who can act on insights rather than just hunt for them.
Key Areas Where Data Products Drive Returns
Let's break down the specific returns you can expect. This value isn't abstract; it shows up in real-world operational and financial improvements. To really get a handle on this, mastering the return on investment calculation is crucial for proving the real-world impact of your investment.
Here’s where you’ll see the impact first:
- Improved Operational Efficiency: By automating reporting and giving you a clear window into your processes, you can spot bottlenecks, cut down on waste, and streamline workflows. This translates directly to lower operational costs and higher productivity.
- Deeper Customer Intelligence: Understanding customer behaviour, pinpointing at-risk accounts, and spotting upsell opportunities becomes second nature. This leads directly to higher customer retention and increased lifetime value.
- Stronger Financial Control: With real-time financial dashboards, you can manage cash flow more effectively, sharpen your forecast accuracy, and make smarter decisions about where to put your capital. Our overview of business intelligence for finance teams explores how this sharpens your financial strategy.
Ultimately, investing in a data product is about moving from guesswork to certainty. It’s an investment in confidence, clarity, and the capacity to scale your business intelligently.
Want to automate your reporting and finally trust your data? Book a free call with our BI consultants today.
Common Questions About Data Products
Even when the value is crystal clear, it’s only natural for some practical questions to pop up. As a business owner, you need to know exactly what you’re getting into before you dive in. Let's tackle a few of the most common questions we hear to give you the confidence to move forward.
How Is a Data Product Different from a Standard Report?
This is easily the most frequent question we get, and the distinction is a big one. Think of a standard report—usually built in Excel—as a static photo. It’s a snapshot of a single moment in time, put together manually. The second it’s finished, it’s already becoming outdated, often left to gather dust in an email inbox.
A data product, on the other hand, is a living, breathing asset.
- It’s Automated: It plugs directly into your live data sources and updates itself. No more tedious manual copy-pasting.
- It’s Interactive: You’re not just looking at a flat page. You can click, filter, and drill down into the numbers to ask your own follow-up questions and explore what’s really going on.
- It’s Built for Ongoing Use: This isn’t a one-and-done analysis. It’s a durable tool, designed for you to use every day or week to make strategic calls.
At its core, a report tells you what happened. A data product helps you understand why it happened and what you need to do next.
Do I Need a Data Scientist on My Team?
Absolutely not. This is a huge misconception that holds back so many small and medium-sized businesses. While building the engine of a data product requires technical skill, getting behind the wheel is a completely different story.
We believe the people closest to the business problems should be the ones using data to solve them. Our job is to build the engine; your job is to drive.
Tools like Power BI are specifically designed with business users in mind, not data specialists. Our role as consultants is to handle all the complex data modelling and plumbing behind the scenes. We hand you a finished product that’s intuitive and easy to use, so you and your team can find answers without needing a technical degree.
What Is the First Step to Creating a Data Product?
Getting started is much simpler than most people think. You don’t need some massive, company-wide data strategy to get going. The best way to start is to think small and solve a single, high-impact problem first.
The very first step is to pinpoint your single most pressing business question. What's the one answer that, if you had it instantly and reliably, would make the biggest difference to your business? Maybe it’s finally understanding your true customer acquisition cost, or getting a real-time grip on your cash flow.
Once you have that question, you have your starting point.
Ready to turn your most critical business question into an automated, actionable answer? The team at Vizule is here to help you connect the dots. Book your free BI consultation with our experts today and discover what a data product can do for you.


