


Management reporting is the process of creating internal reports from your key business data to help your leadership team make smarter, faster decisions.
Think of it this way: running your business without good reporting is like trying to navigate a new city with an old, folded paper map. You might get there eventually, but you’ll probably hit traffic, take wrong turns, and waste a lot of time. A modern management reporting system, powered by tools like Power BI, is your company’s real-time GPS—showing you exactly where you are, where you’re headed, and the best route to get there.
Turning Data into Decisions
So, what is management reporting at its core? It’s the bridge between all your raw, scattered data and a clear, actionable business strategy.
For most small-to-medium business owners, critical information is siloed in different platforms. You’ve got financials in QuickBooks, sales data in HubSpot, and operational metrics floating around in a sea of Google Sheets. You're frustrated with this Excel chaos, and you know the answers are in the data somewhere. Management reporting is the process that pulls all of this together.
The goal isn't just to spit out numbers; it's to tell a story about business performance. Instead of your team spending hours manually copying and pasting data into Excel, a well-designed reporting system automates the grunt work. This frees you up to focus on what actually matters: analysis and action. The impact of this shift is huge; a recent survey found that 82% of companies saw improved decision-making speed after adopting better reporting tools. You can find more insights like this in market research trends on Qualtrics.com.
From Reactive to Proactive Leadership
Getting your management reporting right helps your leadership move from just reacting to problems to proactively shaping the future of the business. Here’s how it works:
- It creates a single source of truth. No more arguments over which spreadsheet is correct. Everyone from finance to ops works from the same verified data. This is a foundational principle of effective business intelligence for finance teams.
- It shines a light on Key Performance Indicators (KPIs). It cuts through the noise and focuses everyone’s attention on the metrics that actually drive growth, like customer acquisition cost (CAC) or cash runway.
- It allows for faster course correction. When you can see performance trends in near real-time, you can spot issues early and make adjustments before they spiral into major problems.
This chart gives you a sense of how often businesses are actually reviewing these kinds of reports.
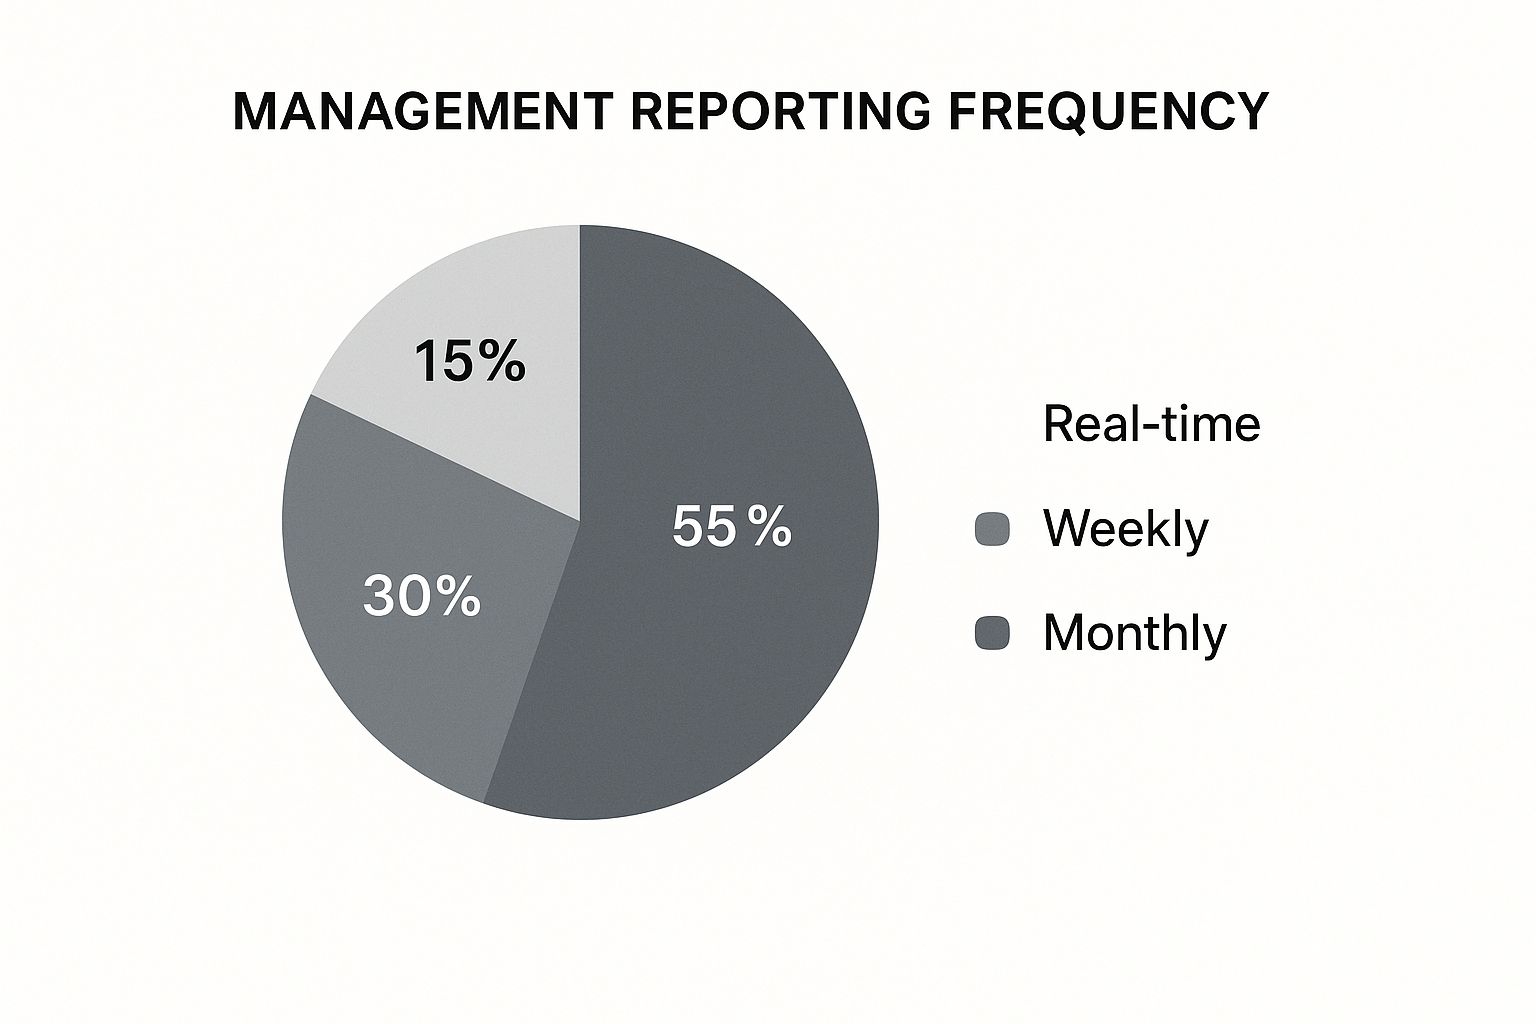
As you can see, while monthly reporting is still common, there's a clear trend toward weekly or even real-time updates. The faster you can get insights, the more agile your business becomes.
Manual Excel Reporting vs Automated Management Reporting
For many SMBs, the default reporting tool is Excel. But as you grow, the limitations and manual effort become a major bottleneck. Here’s a quick look at how traditional Excel reporting stacks up against a modern, automated approach using tools like Power BI.
| Attribute | Manual Reporting (Excel) | Automated Reporting (Power BI) |
|---|---|---|
| Data Collection | Manual copy-paste from various sources. | Direct, automated connections to data sources. |
| Time Investment | Hours or days spent on data entry and updates. | Minutes to refresh; focus is on analysis. |
| Accuracy | High risk of human error (typos, formula mistakes). | Consistent and reliable with a single source of truth. |
| Insights | Static charts and tables; difficult to see trends. | Interactive dashboards and real-time trend analysis. |
| Scalability | Becomes slow and crashes with large datasets. | Handles large volumes of data with ease. |
The takeaway is simple. While Excel served its purpose, relying on it for critical business decisions in a data-rich world is like choosing that paper map over a GPS. An automated system gives you the speed, accuracy, and depth you need to navigate with confidence.
The Building Blocks Of A Great Management Report

A genuinely useful management report isn’t just a jumble of charts and numbers; it’s a narrative that tells you exactly how your business is doing and where it’s headed. To tell that story well, you need the right ingredients.
Putting together a report without these core elements is like trying to build a piece of flat-pack furniture without the instructions. You’ve got all the parts, sure, but you’ll end up with something wobbly and incoherent, not a functional piece of furniture.
The foundation is always a smart mix of financial, operational, and performance data. These elements work together to give you the full picture, helping you move past surface-level stats to understand the why behind your numbers.
Key Performance Indicators (KPIs)
Think of Key Performance Indicators (KPIs) as your business's vital signs. They are the specific, measurable data points that tell you whether you’re on the right path to hitting your most important goals.
For an e-commerce startup, the team might live and breathe metrics like Customer Lifetime Value (CLV) and Customer Acquisition Cost (CAC). A creative agency, on the other hand, would be far more concerned with project profitability or their team’s billable utilisation rate.
The trick is picking KPIs that actually reflect your strategy, not just "vanity metrics" that look good but don't mean much. The best KPIs are always:
- Actionable: They should make you want to do something specific.
- Relevant: Directly linked to what makes your company successful.
- Timely: Fresh enough to help you make decisions now, not last quarter.
A great management report doesn't just present data; it guides focus. By zeroing in on a handful of vital KPIs, you align your entire team on what truly matters for growth, turning complex business operations into a clear, shared mission.
Financial and Operational Metrics
While KPIs track your high-level strategic goals, your financial and operational metrics are the bedrock. They provide the nitty-gritty context about your company's health and efficiency, grounding your entire report in reality.
You absolutely need your core financial statements—the Profit & Loss (P&L) and the Cash Flow Statement. There's no getting around them. They tell you about profitability and liquidity, answering those critical questions: "Are we actually making money?" and "Can we pay the bills next month?"
Running alongside these are your operational metrics, which measure how well your day-to-day machine is running. This could be anything from inventory turnover for a retail business to average ticket response time for a customer support team. The real magic happens when you connect these operational dots to your financial results—that's how you unlock the deep insights that show how your business model really works.
How Smart Reporting Fuels Business Growth

This is where the magic happens—connecting the dots between raw data and real-world results. Management reporting isn’t just some administrative chore; it’s the strategic engine that drives your business forward. When you have timely, accurate insights at your fingertips, you can make smarter decisions, forecast with confidence, and get your entire team rowing in the same direction.
Let’s think about a growing services firm. They’re constantly juggling cash flow, trying to keep everything afloat. By setting up an automated cash flow report in Power BI, they can suddenly see the blockages in their financial plumbing—like that one client who always pays 30 days late, or those projects that consistently bleed money.
That newfound clarity is a game-changer. They can tighten up their payment terms and shift resources away from the money pits. All at once, capital that was trapped in unpaid invoices is freed up. This isn't just a number on a spreadsheet; it's the cash they need to expand into a new market or finally hire that key developer.
Turning Insights Into Opportunities
This story isn't unique. At its core, management reporting is all about uncovering hidden opportunities and spotting risks before they become problems. To really get it, you have to see how robust management accounts for business performance lead to tangible, bottom-line outcomes.
The numbers don't lie. Firms that lean into integrated management reporting see an average 15% bump in ROI within just two years. On top of that, 68% of companies say they get much better at sticking to their budgets after adopting modern reporting tools, turning financial goals from wishful thinking into concrete plans.
By turning raw data into a clear performance story, you empower your team to stop reacting to the past and start building the future. This is the difference between simply running a business and strategically leading it.
Moving From Excel Chaos To Automated Clarity
Are you drowning in a sea of VLOOKUPs and pivot tables? For too many growing businesses, that’s the reality of management reporting. You have a gut feeling the answers are buried in your data, but digging them out is a constant, uphill battle. Why are your reports always out of date?
This manual grind isn't just frustrating—it's a serious bottleneck. Every hour spent copying, pasting, and fixing errors is an hour you’re not spending on strategy. But here's the good news: making the jump from spreadsheet chaos to automated clarity is far more achievable than you might think.
The whole journey starts by simplifying your goal. Don't try to boil the ocean. Instead, pinpoint the handful of critical business questions you need answered every single week. From there, you can start connecting your scattered data sources—think QuickBooks for finance, HubSpot for sales, and various Google Sheets holding everything else together.
Charting Your Path to Automation
Automating your management reporting isn’t some technical nightmare; it’s a structured process. It's all about building a system that finally works for you, freeing up your time and delivering insights you can actually trust.
It really boils down to three core steps:
- Connecting Your Data: The first move is to create a direct line to all your different data sources. Building a solid data pipeline is the foundation everything else rests on. We break down exactly how to build a data pipeline in our detailed guide.
- Modelling the Information: Once the data is flowing, it needs to be cleaned up, organised, and structured to answer your specific questions. This is where you define the relationships that matter, like linking a specific sales activity to its financial outcome in a forecasting model.
- Visualising the Story: Finally, you bring it all to life. This means creating intuitive dashboards in a tool like Power BI that present the answers clearly and visually.
For any business looking to fast-track this process without a heavy reliance on coding, exploring powerful no-code automation tools is a fantastic starting point.
Here’s a glimpse of what an interactive Power BI dashboard can look like, transforming complex data into a clear, visual story.
This is the point where you trade tedious data entry for strategic, data-driven decisions. Instead of just reporting on what happened last month, you can finally start shaping what happens next. At Vizule, this is exactly the transformation we guide our clients through every single day.
Best Practices For Reports That Get Results
Anyone can create a report; that’s the easy part. The real challenge is creating reports that people actually read and use to make decisions. Think of a great management report less as a data dump and more as a focused communication tool designed to spark action.
The first rule of thumb? Know your audience. Your board of directors needs a 30,000-foot strategic view, zeroing in on profitability and long-term growth. Your sales manager, on the other hand, needs granular, in-the-weeds data on things like pipeline velocity and individual team performance. Tailoring the content to each stakeholder is what separates a report that gets a quick glance from one that genuinely drives results.
Focus On Actionable Insights
Fantastic reports don’t just tell you what happened—they guide you on what to do next. This means shifting your focus from lagging indicators (like last month's revenue) to leading indicators (like new sales-qualified leads). Leading indicators are predictive, giving you a chance to get ahead of the curve and influence future outcomes.
The most valuable management reports are forward-looking. They use historical data not just to keep score, but to identify trends and patterns that help you anticipate challenges and seize opportunities before they arrive.
Keep your visuals clean and simple. The goal is clarity, not cramming every possible chart onto one page. Good design makes data instantly understandable. Our guide on data visualization best practices is packed with practical tips for building dashboards that communicate insights at a glance.
Finally, get into a consistent reporting rhythm. Whether it’s weekly, monthly, or quarterly, a predictable schedule builds accountability and embeds data-driven conversations into your company culture. This consistency is also a game-changer for risk management. The 2025 Global Insurance Market Report found that firms with strong reporting infrastructures kept their finances stable during economic downturns, proving just how vital clear reporting is for resilience. You can discover more insights about these findings on iais.org.
Ready To Trust Your Data And Automate Your Reporting?

Imagine kicking off your week with every key metric you need already updated and waiting for you in a clear Power BI dashboard. No manual data pulls, no frantic spreadsheet wrangling—just the answers you need to lead.
This guide has walked through what it takes to build effective management reporting. It’s never about creating more charts; it’s about getting the clarity, control, and confidence you need to scale smart. It's time to stop letting disconnected data and chaotic spreadsheets dictate what's possible.
Your business deserves a reporting system that provides answers, not just more data. The goal is to make insight-led decisions the standard, not the exception.
Want to automate your reporting and finally trust your data? Book your free BI consultation with our BI consultants today. We can show you how a custom Power BI solution will finally connect the dots in your data and deliver the visibility you need to scale intelligently.
Common Questions About Management Reporting
Diving into automated reporting for the first time usually sparks a few questions. Let's tackle some of the most common ones we hear from founders and operators who want to get a real grip on their business data.
What's The Difference Between Financial And Management Reporting?
Think of it this way: financial reporting looks out, and management reporting looks in.
Financial reporting, like your year-end accounts, is built for outsiders—investors, banks, the tax man. It’s backward-looking and has to follow rigid, standardized accounting rules.
Management reporting, on the other hand, is for your internal team. It's flexible, forward-looking, and designed to arm you with the insights you need to make smart, strategic decisions about where the business is headed next. It combines financial data with operational metrics to tell the complete story.
How Long Does It Take To Switch From Excel To Power BI?
Honestly, it depends on the state of your data. If you have clean, simple data sources, you could be up and running with a powerful dashboard in a few weeks. But if you're pulling from multiple, messy systems, it will take longer to build the right data transformation models.
This is where bringing in an expert makes a huge difference. A specialist can build the data models and dashboards correctly from the start, sidestepping the usual headaches and getting you reliable insights much faster than if you tried to figure it all out yourself.
Ready to stop guessing and start knowing? Vizule helps businesses design and automate reporting systems that connect the dots in their data. Book your free BI consultation and we'll show you how a custom Power BI solution can drive your business forward.


