


Are your most important business decisions guided by a tangled web of spreadsheets? You're not alone. For many founders and operators, "financial reporting" means spending hours stitching together data from QuickBooks, Stripe, and your CRM, only to end up with a static report that's out of date the moment it’s finished. This is Excel chaos, and it's a major roadblock to scaling smart.
So, what is financial services analytics? It’s your way out. It’s the process of using modern tools to connect all your financial and operational data, automating the grunt work, and creating a single, reliable source of truth. It’s about transforming your data from a painful chore into your sharpest strategic asset, giving you the clarity to make confident, insight-led decisions.
Moving From Excel Chaos to Strategic Clarity

If you're a founder or an operator in a scaling business, this probably sounds painfully familiar. You waste countless hours pulling numbers from different systems—your CRM, accounting software, payment gateways—and then trying to cobble them all together into a coherent picture.
The result? A mess of spreadsheets that are not only a nightmare to build but are already out of date the second you hit 'save'.
This constant, reactive cycle of manual reporting is more than just an annoyance; it’s a genuine roadblock to growth. When you can't get timely answers or trust the data in front of you, you're left making critical decisions based on gut feelings instead of hard facts. We call this "Excel chaos," and it's what keeps far too many promising companies stuck.
The Bridge to Insight-Led Decisions
This is where financial services analytics comes in. It's the bridge that takes you from that chaotic, reactive state to making proactive, insight-led decisions. Think of it as ditching a pile of old paper maps for a live, interactive GPS for your company's finances. It's not about adding more complexity—it's about creating absolute clarity.
The old way of doing things just doesn't cut it anymore. Manually wrestling with spreadsheets is slow, prone to errors, and keeps your most valuable people bogged down in low-value work.
The Shift from Manual Reporting to Financial Analytics
| Challenge with Manual Reporting | Solution with Financial Analytics |
|---|---|
| Time-Consuming: Hours spent manually exporting and merging data from different systems. | Automation: Data is automatically collected and refreshed, freeing up your team's time. |
| Error-Prone: Manual data entry and copy-pasting inevitably lead to mistakes. | Single Source of Truth: A unified, reliable dataset that everyone in the company can trust. |
| Static & Outdated: Reports are a snapshot in time, obsolete almost immediately. | Real-Time Insights: Live dashboards provide an up-to-the-minute view of performance. |
| Siloed Information: Finance, sales, and operations data live in separate, disconnected worlds. | Integrated View: Connects all your key data sources for a complete picture of the business. |
| Limited Insights: Difficult to spot deep trends or complex relationships in flat spreadsheets. | Deeper Analysis: Uncover hidden trends, correlations, and opportunities with advanced visuals. |
By connecting your disparate data sources and automating the grunt work, analytics platforms like Power BI create a unified, dynamic view of your entire business. This shift is what enables a true data-driven culture.
Financial services analytics is the engine that turns your data from a historical record into a forward-looking strategic asset. It helps you see around corners, anticipate challenges, and jump on opportunities before your competitors even know they exist.
The market is waking up to this reality. The global financial analytics market, valued at around USD 9.20 billion in 2024, is expected to explode to USD 27.51 billion by 2034. This isn't just a trend; it's a fundamental change in how modern businesses operate. You can read more about the financial analytics market growth to see what's driving this massive shift.
This journey is a core part of any successful digital transformation in finance, moving technology from a back-office cost center to a strategic driver of value. Ultimately, the goal is to make data accessible, reliable, and actionable for everyone on your team, creating a culture of smart decisions that fuels real, sustainable growth.
Want to automate your reporting and finally trust your data? Book your free BI consultation with our BI consultants today.
Calculating the True ROI of Your Data

It's one thing to be impressed by slick dashboards and fancy real-time charts. But as a business leader, you need to know the real impact on the bottom line. So, beyond the visuals, what's the tangible return when you invest in financial services analytics?
The true value isn't just about getting better reports; it's about what those reports let you do. The ROI of your data breaks down across three core pillars that directly shape your company's health and growth: saving time, cutting risk, and finding new opportunities.
Pillar 1: Saving Time and Reclaiming Focus
First, think about the sheer number of hours your team pours into manual reporting every single week. For most small to medium-sized businesses, this is a huge operational drag.
Take a founder who used to burn at least four hours every Monday morning painstakingly exporting sales data from Stripe and expenses from QuickBooks into a sprawling cash flow spreadsheet. By setting up an automated system in Power BI, we connected these sources just once.
Now, their cash flow report is ready and waiting for them every single morning. This didn't just claw back 16 hours a month; it handed them back their most strategic day of the week to focus on what actually moves the needle—like product development and talking to customers.
This shift from manual grunt work to automated insight is where the first layer of ROI really shines. You're not just buying software; you're buying back your team's most finite resource: time.
Pillar 2: Reducing Costly Risks
Hidden risks lurking in your data can quietly bleed your profits dry or, even worse, expose you to serious financial penalties. An operator at a booming e-commerce company noticed a strange, recurring pattern in their transaction data—something that was completely invisible in their old Excel summaries.
A unified dashboard brought the issue to light: a specific payment gateway was incorrectly applying sales tax to international orders. Catching this early stopped a potential compliance nightmare in its tracks and saved them from what could have been a hefty fine and a logistical disaster. This kind of proactive risk mitigation is a powerful, yet often overlooked, benefit of a solid analytics setup.
As your data grows, financial services analytics becomes non-negotiable for managing these threats. The global financial analytics market is set to grow by roughly USD 9 billion between 2025 and 2029, a clear sign that businesses need tools to get ahead of credit, market, and operational risks. You can see how analytics helps tackle financial losses in this detailed market analysis.
Pillar 3: Uncovering Hidden Growth Opportunities
This is where it gets really exciting. The biggest returns often come from discovering opportunities you never even knew were there.
An SMB selling subscription services was convinced its largest enterprise clients were its most valuable. But after we helped them integrate their CRM and financial data, a customer profitability analysis told a completely different story. They found that a smaller, overlooked segment of mid-market customers actually had a much higher lifetime value and required far less support.
Armed with this new insight, they launched a targeted marketing campaign squarely aimed at this profitable niche. The result? A 15% lift in revenue in just one quarter.
This is the ultimate payoff of a strong analytics practice. A good setup doesn't just answer the questions you already have; it reveals the more important questions you didn't even think to ask. Building a solid plan is the first step, and our experts can help you create the right data strategy consultancy to find these game-changing opportunities.
Ready to see the tangible ROI in your own data? Connect with us to design your financial dashboard in Power BI.
Powerful Use Cases for Scaling Businesses
Once you get past the abstract idea of analytics, you start to see its real power in day-to-day business. For a growing company, financial services analytics isn't about chasing complicated algorithms. It’s about solving tangible commercial problems. It’s how you turn raw data into your sharpest tool for forecasting, understanding customers, and tightening operational control.
Let's walk through four practical use cases that can make a real, immediate difference for an SMB or founder.
Dynamic Financial Forecasting
Let's be honest, static annual budgets built in Excel are usually out of date within a few months. They leave you trying to navigate the year with an old map. Dynamic forecasting, fueled by connected data, completely changes the game.
Instead of a fixed snapshot, you get a living, rolling forecast that constantly updates as new data streams in from your sales pipeline (CRM), operational systems, and accounting software like QuickBooks or Xero. This lets you model different scenarios on the fly. What if that big deal closes a month early? Or a key supplier raises their prices? This shifts forecasting from a painful yearly task to a continuous, strategic conversation.
Customer Profitability Analysis
We often assume our biggest customers are our most profitable ones. More often than not, that’s a dangerous assumption. A proper customer profitability analysis gets to the truth by connecting the dots between the revenue a client brings in and every single cost associated with serving them.
By pulling together data from your CRM, time-tracking tools, and financial ledgers, you can finally answer the questions that matter:
- Who are our truly most profitable clients? We're not talking about revenue here, but the actual margin left after you account for all the support, sales, and service costs.
- Which customer segments are eating up the most resources? This is crucial for spotting those clients who might be draining your team's time and energy for very little return.
- Where should our sales and marketing teams be aiming? Once you know the DNA of your best customers, you can find more just like them.
One of our clients, a B2B services firm, made a shocking discovery: their third-largest client was actually their least profitable. The account demanded so much custom support that it was wiping out all their margins. Armed with this data, they were able to renegotiate the contract and turn a money-losing relationship into a healthy one. This is one of the most powerful data analysis strategies for building sustainable growth.
Operational Efficiency and Cost Control
Hidden inefficiencies are silent profit killers. They quietly eat away at your bottom line. Financial analytics acts like a spotlight, shining a light on areas where you can tighten up operations and trim unnecessary costs without hurting your growth.
Imagine connecting your expense management platform with your project management data. You could instantly see which types of projects consistently blow the budget or which departments have unusually high spending. For businesses in regulated spaces, this goes even further. Using robust AML transaction monitoring systems becomes essential for automatically flagging suspicious activity, cutting down on manual work and reducing risk.
By linking financial data to operational metrics, you move beyond simply tracking what you spent to understanding why you spent it. This deeper context is the key to making smarter, more effective cost-cutting decisions.
Proactive Cash Flow Management
For any small or medium-sized business, cash is everything. Reacting to a cash shortfall is stressful and leads to bad decisions. Proactive cash flow management, driven by analytics, gives you the visibility to see what’s coming around the corner.
By blending your accounts receivable data from your invoicing system, accounts payable from your books, and sales forecasts from your CRM, you can build a dynamic cash flow dashboard. This gives you a clear, forward-looking view of your cash position. Suddenly, you can:
- Anticipate potential cash crunches weeks or even months ahead of time.
- Spot which slow-paying customers need a friendly nudge.
- Make confident decisions about when to hire, buy new equipment, or expand.
These use cases show how financial services analytics translates directly into smarter, more profitable business operations.
Ready to uncover these insights in your own business? See how Vizule can help automate your reporting stack.
How to Build Your Analytics Foundation
For a founder who doesn't live and breathe tech, the thought of setting up a financial services analytics system can sound like a major headache. You might picture massive costs, complicated projects, and something only huge corporations with big IT departments can pull off.
But that's not the reality anymore. Building a powerful analytics foundation is more accessible than ever, and you don't need to be a technical genius to get it right. The best way to think about it is like building a house.
You wouldn’t start by picking out paint colours before you have a blueprint and a foundation. The exact same logic applies here. This is all about following a simple, logical plan to turn all your scattered data into your company's most valuable asset.
Step 1: The Foundation (Your Raw Data)
Every good house starts with a solid foundation poured on stable ground. In the analytics world, that foundation is your raw business data—all the information currently living in the different software you use to run your business day-to-day.
This usually includes crucial sources like:
- Accounting Software: This is your financial bedrock. Think QuickBooks or Xero, holding your P&L, balance sheet, and expense records.
- Payment Processors: Systems like Stripe track every single dollar that comes through the door.
- CRM Platforms: Your customer hub, like HubSpot, which is full of vital sales pipeline and client interaction data.
Right now, these are probably like separate plots of land. The first job is simply to identify them and get ready to bring all that information together onto a single, stable site.
Step 2: The Framing (Your Data Warehouse)
Once the foundation is set, it’s time to put up the frame. This is the structure that connects everything and gives the house its shape. Your data warehouse does the exact same thing for your analytics system. It’s a central, organised place built specifically to store data from all those different sources under one roof.
Instead of your QuickBooks data being stuck in one system and your Stripe data in another, the data warehouse pulls it all together. This is the crucial move that creates a "single source of truth." When you have a well-built data warehouse, you can finally trust that your reports are consistent, reliable, and telling the whole story. You can get a deeper look into how this works in our guide on the data model vs data warehouse.
A data warehouse doesn't just hold data; it structures it for analysis. It’s the framework that ensures your financial reporting is built on a rock-solid, unified structure, not a shaky mix of disconnected spreadsheets.
Step 3: The Interior Design (Your BI Tool)
With the frame up, you can finally get to the fun part: the interior design. This is the part of the house you actually see and interact with every day. For your data, this is your Business Intelligence (BI) tool, like Power BI. It connects directly to your data warehouse and turns all that neatly structured data into beautiful, interactive dashboards and reports.
This is where the magic really happens. A tool like Power BI is what lets you actually see the trends, drill down into the details, and get clear answers to your biggest business questions. It’s the user-friendly interface that puts powerful insights right at your fingertips—no coding required.
The growth in this space is staggering. The financial data services market was valued at around USD 35 billion in 2023 and is projected to smash USD 75 billion by 2032, with North America leading the charge. This explosion is being driven by businesses of all sizes finally getting access to these powerful, user-friendly analytics tools. You can explore the financial data services market trends to see the full scale of this shift.
The best part? You don't have to build this house alone. A partner like Vizule acts as your architect and general contractor, handling all the technical blueprints so you can focus on what matters most: using the insights to grow your business.
Your Roadmap from Data to Decisions
Getting from a state of data chaos to one of strategic clarity can feel like a huge mountain to climb. You know you need better insights, but where on earth do you start? The truth is, a successful financial services analytics implementation isn't a one-and-done project; it’s a journey. By breaking it down into a clear, phased roadmap, the process becomes manageable, predictable, and focused on delivering real value, fast.
At Vizule, we use a proven three-step process—Map, Model, and Mobilize. It’s designed to take you from your biggest questions to actionable dashboards in a structured, efficient way. This isn't some complex, multi-year saga; it's a practical plan for getting results.
Phase 1: Map
Every great journey begins with a clear destination in mind. In the Map phase, we sit down with you to define what success actually looks like for your business. This initial discovery stage is arguably the most critical because it ensures the entire project is welded to your core business objectives, not just some technical checklist.
We zero in on a few fundamental questions:
- What are your most urgent business challenges? Are you wrestling with cash flow visibility, trying to figure out which customers are actually profitable, or just need more accurate forecasts?
- Which Key Performance Indicators (KPIs) truly drive your business forward? We help you cut through the noise and lock onto the metrics that really matter.
- Where does all your data currently live? We conduct a thorough audit of your key data sources—from QuickBooks and Stripe to your CRM—to understand the raw materials we're working with.
This phase results in a clear blueprint for what's to come. You can learn more about how we build this foundational plan in our detailed guide to creating a data strategy roadmap.
Phase 2: Model
Once we have our map, it’s time to build the engine. The Model phase is where the technical work happens, where we forge your single source of truth. Our team gets to work connecting your disparate systems, extracting the data, and stitching it all together into a central, unified data model.
The process involves a few key steps:
- Data Integration: We establish automated pipelines to your various software platforms.
- Data Transformation: We clean, standardize, and structure the raw data, resolving all the inconsistencies and making sure everything speaks the same language.
- Model Building: We construct the core financial and operational models right inside Power BI, creating the logical relationships that allow for deep, dynamic analysis.
This technical heavy lifting is what turns messy, siloed information into a powerful, reliable asset that’s ready for the spotlight.
This diagram shows the basic flow: moving from scattered data sources to a structured data warehouse, which then fuels your business intelligence tool.
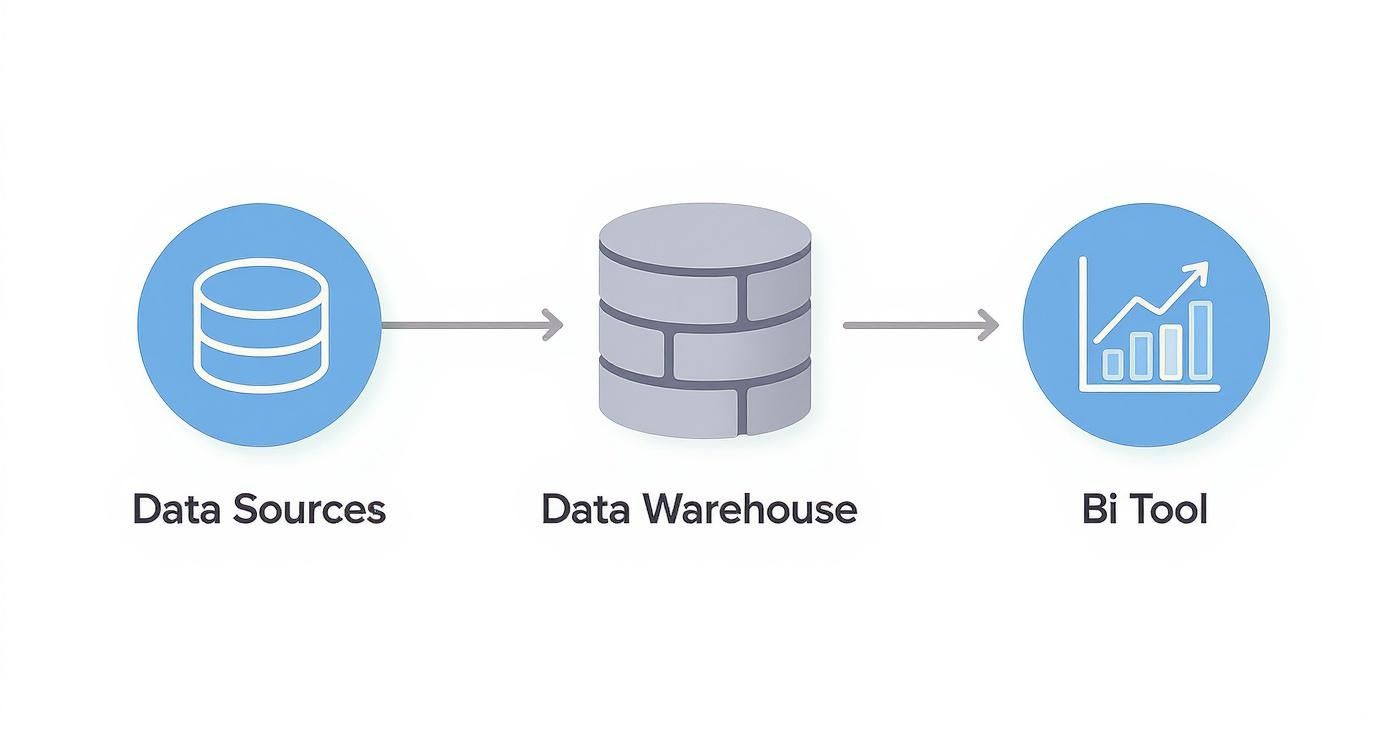
As you can see, a central data warehouse is the critical bridge between raw data and the actionable insights you get from a BI tool like Power BI.
Phase 3: Mobilize
The final and most exciting phase is Mobilize. With a solid model in place, we activate your data by rolling out interactive dashboards to your team. This is where all the hard work pays off and insights become part of your daily operational rhythm.
Mobilization is about more than just delivering a dashboard; it's about embedding a data-driven culture. The goal is to make informed decision-making the path of least resistance for everyone on your team.
We provide hands-on training to ensure your team is comfortable and confident using the new tools. We also help you establish a regular cadence for reviewing insights, turning data analysis from a sporadic activity into a consistent strategic habit. For smaller businesses navigating this journey, finding tailored analytics solutions for SMBs is the key to making this stick. This final step ensures the solution doesn't just get built—it gets used to drive real change.
Let's Get Your Business Firing on All Cylinders
We've walked through the entire journey, from the all-too-familiar grind of manual Excel reporting to the genuine control that financial services analytics delivers. For ambitious founders and SMB leaders, this isn't some far-off corporate luxury; it's the engine for smart, sustainable growth.
The path forward is actually quite simple. You're trading wasted hours for automated efficiency. You're swapping questionable data for a single source of truth. Most importantly, you're turning missed opportunities into your next big win.
Think about it. Every decision you’ve delayed because the numbers weren't clear, and every hour your team has sunk into spreadsheet chaos, can be reclaimed. This is about building a business that operates with confidence, clarity, and a real competitive edge.
Your Partner in Getting it Done
At Vizule, this is exactly what we do. We specialize in guiding businesses like yours through this transformation. We become your expert partner, digging into the technical complexities so you can stay focused on running your business. Our job is to connect the dots in your data and build the automated reporting stack you need to get your finance and operations teams perfectly aligned.
We know the pressures of scaling an SMB. That's why our proven Map, Model, Mobilise process is designed to get you actionable insights and a tangible ROI fast, without the massive overhead or endless timelines you might be dreading.
Your data holds the answers to your most critical business questions. Our mission is to help you finally ask them—and get clear, reliable answers in real-time.
Stop letting disconnected data dictate your company’s potential. Moving from reactive problem-solving to proactive strategy is the single most powerful shift you can make. It's time to give your business the visibility it needs to not just compete, but to lead.
The journey starts with a simple conversation. Let’s talk about your current headaches and map out what a future of data-driven clarity could look like for your business.
Ready to automate your reporting and finally trust your data? Book your free BI consultation with our experts today and take the first step toward unlocking what your business is truly capable of.
Got Questions? We've Got Answers
Stepping into the world of financial services analytics can feel like a big move, especially when you're already juggling the demands of a growing business. It's totally normal to have questions about how it all works in practice.
Here are some straightforward answers to the things we hear most often from founders and operators just like you.
"My Data Is a Complete Mess. Can Analytics Still Work for Me?"
This is the number one question we get, and the answer is a resounding yes. Honestly, having messy, disconnected data is the very reason to build a proper analytics system. No business starts out with perfect, clean data.
Our initial "Map" and "Model" phases are designed specifically to bring order to that chaos. We don't just dump your raw data into a chart and hope for the best. We build a solid foundation first.
- Connecting the Dots: We pull data from all your different systems—your QuickBooks, your Stripe, your CRM, you name it.
- Cleaning it Up: We then clean, standardize, and structure all that information into one reliable, unified model.
Think of it like a chef doing mise en place before service. We do all the messy chopping and organizing behind the scenes so the final dish—your interactive dashboard—is perfect. The mess isn't a roadblock; it's the starting point.
"How Long Does It Take to Get Something Like This Up and Running?"
Don't worry, this isn't some massive, year-long IT project. With modern tools and a clear focus, you can get from kickoff to real, usable insights much faster than you might think.
We are all about delivering value fast. Our goal is to get an initial, high-impact dashboard live within the first 30-45 days. This first version always targets your most pressing pain point, whether that's cash flow visibility or tracking sales performance.
From there, we build out more advanced analytics piece by piece. This phased approach means you get a tangible return on your investment right away. You can start making better decisions almost immediately instead of waiting months for a "finished" system. It's about progress, not perfection.
"Is Power BI the Only Tool? Do I Need to Be a Tech Expert to Use It?"
While we are Power BI specialists, the tool itself is just one piece of the puzzle. The real magic happens in the strategy and data modelling we do before you ever see a chart. And no, you absolutely do not need to be a technical guru.
Our job is to be your expert technical partner. We handle the entire backend process—the data connections, the warehousing, the complex modelling.
Your job is to use the final product: an intuitive, user-friendly dashboard that works a lot like a website. If you can use filters on Amazon, you can use one of our dashboards to explore your business data. We build it, we train you on it, and we empower you to focus on finding insights, not writing code.
Ready to move past the questions and get a clear plan for your data? The team at Vizule can show you exactly how to transform your business reporting.


