


Feel like you're drowning in spreadsheets but still can't get a clear picture of your business performance? You're not alone. Many founders and operators hit a wall where manual reporting and disconnected data start to slow growth and create confusion.
In simple terms, a data strategy consultancy is an expert partner that designs a blueprint to turn that data chaos into clarity. They connect the dots between your accounting software, sales platform, and operational tools to build a single source of truth. The end goal is to unlock reliable, insight-led decision-making for your entire team, moving you from reactive problem-solving to proactive growth.
What a Data Strategy Consultancy Actually Does

Think of a data strategy consultancy as a specialist that bridges the gap between your big-picture business goals (like increasing profitability or scaling operations) and the technical setup required to measure progress. For most small and medium-sized businesses, data is scattered everywhere—in Excel files, Xero or QuickBooks, your CRM, and various operational apps. This makes getting a single, trustworthy view of performance feel next to impossible.
A consultant’s core mission is to fix this fragmentation. They don't just sell you a piece of software; they build a practical, custom framework for your company's data. The entire process kicks off by digging into your most critical business questions and understanding your biggest reporting headaches.
From Manual Reporting to Automated Insight
The real value emerges when they help you move away from tedious, time-consuming manual processes—like exporting CSVs and wrestling with VLOOKUPs—and toward an automated system for business intelligence. Instead of your team wasting hours every week copying and pasting numbers into yet another spreadsheet, a consultancy builds the data pipelines to do it all for them.
This work usually breaks down into a few key phases:
- Assessing the current state of your data, from siloed reports to frustrating manual updates in Excel.
- Designing a clear roadmap that connects your data sources to your most important business KPIs.
- Building automated dashboards in tools like Power BI that answer your most important questions at a glance, from cash flow forecasting to sales performance.
A good data strategy consultancy provides more than just a dashboard; they introduce a structured way to think about and use data to drive growth.
Core Functions of a Data Strategy Consultancy
| Function | What It Means for Your Business |
|---|---|
| Strategy & Roadmap Development | They work with you to define your key business questions and create a phased plan to answer them with data. |
| Data Architecture & Engineering | This is the technical work of connecting your systems (like Xero, HubSpot, etc.) and building the "plumbing" for your data to flow automatically. |
| Business Intelligence & Analytics | Creating interactive dashboards and financial models that turn raw numbers into actionable business insights. |
| Data Governance & Quality | They establish processes to ensure your data is accurate, consistent, and secure, so you can actually trust the numbers. |
| Team Training & Enablement | A great consultancy teaches your team how to use the new tools and foster a data-driven culture. |
Ultimately, a data strategy consultancy empowers your team with a reliable single source of truth, bringing finance, operations, and leadership into perfect alignment. It's about building a foundation for smarter, faster growth.
If you're ready to go deeper, check out our guide on what a data strategy is and see how it can help you scale more effectively.
Moving Beyond Spreadsheets And Siloed Data
For many growing companies, the phrase “data strategy” sounds like a complex, enterprise-level project. But at its heart, it’s a simple mindset shift: trading clunky spreadsheets and guesswork for confidence and clarity. This isn’t about buying another software license; it’s about building a reliable system you can trust to make better decisions.
Unlike an IT helpdesk that just keeps the lights on, a dedicated data strategy consultancy focuses on building the engine that drives your business forward. They:
- Break down data silos between finance and operations.
- Resolve conflicting metrics so everyone is on the same page.
- Eliminate hours of manual data stitching in Excel.
- Automate reporting from end-to-end.
Building Your Single Source Of Truth
Imagine your leadership team is trying to navigate. Your head of sales is looking at one set of numbers from the CRM, your finance lead is looking at another from your accounting software, and your operations manager has a different spreadsheet altogether. You’re moving, but no one can agree on the direction or speed.
A single, unified dashboard changes everything. Suddenly, every team reads from the same instrument panel. You’ve created a single source of truth. Key to this transformation is understanding and implementing efficient mastering data integration techniques.
For SMB leaders, better reports are just the beginning. The real impact comes when finance, sales, and operations all make decisions from the same set of numbers. That alignment drives faster, more confident growth.
This cohesive approach ensures every piece of your tech stack directly supports your real-world business goals. And the market reflects its importance: the growth of the strategy consulting market is surging because founders and operators recognize the need for a rock-solid data foundation to compete and scale effectively.
Ready to see how to build a single source of truth for your data? Dive into our guide and start aligning your teams today.
What to Expect from Your Engagement
Working with a data strategy consultancy is a structured journey to turn data chaos into clarity and tangible business outcomes. It’s about evolving your messy spreadsheets into a strategic, automated asset that saves you time and uncovers opportunities.
The process usually kicks off with a discovery and audit phase. Here, the consultants act like business detectives, interviewing key people across your company—from finance to sales and operations—to pinpoint your biggest reporting headaches. Are you burning 20 hours a month manually wrestling with cash flow reports? Do your sales and finance numbers ever actually line up? This first step is crucial for identifying the problems that, once solved, will deliver the biggest and fastest return on investment.
Designing Your Data Blueprint
Once the main challenges are clear, the next step is designing a blueprint for your data infrastructure. For most SMBs, this isn't about buying expensive, overly complex software. The goal is to create a lean, effective system that just works.
This phase typically includes:
- Designing a simple cloud data warehouse that will act as your central hub and single source of truth.
- Building automated data pipelines that pull information directly from your accounting, sales, and operational systems, making manual data entry a thing of the past.
- Creating interactive financial models and dashboards using a tool like Power BI, which lets you slice and dice your data to answer new questions on the fly.
This visual gives a high-level overview of the flow, from scattered, chaotic data sources to a single, unified dashboard that actually tells you something useful.
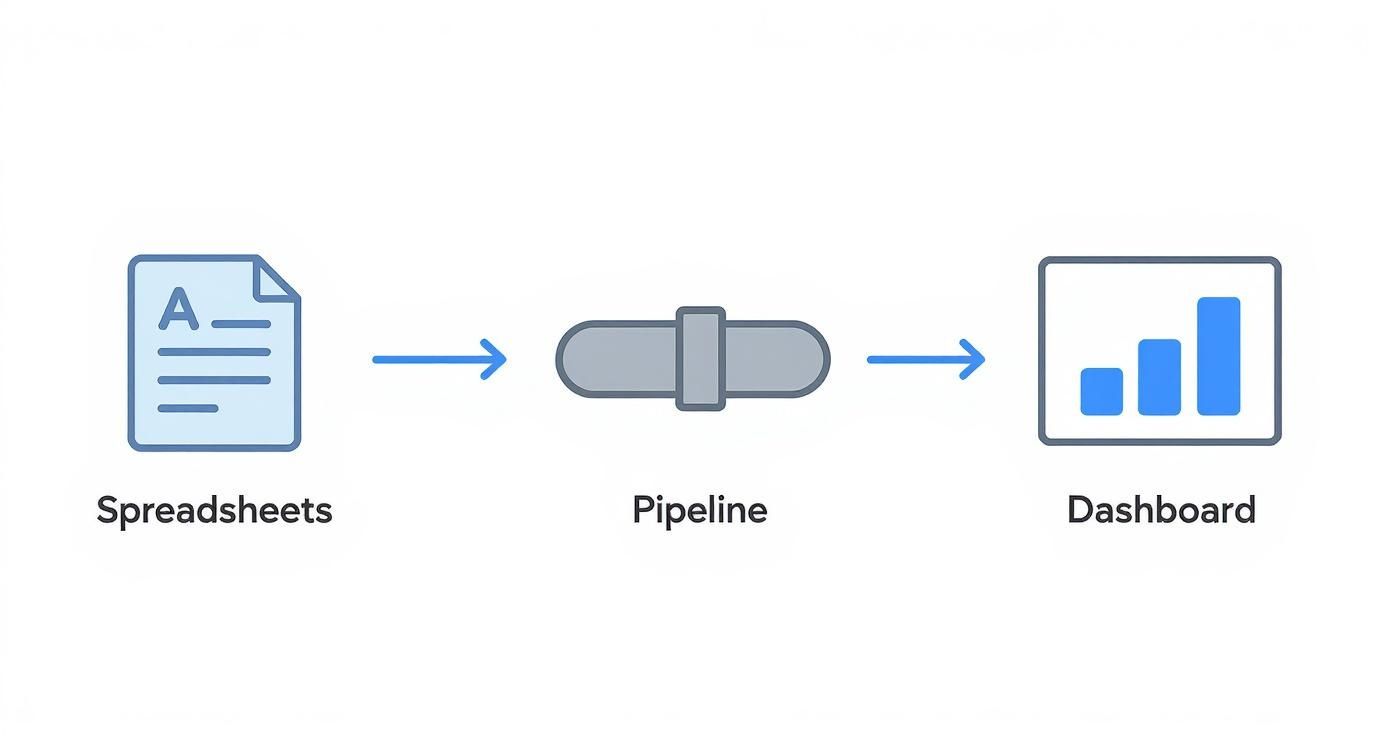
As you can see, those automated pipelines are the critical bridge between scattered files and a dashboard you can trust. They’re what turn raw, messy data into a powerful decision-making tool.
The goal isn’t just to build reports; it’s to build an automated reporting engine. The final deliverable should be a system that works for you, not one that creates more work for your team.
This kind of strategic, hands-on help is why this growing market and its trends show such rapid expansion. Businesses are tired of guessing and are actively seeking these kinds of outcomes.
For example, imagine a subscription business constantly struggling with cash flow forecasting. Their jumbled transaction data from Stripe and sales data from HubSpot could be transformed into a dynamic Power BI model. This model would update automatically, allowing them to predict their cash position with real confidence, week after week.
Want to automate your reporting and finally trust your numbers? Book your free BI consultation and see how Vizule can help.
Measuring The Real-World Impact On Your Business
A data strategy is an investment, not just another expense. For any founder or business owner, the return on that investment can't be a vague promise of "better insights." It needs to show up in saved time, reduced costs, and improved profitability.
This means we need to move past the buzzwords and focus on the tangible, real-world value you should expect from a data strategy consultancy.

Often, the impact is both immediate and measurable. It starts with giving your team their time back. Think about the 10 to 20 hours your finance or ops team might be losing each week just wrestling with manual reports. Automating that process frees them up for more strategic, revenue-generating activities. Right away, you're looking at a direct boost in operational efficiency.
But the real value goes much deeper than just saved hours. A clear data strategy sharpens every financial and operational decision you make, leading to quantifiable improvements in the metrics that truly matter to your business.
Key Performance Indicators That Matter
When done right, your data strategy should move the needle in several key areas. Here’s what you should be tracking:
- Improved Forecast Accuracy: This is about moving from high-level guesswork to driver-based financial models. You'll be able to predict cash flow and revenue with much greater precision, significantly reducing nasty financial surprises.
- Reduction in Costly Errors: Automated data pipelines eliminate the human errors that inevitably creep into manual spreadsheets. This prevents expensive mistakes in everything from inventory management to financial reporting.
- Increased Team Productivity: Imagine your team getting answers in minutes, not days. With self-service Power BI dashboards, they can. This removes information bottlenecks and empowers them to act on insights much faster.
The ultimate measure of success is when your data stops being a historical record and becomes a forward-looking guide. It should reveal opportunities and risks before they become obvious, giving you a distinct competitive advantage.
To really see and measure the impact of your data initiatives, having strong advanced analytics capabilities is absolutely essential.
From Dashboards To Dollars
Let's look at a relatable scenario. A growing e-commerce business was struggling with inconsistent pricing across its huge product catalog. Their data was so fragmented in Shopify and various spreadsheets that they simply couldn't see which products were underpriced or which discounts were quietly eating away at their margins.
Once a unified sales and inventory dashboard was implemented in Power BI, they immediately identified specific pricing opportunities they were completely blind to before. By making a few targeted adjustments, they unlocked a 15% uplift in gross margin in just one quarter.
This is a perfect illustration of how the benefits of data-driven decision-making translate directly into measurable profit.
Tracking Your ROI Before and After Implementation
To truly grasp the shift, it's helpful to look at key metrics before you start and after your new data strategy is in place. Here's a quick look at the kind of transformation you should be measuring.
| Metric | Business Impact | Example Scenario |
|---|---|---|
| Time Spent on Reporting | Frees up valuable employee time for high-value tasks. | Before: 15 hours/week. After: 2 hours/week. |
| Forecast Accuracy | Reduces financial risk and improves resource planning. | Before: +/- 25% variance. After: +/- 5% variance. |
| Data Error Rate | Prevents costly mistakes in inventory, finance, or operations. | Before: 5-10 manual errors per month. After: 0 automated errors. |
| Speed to Insight | Enables faster, more agile decision-making across the business. | Before: 3-5 days for a report. After: Real-time dashboard access. |
The "after" column isn't just about better numbers on a spreadsheet; it's about building a more resilient, competitive, and profitable business. These metrics prove that a solid data strategy pays for itself many times over.
Want to automate your reporting and finally trust your data? Book a free call with our BI consultants today and discover the ROI hiding in your business.
How to Choose the Right Data Partner
Choosing a partner to guide your data journey is a critical decision. The right data strategy consultancy acts as a genuine extension of your team, while the wrong one can lead to expensive, unused dashboards and wasted time. The key is finding a firm that focuses on your business problems first and technology second.
A great partner will start by asking about your specific operational headaches and financial goals, not by pushing a one-size-fits-all software solution. They should be more interested in your business model than in their own tech stack.
Questions to Ask a Potential Consultancy
To cut through the jargon and find the right fit, you need a clear set of questions. These queries are designed to reveal their expertise, process, and whether they are a good fit for a growing SMB like yours.
-
"Can you share a case study from a business similar to ours?" Look for experience in your industry or with companies at a similar growth stage. Their past successes are the best predictor of your future results.
-
"What is your expertise in Power BI and financial modeling?" You need a partner who can build practical, driver-based models for forecasting cash flow and aligning operations—not just pretty charts.
-
"How do you handle project management and communication?" A clear, structured process with regular check-ins is non-negotiable. Vague answers here are a major red flag.
-
"How do you ensure our team adopts the new tools?" A project isn't successful if your team doesn't use the final dashboard. Look for partners who include training and ongoing support in their process.
A critical red flag is any consultant who promises instant, magical results without first digging deep into your business objectives. True data strategy is about solving specific business challenges, not just implementing technology.
Finding a partner who excels at connecting disparate systems is also essential. To understand this better, explore our guide on finding the right data integration consultants to ensure your new systems work together seamlessly.
Your goal is to find a consultative partner who will truly understand your vision and build a system that grows with you.
Sticking the Landing: How to Sidestep Common Data Project Pitfalls
Even the best-laid data plans can go sideways. For founders and operators, a failed data initiative isn't just a technical problem—it's a drain on capital, momentum, and team morale. The good news? Most of these pitfalls are completely avoidable if you know what to look for.
Many projects go off the rails for one simple reason: unclear objectives. A vague goal to "get better at data" is destined to fail. Contrast that with a razor-sharp objective: "Automate our weekly cash flow forecast, cutting the time our finance team spends on it from 10 hours down to 30 minutes." Now that's a project built to win.
Another classic mistake is building on "garbage data." You can have the most beautiful, interactive Power BI dashboard in the world, but if it’s pulling from messy, inconsistent source data, it’s just a pretty picture of inaccurate information. A good data strategy consultancy will help you clean up the foundation first, so you're not building a mansion on a swamp.
Nailing Down Success Criteria Before You Start
To avoid these headaches, you have to define what success looks like before any work begins. This isn't about micromanagement; it's about creating alignment and giving everyone a clear finish line to run towards.
Your success framework should spell out:
- What “Done” Actually Looks Like: What specific, tangible outcome signals the project is complete? For example: "Three critical financial reports are fully automated" or "we have a single, trusted dashboard for all sales and operational KPIs."
- Adoption and Usage Goals: A great dashboard nobody uses is a failure. Set a real target, like getting 80% of your leadership team actively using the main dashboard within 60 days of launch.
- Data Accuracy Benchmarks: Define your standard for reliability. A solid goal is ensuring the figures in your new BI dashboards match your core accounting system with 99.9% accuracy.
The real aim isn't just to launch a new tool. It’s to build a data-driven culture that lasts long after the consultants are gone. True success is when this new, smarter way of working becomes part of your company’s DNA.
By setting these goalposts early, you turn a fuzzy technical project into a focused business mission with a clear, measurable path to creating real value.
Your Questions, Answered
If you're an SMB owner or operator, you're probably wondering about the practicalities. How long does this take? What does it cost? Let's provide some straight answers.
For most of our clients, a foundational project—from the initial audit to a live, automated dashboard—takes between 4 to 8 weeks. In terms of budget, a typical engagement for a small business getting serious about data is between £10k and £30k. This approach delivers rapid insights without requiring a massive upfront commitment.
What Do I Actually Get?
So, what does an engagement deliver? We don't just build charts; we build a foundation for confident, data-driven decisions.
- Data Maturity Assessment & Roadmap: We start by understanding where you are now and chart a clear path to where you want to be.
- Cloud Data Warehouse Setup: We establish your "single source of truth," a central hub for all your business data.
- Automated Data Pipelines: We connect your tools and automate the manual work, saying goodbye to hours of copying and pasting into spreadsheets.
- Interactive Dashboards & Models: We build dynamic dashboards in tools like Power BI and create financial models that help you see around corners.
A common question is the difference between a data strategist and a data analyst. Think of the strategist as the architect who designs the blueprint to solve your business challenges, while the analyst is the skilled builder who creates the reports and digs into the data day-to-day. As consultants, we play the strategic role, setting you up with the right foundation for future analysis.
Our engagement models are flexible to match your needs:
- Fixed-Scope Projects: Perfect for a specific goal, like building your first automated financial dashboard.
- Monthly Retainer: For ongoing support, analysis, and continuous improvement.
- Hybrid Model: A mix of an upfront project followed by managed services to keep your data engine running smoothly.
No matter the model, we ensure deliverables, milestones, and timelines are crystal clear from day one.
How Do I Choose the Right Partner?
Choosing a consultancy is a big decision. Here are a few red flags to watch out for:
- They promise instant dashboards without taking the time to understand your business first.
- There’s no clear plan for getting your team to actually adopt and use the new tools.
- Their case studies are vague, or they can't provide solid client references in a similar space.
A good partner will be proud to show you detailed case studies, will have a solid plan for team training, and will obsess over tying every deliverable back to your core business KPIs.
Before you sign anything, make sure you ask these budget-related questions:
- What is the payment schedule?
- Are there any additional software licensing fees I need to be aware of?
- How do you handle requests that fall outside the original scope?
Getting clarity on these points builds a transparent relationship and ensures the project runs smoothly, getting you a return on your investment that much faster.
Ready to connect the dots in your data and unlock insight-led decision-making? Book a free discovery call with Vizule to see how we can help automate your reporting stack. Visit us at https://vizule.io to get started.


