


If you’re a business owner drowning in slow, unreliable Excel reports, you understand the frustration of trying to connect the dots between your sales, finance, and operations data. Star schema data modeling isn't just a technical term; it's the answer to that frustration—your path to clarity and speed.
Put simply, it's a proven method for organizing your business data in a way that makes reporting incredibly fast and reliable. It’s how you move from Excel chaos to automated reporting you can actually trust.
From Excel Chaos to Reporting Clarity
Think of your current data setup as a messy pile of books on the floor. Trying to find a specific fact is a nightmare. A star schema is like a perfectly organized library, where every piece of information has its place and is easy to find. This guide will show you how this model, especially when used with a tool like Power BI, can unite your sales, finance, and operations data into a single source of truth.
It’s time to end the painful cycle of manual data wrangling for good.
This isn’t about abstract theory; it's about real-world business impact. When your data is scattered across dozens of spreadsheets and different software, answering a simple question like, "Which product line was most profitable last quarter?" can take hours, or even days. You're stuck in a loop of copying, pasting, and trying to reconcile numbers that never seem to match up.
The Power of a Structured Model
A star schema completely changes this dynamic. It creates a clear, logical structure for your key business metrics, simplifying complex datasets into a format that’s built for one thing: fast, easy analysis. That's why it's the gold standard in business intelligence.
For a business owner or operator, the benefits are immediate:
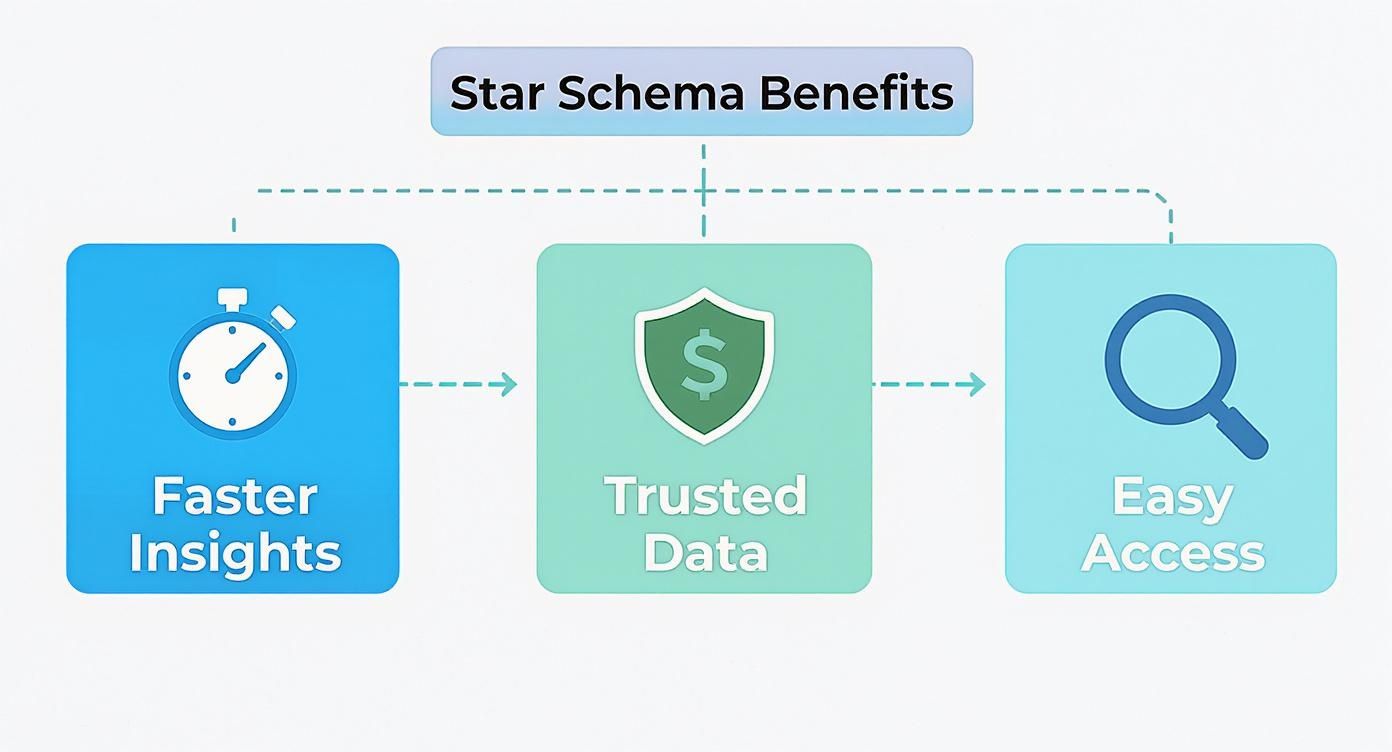
- Speed: Reports and dashboards that used to take ages to load will now refresh in seconds.
- Trust: Everyone from sales to finance is working from the same playbook. No more conflicting reports or arguments over whose numbers are right.
- Clarity: The model’s intuitive design makes it much easier for non-technical team members to understand what drives business performance.
This diagram shows a basic star schema. You have a central "fact" table (the numbers) surrounded by descriptive "dimension" tables (the context).

This elegant structure is what makes it so easy to "slice and dice" your data—like viewing sales by product, by region, or over a specific time period—all without wrestling with complex formulas.
Before and After Star Schema Data Modeling
The shift from messy, siloed data to a clean star schema model isn't just a technical upgrade; it's a fundamental business improvement. It moves you from reacting to past events to proactively shaping future outcomes. Here’s a look at the practical difference it makes for an SMB.
| Business Challenge | The Old Way (Excel Chaos) | The New Way (Star Schema in Power BI) |
|---|---|---|
| Answering Questions | Takes days of manual work. High risk of human error. | Questions are answered in seconds with a few clicks. |
| Data Trust | Multiple "versions of the truth" lead to confusion and arguments. | A single, trusted source of truth for the entire organization. |
| Performance Visibility | Difficult to see the "why" behind the numbers. Analysis is shallow. | Easy to drill down and see how different factors impact results. |
| Forecasting | Based on gut feelings and incomplete, often inaccurate, spreadsheets. | Built on a solid foundation of clean, reliable historical data. |
| Team Productivity | Your team spends 80% of their time cleaning data, 20% analyzing. | Your team spends their time on high-value analysis and finding insights. |
Ultimately, a star schema gives you the confidence to make decisions based on what the data is actually telling you, not what you think it's saying.
Modern Tools Make It Accessible
The good news is that you don't need a massive IT department to do this anymore. The evolution of data modeling tools has put star schema design within reach for almost any company.
In 2023, Microsoft Power BI reported that over 1.5 million active users were using its semantic modeling features, with a staggering 80% of them building star schema models for their reports. In one 2022 case study, a mid-sized retail chain cut its data modeling time from 12 weeks down to just 3 days using Power BI’s built-in capabilities.
The star schema has been around for decades for a reason: it works. You can learn more about why the star schema is still so relevant after 30 years on IterationInsights.com.
Why a Star Schema Actually Drives Business Performance
As a business owner, you care about results, not technical jargon. So why should you care how your data is structured? The answer is simple: a well-designed star schema directly translates into better, faster business decisions. Think of it as the high-performance engine under the hood of your financial and operational reporting.
When your data is a tangled mess, getting clear answers is slow and frustrating. A star schema cuts through that complexity. It makes your reporting tools feel light-speed responsive. This isn’t just an IT project; it’s a strategic advantage that hits your bottom line.
Speed and Real-Time Visibility
The first thing you'll notice is the sheer speed. Dashboards that used to churn for minutes—or even hours—now pop up in seconds. This isn't just a nice-to-have; it fundamentally changes how you interact with your company's data.
Imagine you're walking into a meeting and need the latest sales figures for a specific product line. Instead of firing off an email and waiting, you pull up a dashboard on your phone and get the answer instantly. That kind of real-time visibility means you can be proactive, spotting trends as they emerge and jumping on opportunities before the competition does.
A Single Source of Truth
Are you tired of meetings where the sales team's numbers don't line up with finance? That's a classic symptom of disconnected data silos. A star schema is the cure, unifying your data into one, trusted source of truth.
By pulling data from all your different systems—your CRM, accounting software, operational platforms—and organizing it into one cohesive model, you eliminate discrepancies. Everyone, from the founder to the front-line managers, is working from the same validated numbers.
This consistency builds trust across the organization. It ends the endless debates over "whose data is right" and lets your team focus on what the numbers actually mean for the business.
Empowering Your Entire Team
Perhaps the most powerful outcome is empowerment. The intuitive "hub-and-spoke" design of a star schema makes it incredibly easy for non-technical people to explore data and find answers on their own. This is a core idea in dimensional modeling, a topic we cover in more detail in our guide to what is dimensional modeling.
This self-service capability sparks a real data-driven culture. Your team is no longer bottlenecked, waiting for someone to run a simple report. They can independently dig into questions like:
- Which marketing campaigns are bringing in our most profitable customers?
- How does seasonality impact our inventory needs across different regions?
- What’s the lifetime value of customers we acquired through a new partner?
When your team can answer their own questions, they become more engaged, more innovative, and better at their jobs. This is the foundation you need to scale your business with confidence.
Understanding the Building Blocks of a Star Schema
To appreciate the power of star schema data modeling, let's break down its core parts using a simple sales scenario. Think about your business performance—you don't just want to know what you sold, but the story behind every sale. A star schema organizes this story into two parts: Facts and Dimensions.
I explain it to clients like a newspaper article. The headline gives you the main event (the fact), while the article provides the who, what, where, and when (the dimensions). This clean separation is what makes your data so quick and intuitive to analyze.
Facts: The Numbers You Measure
At the center of your star schema is the fact table. This table is all about the numbers—the measurable events you want to track. These are the core metrics that tell you what happened.
For an e-commerce business, your fact table would be loaded with numbers like:
- Sales Revenue
- Units Sold
- Discount Amount
- Cost of Goods Sold
Each row in a fact table represents a specific event, like the sale of three products in a single transaction. It’s the numeric pulse of your business.
The FactSales table in the middle holds only the numbers and keys, which makes it incredibly fast for calculations. All the descriptive context lives in the surrounding tables.
Dimensions: The Context Behind the Numbers
Facts are just numbers without context. That's where dimension tables come in. These tables surround the fact table and provide all the descriptive details that answer the crucial business questions: Who? What? Where? When?
Sticking with our sales example, your dimension tables would describe the context for each sale:
- Customer Dimension: Who made the purchase? (e.g., Customer Name, Location, Industry)
- Product Dimension: What was sold? (e.g., Product Name, Category, Brand, Size)
- Date Dimension: When did the sale happen? (e.g., Day, Month, Quarter, Year, Holiday)
- Store Dimension: Where did the sale occur? (e.g., Store Name, City, Region)
Each dimension table is a master list for a specific business concept. The Product dimension, for example, has one row for every single product you sell, detailing all its attributes. This setup prevents redundant data and ensures consistency across all your reports. To see how these tables fit into the bigger picture, take a look at our guide on the differences between a data model and a data warehouse.
This structure isn't just a clever trick; it's the industry standard. A 2021 global survey found that 68% of organizations using BI tools like Power BI build their data models on the star schema. The most common dimensions are no surprise: date/time (used in 98% of models), product (89%), customer (85%), and geography (76%).
Keys: The Glue That Connects Everything
So, how do the facts and dimensions connect? Through keys. Think of keys as unique ID codes that act as the glue, linking a row in the fact table to the right rows in the dimension tables.
For instance, a sales transaction in your fact table won't store the customer's full name and address. That would be slow and clunky. Instead, it holds a simple CustomerKey (like CUST-123). This key points directly to the CUST-123 row in your Customer dimension, where all that detailed info lives. This brilliantly simple system keeps the fact table lean and fast, while all the rich, descriptive context is just one join away.
By cleanly separating measurable facts from descriptive dimensions, the star schema creates a model that is easy for people to understand, lightning-fast to query, and trusted across the entire organization.
Building Your First Sales and Finance Model
Let's move from theory to the real world and see how a star schema solves the kind of problems businesses like yours face every day. We'll walk through two classic scenarios: building a sales model to understand revenue drivers and a finance model to get a clear view of profitability.
This is where you finally connect disconnected systems like your CRM and accounting software into one powerful, unified reporting structure. It's how you get that elusive 360-degree view of your business.

A Sales Model for Revenue Analysis
Every business leader wants to know what's driving sales. Which products are hot? Which regions are lagging? Who are your top-performing salespeople? Trying to answer these questions by pulling reports from different systems is a slow, painful process. A star schema cuts right through that complexity.
Picture a central fact table called 'Sales Transactions'. This is the heart of your model, containing only the core numbers from every sale:
- Revenue Amount
- Units Sold
- Discount Applied
- Shipping Costs
This table is lean and all about the numbers. It's then surrounded by dimension tables that provide all the rich context.
- 'Customers' Dimension: Details about who bought the product (customer name, company size, industry).
- 'Products' Dimension: Information about what was sold (product name, category, SKU).
- 'Date' Dimension: The all-important when (day, month, quarter, fiscal year).
- 'Sales Rep' Dimension: Context on the salesperson who closed the deal.
With this structure hooked up in a tool like Power BI, you can instantly slice and dice your revenue any way you want. Want to see sales for "Product X" in the "Northeast Region" sold by "Jane Doe" last quarter? It's just a few clicks away. For those pulling data from a CRM, following Salesforce best practices can make the data extraction process much cleaner from the start.
A Finance Model for Profitability Tracking
Now, let's pivot to finance. Your accounting software is great for bookkeeping, but it’s often rigid for strategic analysis. Trying to compare actuals to your budget or forecast can feel like pulling teeth. This is another perfect job for a star schema.
Here, our central fact table would be something like 'General Ledger Entries'. This table holds the transactional values straight from your financial system:
- Transaction Amount
- Budget Amount
- Forecast Amount
Again, this fact table is linked to descriptive dimension tables that give these numbers meaning.
- 'Chart of Accounts' Dimension: This organizes your transactions into standard financial categories like Revenue, COGS, or Operating Expenses.
- 'Departments' Dimension: This lets you slice financial data by business unit, such as Marketing, Sales, or R&D.
- 'Date' Dimension: Crucial for tracking performance over time and comparing different periods.
This finance model lets you break free from static P&L reports. You can build dynamic dashboards that allow you to drill down into variances, instantly see which departments are over or under budget, and analyze trends month-over-month.
A 2022 benchmark study found that data warehouses built on a star schema processed analytical queries up to 50% faster than those with more complex structures—a massive advantage for businesses that need to move quickly.
By unifying data from your CRM and your accounting software into these logical models, you create a single source of truth that gets everyone on the same page. Your sales and finance teams are finally looking at the same data, leading to more strategic conversations. If you want to go deeper, our guide on how to build powerful financial models offers even more detailed strategies.
Common Mistakes We See in Power BI Models
Building a solid star schema is as much about avoiding common traps as it is about following the rules. If you're coming to Power BI from the world of Excel, it’s easy to bring old habits with you. But what works in a spreadsheet can bring a Power BI project to its knees, leading to slow reports and data nobody trusts.
As BI consultants, we end up fixing the same handful of errors over and over again. Get ahead of these common slip-ups, and you'll build a powerful, scalable data model from the start.
The "One Giant Table" Mistake
The most frequent misstep we see is cramming everything into one massive, flat table. It's classic "Excel-think"—if you need customer details next to your sales figures, you just add more columns with VLOOKUPs. In Power BI, this is a one-way ticket to a performance nightmare.
Shoving all your data into a single table creates huge amounts of redundant data, bloating the file size and grinding your reports to a halt.
The Fix: Fully commit to the star schema. Keep your numbers (facts) in a lean, central table and all the descriptive context (dimensions) in separate, smaller tables. This single principle is what makes Power BI so fast and powerful.
Forgetting a Dedicated Date Dimension
Another massive oversight is failing to build a dedicated Date dimension table. Many businesses just use the date column straight from their sales transactions table, but this hobbles your ability to do any meaningful time-based analysis. A proper Date dimension isn't a nice-to-have; it's non-negotiable for serious business intelligence.
Without one, running standard time-intelligence calculations like comparing this quarter's sales to the same quarter last year becomes a messy struggle.
A good Date table should be a simple list of dates with columns for things like:
- Full Date
- Day of the Week
- Month Name and Number
- Quarter
- Fiscal Year
- Holiday Indicators
This structure gives you the power to slice and dice your data by any time period imaginable, unlocking a deeper understanding of trends and seasonality.
Creating Overly Complex Models
At the other end of the spectrum is the trap of over-engineering the model. Some teams get lost building intricate "snowflake" schemas, where dimension tables are linked to other dimension tables, creating long chains of relationships.
While there are niche scenarios where that makes sense, for 95% of reporting needs, a simple star schema just works better. Complex models are a headache for business users to navigate and often introduce performance lags for no real gain. The goal is clarity and speed.
Before you build anything, step back and think about the business questions you actually need to answer. Then, design the simplest possible model that gets the job done. This focus often leads you back to what truly matters: improving the quality of the information itself. For more on that, take a look at our guide on how to improve data quality for analytics you can count on.
Common Modeling Mistakes and How to Fix Them
To help you spot these issues early, here’s a quick-reference table outlining the most common modeling mistakes we see. Think of it as a cheat sheet for building a healthier, faster Power BI model.
| Common Mistake | Why It's a Problem | The Better Approach |
|---|---|---|
| The "One Big Table" | Creates massive data redundancy, slows down report performance, and makes the model inflexible. | Separate data into a central fact table (for numbers) and multiple dimension tables (for context). |
| No Date Dimension | Makes time-intelligence functions (YTD, MTD, etc.) incredibly difficult or impossible to write in DAX. | Create a dedicated Date dimension table with all necessary time attributes (Year, Quarter, Month, etc.). |
| "Snowflaking" Dimensions | Over-complicates the model, making it harder for users to understand and can slow down query performance. | Stick to a simple star schema. Denormalize smaller, related attributes directly into the main dimension table. |
| Using Bidirectional Relationships | Can create ambiguity in the model, leading to incorrect calculations and unpredictable filter behavior. | Use one-way relationships from dimension tables to fact tables whenever possible. Let DAX handle complex filtering. |
Getting these fundamentals right is the difference between a Power BI solution that empowers your team and one that just creates more frustration.
Ready to sidestep these common errors and build a data model you can finally trust? Vizule specialises in designing efficient Power BI solutions for SMBs. Book your free BI consultation to get started.
Ready to Build a Data Model You Can Actually Trust?
Let's pull it all together. At its core, star schema data modeling isn't a complex, theoretical exercise. It's the most practical way for any business that wants to stop guessing and start making confident, data-backed decisions.
This approach directly tackles the most common and frustrating pain points we see every day: hours wasted tracking down numbers, reports that nobody trusts, and critical data locked away in disconnected silos.
By structuring your information this way, you're not just organizing files—you're building a scalable foundation for real insight and growth. It's the most effective way to create a single, trusted version of the truth for your entire organization.
From Good Idea to Working Solution
Understanding what a star schema is is the first step. The next is actually building one. If you’re ready to move from theory to a practical solution that completely changes your reporting game, Vizule is here to help.
We act as your strategic partner, connecting the dots between your different data sources—from your CRM and accounting software to your marketing platforms—to build an automated reporting stack that works for you.
This isn't just about creating prettier dashboards. It's about unlocking the insights currently buried in your data. Our goal is to create a powerful, yet easy-to-use single source of truth database that empowers your team.
Adopting a star schema means you finally get to focus on what the numbers mean for your business, instead of spending hours just trying to find them. It’s the difference between reacting to old data and proactively driving future performance.
This strategic shift—from painful, manual data wrangling to automated, insight-led analysis—is what gives our clients a true competitive edge. It allows your finance and operations teams to align, ensuring everyone is finally working from the same playbook.
Ready to automate your reporting and finally trust your data? The journey from spreadsheet chaos to reporting clarity is faster than you might think.
Book your free BI consultation today to discuss your specific challenges and see how Vizule can help you finally trust your data.
Common Questions We Hear
Even after seeing the power of a star schema, it's natural for founders and business leaders to have some practical questions. Let's tackle the most common ones we hear from people ready to finally get a handle on their data.
How Is This Different From the Data in My CRM?
Great question. Your CRM, accounting software, or ERP is an operational system. It's built for speed—specifically, for capturing transactions one by one, all day long. It's fantastic for running the business minute-by-minute, but it's famously clunky and slow for analysis.
A star schema takes that same data and reshapes it into an analytical system. We essentially create a "reporting copy" of your data, but one that’s perfectly organized to answer business questions instantly. This way, your BI tool can fly through analysis without ever slowing down the core systems your team uses to do their jobs.
Does My Data Need to Be Perfect Before We Start?
This is a big one. Many businesses get stuck here, thinking they need perfectly clean data before they can even begin. The answer is a firm no.
In fact, the process of building a star schema is a powerful data-cleaning exercise. It forces you to define business rules and decide how to handle inconsistent data. As we build out the fact and dimension tables, we're naturally standardizing things—like merging five different spellings of a single customer's name. The modeling process is a huge part of the solution, not something that has to wait for perfection.
Do I Need a Big IT Team to Build This?
Not anymore. A decade ago, this was true. But modern BI tools, especially Microsoft Power BI, have brought star schema modeling out of the server room and into the hands of business analysts. You don't need a dedicated data engineer or a massive infrastructure project to get this off the ground.
With the right partner guiding the process, you can build a powerful and scalable data model using tools you might already be paying for. The game has changed from heavy technical lifting to smart, business-focused design.
How Long Does This Actually Take?
It’s much faster than you think. We’re not talking about a year-long project. For a specific, high-value area like sales performance or financial reporting, a foundational star schema can be built and delivering insights in a matter of weeks, not months.
Our philosophy is about delivering value fast. We pick one core business process, get a quick win, and build momentum from there. This way, you see a return on your investment almost immediately as we expand the model over time.
Tired of reports you can't trust? At Vizule Ltd, we specialize in transforming your scattered data into a clear, automated reporting engine. We connect the dots so you can focus on driving growth.
Book your free BI consultation to see how we can build a data model that works for your business.
