


If you're running a small or medium-sized business, you're probably living in a world of spreadsheets. Financials are in one file, sales metrics are in another, and critical operational KPIs are trapped in a completely different system. Sound familiar? This manual reporting chaos is a huge time-drain and makes it nearly impossible to get a clear, real-time picture of your business.
This exact problem is what business intelligence reporting solutions were built to solve. Think of a BI solution as the central nervous system for your company's data, connecting all the dots to give you a complete, up-to-the-minute view of performance in one place. It's the key to moving from gut-feel decisions to insight-led growth.
Moving Beyond Spreadsheet Chaos to Clear Insights

The daily grind of manual reporting is a familiar headache for business owners. You spend countless hours exporting data, copying and pasting figures, and wrestling with broken formulas just to get a basic snapshot of how things are going. By the time the report is finally ready, the data is already out of date.
This constant data chaos breeds uncertainty. It forces you to rely on gut feelings for critical decisions because you can't quite trust the numbers staring back at you. You know the answers are buried in your data somewhere, but you just don't have the right tools to connect the dots.
The True Cost of Data Silos
When your financial data doesn’t talk to your operational data, you’re essentially flying blind. This disconnect makes it nearly impossible to answer fundamental questions about your business, like:
- Which of our products are truly the most profitable when we factor in every single cost?
- How is our sales pipeline performance going to impact our cash flow next quarter?
- Are our marketing campaigns leading to valuable customers or just vanity metrics?
Without a single, unified view, different teams end up working from different versions of the truth. This leads to misaligned priorities and a whole lot of wasted effort. It’s here that BI reporting solutions offer a direct and practical fix, turning fragmented information into a powerful strategic asset. Our complete guide on business intelligence for small businesses walks you through how to make this transition smoothly.
The move toward BI isn't just a fleeting trend; it’s a fundamental change in how modern companies operate. The global BI market, valued at around $31.98 billion in 2024, is expected to skyrocket to $63.20 billion by 2032, which shows just how vital these tools are becoming.
The Shift from Manual Reporting to Automated BI
Making the leap from spreadsheets to a dedicated BI solution isn't just about getting fancier charts. It's about fundamentally changing how you interact with your business data, moving from reactive fire-fighting to proactive strategy.
| Challenge with Manual Reporting | How BI Reporting Solutions Solve It |
|---|---|
| Time-Consuming & Repetitive: Hours are wasted every week on copying, pasting, and formatting data. | Full Automation: Connects directly to data sources (like QuickBooks or your CRM) and updates reports automatically. |
| Prone to Human Error: One wrong formula or copy-paste mistake can skew the entire report. | Single Source of Truth: Pulls all data into one central location, ensuring everyone works with the same, accurate numbers. |
| Outdated by Completion: The data is already old by the time the report is shared. | Real-Time Insights: Dashboards update instantly, giving you a live view of business performance. |
| Lacks Depth: Spreadsheets make it difficult to drill down and explore the "why" behind the numbers. | Interactive & Dynamic: Allows you to filter, slice, and drill down into the data to uncover deeper trends and root causes. |
This table really just scratches the surface. A well-designed BI solution automates the entire reporting process, freeing you and your team from low-value, repetitive tasks.
A business intelligence solution does more than just create charts; it builds a reliable, automated data foundation that allows you to stop managing spreadsheets and start managing your business with confidence.
Instead of spending your time compiling reports, you can finally focus on analyzing performance, spotting new opportunities, and making insight-led decisions that drive real growth. For any industry that relies on data, like finance, understanding the broader applications of tools like Business Intelligence for Banks can offer valuable parallels for building a competitive edge.
How a BI Solution Actually Works
If you're a non-technical founder, "business intelligence reporting solution" probably sounds like a mouthful of corporate jargon. But when you pull back the curtain, the process is actually pretty logical. It's not about complex code; it's about connecting the dots between the tools you already use.
The process boils down to three distinct stages. Each one builds on the last, turning a mess of raw information into something clear and genuinely useful. Once you see the components, the whole thing becomes a lot less intimidating for any business leader.
Your Raw Ingredients: The Data Sources
Every BI journey starts with the raw ingredients—your data. This information is scattered across all the different software platforms you use every day to keep the lights on.
Your key data sources likely include things like:
- Financial Data: All your critical P&L, balance sheet, and cash flow information lives inside tools like QuickBooks or Xero.
- Sales & Customer Data: Your CRM, whether it's HubSpot or Salesforce, is packed with vital details on leads, deals, pipeline velocity, and customer history.
- Operational Data: Platforms like Shopify for e-commerce, your project management tool, or inventory systems are tracking the daily grind that actually drives revenue.
Right now, this data is probably stuck in silos. It’s useful in its own little world, but its true power is locked away until you can get it all in one place. That's where the next step comes in.
The Prep Station: Data Transformation
This is where the real work begins. A BI solution automatically plugs into all those separate data sources and pulls everything into a central, organized workspace—often called a data warehouse. This is the most important part of any business intelligence reporting solution.
Here, the system does a few things automatically:
- Extraction: It pulls the latest data from your connected systems on a schedule, whether that's daily, hourly, or even more often.
- Cleaning: It standardizes formats, fixes errors, and gets rid of duplicate entries. A classic example is making sure "ABC Corp" and "ABC Corporation" are treated as the same customer.
- Modelling: It creates logical connections between different datasets. This is how you can finally see how a marketing campaign in one system directly influenced sales in another.
This automated prep work ensures the data is reliable, consistent, and ready for analysis. It completely eliminates the manual copy-paste routine and kills the risk of human error that haunts spreadsheet reporting. For a deeper look at this, you can learn more about what business intelligence and analytics involves in our detailed guide.
The Final Dish: Reporting and Visualization
At last, we get to the part you and your team actually see and use. This is the reporting and visualization layer, where tools like Microsoft Power BI turn all that clean, connected data into something you can actually understand.
This concept map shows how these three core components—data collection, report generation, and delivery—fit together to create the final solution.
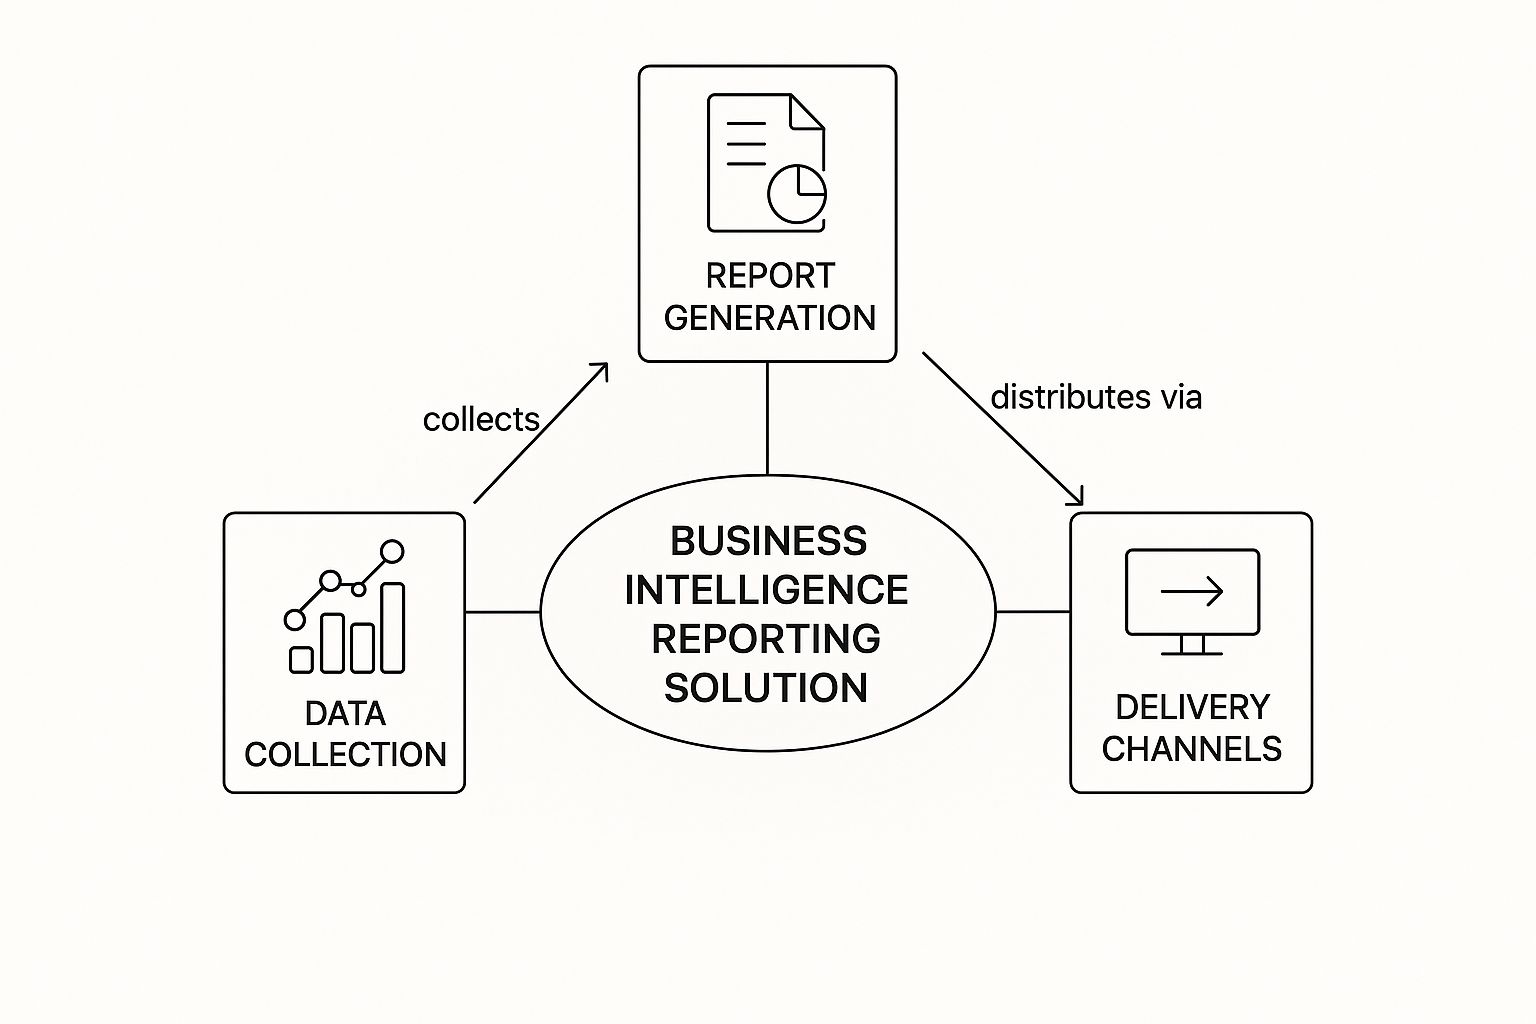
As you can see, the process flows from gathering the raw data to automatically building reports, and finally, delivering them through dashboards your team can actually use.
Instead of static, lifeless spreadsheets, you get dynamic, interactive dashboards. You can click on a sales number to see the exact products behind it, filter by date ranges to spot trends, and drill down from a high-level KPI to the individual transactions that built it.
This is the final output that lets you stop guessing and start making sharp, data-backed decisions. It connects the dots between your finances, sales, and operations, giving you the clarity you need to scale with confidence.
Unlock Strategic Benefits for Your SMB
As a busy founder, you don't invest in tech for the sake of it. You invest in real business outcomes. A BI reporting solution isn't about making pretty charts; it's a strategic play designed to deliver tangible returns in four critical areas for any growing business.
These benefits hit right at the core of the most common frustrations we hear from operators: the time wasted, the opportunities missed, and that nagging uncertainty that comes from not fully trusting your own data. Let’s break down the practical, game-changing outcomes you can expect.
Establish a Single Source of Truth
How many meetings have you sat in where the sales report shows different numbers than the finance spreadsheet? Those debates over conflicting data are more than just unproductive—they kill trust across the entire organization.
A well-implemented BI solution cuts through that noise by creating a single source of truth. It connects directly to your core systems—your accounting software, CRM, and operational platforms—pulling everything into one unified, reliable hub.
This means everyone, from the leadership team down to the front lines, is working from the same validated set of numbers. The conversation instantly shifts from questioning the data's accuracy to making strategic moves based on it.
Automate Your Manual Reporting
Just think about the hours you or your team burn every week manually pulling reports. It’s a mind-numbing cycle of exporting CSVs, copying and pasting data, and fixing formulas that mysteriously broke. This isn't just inefficient; it's a massive opportunity cost.
Business intelligence reporting tools are built for automation. Once you set them up, your key dashboards and financial models refresh automatically—daily, hourly, or whenever you need them.
This automation frees up your single most valuable resource: your time. Instead of spending hours buried in low-value data entry, you and your team can focus on what actually moves the needle—analyzing performance, spotting trends, and planning your next move.
Imagine starting your Monday morning with a fully updated view of last week's performance, ready and waiting for you. That's the power of automation.
Uncover Deeper Performance Insights
Spreadsheets are great for organizing data, but they’re terrible at telling you the stories hidden inside it. A static P&L statement might show you what happened, but it rarely explains why it happened.
This is where a BI solution really shines. With interactive dashboards, you can drill down from a high-level KPI all the way to the specific transactions driving that number.
- Discover True Profitability: See your margins not just by product, but by customer, sales channel, or even marketing campaign to find out where you're really making money.
- Understand Customer Behavior: Pinpoint your most valuable customer segments and identify purchasing patterns that can reshape your sales and marketing efforts.
- Optimize Operations: Spot bottlenecks in your processes or inefficiencies in your supply chain that were completely invisible in separate, siloed reports.
To get even more focused insights, dedicated marketing intelligence software can provide a competitive advantage that goes far beyond basic reporting.
Build a Scalable Foundation for Growth
The manual reporting systems that worked when you were just starting out will eventually buckle under the pressure of growth. As you add more customers, products, and employees, your spreadsheets become slower, more complex, and dangerously prone to errors.
Implementing a BI solution builds a data foundation that scales with you. It’s designed to handle massive volumes of data without sacrificing speed or reliability. This is about building your business on solid ground, not a fragile house of cards.
This isn't just an IT trend anymore; it's becoming standard practice in sectors like retail and finance. With the rise of on-the-go analytics, the mobile BI market alone is projected to hit $51.5 billion by 2032. You're not just adopting a tool; you're future-proofing your operations.
Essential Features of a Modern BI Solution

Not all business intelligence reporting solutions are built the same. This is especially true when you’re running a small or medium-sized business and need value now, not some clunky enterprise system that takes a year to figure out.
Choosing the right tool means focusing on the features that will genuinely solve your problems. It’s about cutting through the noise and finding the capabilities that directly attack the chaos of manual spreadsheets, freeing you up to make smarter, faster decisions.
Interactive and Drill-Down Dashboards
The single biggest upgrade you’ll get over Excel is moving from static reports to dynamic, interactive dashboards. A great dashboard doesn't just show you a top-line number; it invites you to ask "why?" and get an answer instantly.
Imagine seeing that your gross margin dropped by 5% last month. In a spreadsheet, that’s the start of a long, manual investigation. With an interactive dashboard, you just:
- Click the KPI: Instantly see the margin broken down by each product line.
- Filter by Region: Isolate whether the drop came from a specific market.
- Drill Down to Transactions: Go all the way down to the individual sales orders that caused the dip.
This ability to explore your data in real-time turns you from a passive report-reader into an active business investigator.
Automated Data Refreshes
Let's be honest, the endless cycle of exporting, copying, and pasting data is a soul-crushing time sink. A core feature of any BI solution worth its salt is automated data refreshes. Your BI tool should connect directly to your data sources—your QuickBooks, CRM, or e-commerce platform—and pull the latest information on a schedule you set.
You can have reports update every night, every hour, or on-demand. This ensures that every time you look at your dashboard, you're seeing the most current, accurate picture of your business. The days of making decisions on last week's numbers are over.
Broad Data Source Connectors
Your business data lives all over the place, so your BI solution shouldn't be locked into one source. A critical feature is a wide range of data source connectors. A powerful tool like Microsoft Power BI can natively connect to hundreds of different applications and databases right out of the box.
A BI solution's true power is its ability to unify your siloed information. By connecting everything from your accounting software to your marketing analytics tools, it builds a complete, 360-degree view of your business performance.
This completely eliminates the need for manual data blending in spreadsheets and finally lets you see how activity in one part of the business truly impacts another. To help you navigate the options, we put together an in-depth business intelligence tools comparison guide.
When you're trying to pick a solution, it's easy to get lost in a long list of features. To simplify things, here's a table that breaks down the must-haves for most SMBs and explains exactly why they matter.
Essential BI Features for SMBs
| Feature | Why It Matters for Your Business |
|---|---|
| Interactive Dashboards | Lets you dig into your data to find the "why" behind the numbers without needing a data analyst. |
| Automated Data Refreshes | Eliminates manual report updates, saving you hours and ensuring your data is always current. |
| Multiple Data Connectors | Connects all your scattered data sources (finance, sales, marketing) into one unified view. |
| Customizable Visuals | Allows you to create reports that make sense for your business, not just generic templates. |
| Scheduled Reporting | Automatically sends key reports to your team via email or Slack, keeping everyone informed. |
Focusing on these core capabilities will ensure you get a tool that delivers real, measurable value from day one. At Vizule, we help founders configure these exact features in Power BI to solve their specific challenges.
Want to automate your reporting and finally trust your data? Book a free call with our BI consultants today.
Your First BI Implementation Roadmap
Getting started with a business intelligence solution can feel like a huge undertaking, especially for small and medium-sized businesses. The whole idea often brings up images of massive, multi-month projects that grind the entire company to a halt.
But it doesn't have to be that way. The secret to a successful first implementation is to think small. Focus on one high-value problem, solve it brilliantly, and build momentum from there. This is a structured, practical approach that delivers real value right away and makes the whole process less intimidating. More companies are catching on to this, with global spending on BI software projected to hit around $72.1 billion in a single year as tools become more accessible. You can learn more about the growing BI market landscape on hginsights.com.
At Vizule, we walk our clients through a proven roadmap that turns data chaos into genuine clarity. It ensures your first step into BI is a confident one.
Phase 1: Define Your Core Business Questions
Before we even glance at a spreadsheet or think about a dashboard, we start with one simple question: "What's the most critical business question you can't answer today?"
This discovery phase is, without a doubt, the most important step. We work with you to find your single biggest reporting headache.
Are you wrestling with things like:
- Cash Flow Visibility? You need to know how your sales pipeline will affect your bank balance in 60 days.
- True Profitability? You’re not sure which products or customers are actually making you money after all the costs are tallied up.
- Sales Performance? Your team is flying blind, lacking clear, real-time data on how fast deals are moving through the pipeline.
By zeroing in on one core problem, we create a clear finish line for the project. This makes sure your very first dashboard delivers an immediate, tangible solution to a real business problem.
Phase 2: Connect and Model Your Data
Once we have the question, we figure out the bare minimum data sources needed to answer it. This usually just means hooking into two or three key systems, like your accounting software (QuickBooks, for example) and your CRM (like HubSpot).
This is where the magic happens behind the scenes. We build a data model that automatically:
- Pulls the right data from your systems.
- Cleans and standardises the information so everything matches up.
- Builds relationships between the different datasets (like linking a customer in your CRM to their invoices in QuickBooks).
This phase creates the rock-solid foundation for your entire BI setup. It’s the step that guarantees your data is reliable, accurate, and ready to be trusted for mission-critical decisions.
Phase 3: Design and Iterate Your First Dashboard
With a trustworthy data model in place, we can finally design your first dashboard. The goal here isn't to cram every metric imaginable onto a single screen. It's about creating a clean, intuitive view that directly answers the one big question we identified back in Phase 1.
Our philosophy is 'start small and iterate'. We build the first version of the dashboard, get your feedback, and then fine-tune it. This back-and-forth makes sure the final product is genuinely useful and something your team will actually want to use.
This first win builds confidence and delivers a clear ROI, paving the way for future projects where we can start tackling your other business questions, one by one.
This structured roadmap transforms what could be an overwhelming project into a manageable and rewarding journey. It positions Vizule not just as a service provider, but as a strategic partner dedicated to guiding you toward lasting data clarity.
Ready to map out your own BI journey? Book a free call with our consultants to discuss how this process can be tailored to solve your most pressing reporting challenges.
Common Questions About BI for SMBs
Even with a clear plan, pulling the trigger on a business intelligence solution can feel like a massive step. As a founder or operator, you have to know that every dollar and every hour you invest is going to deliver a real return. We get it. Over the years, we've heard the same practical questions from hundreds of SMBs on the verge of making the jump.
Let's tackle those questions head-on. No fluff, no jargon—just straight answers that speak to the reality of running a growing business.
Is a BI Solution Too Expensive for My Small Business?
This is probably the biggest myth we have to bust. The short answer? Not anymore. A decade ago, sure, BI was a luxury reserved for massive enterprises with even bigger IT budgets. But modern tools have completely changed the field.
Platforms like Microsoft Power BI have made powerful analytics incredibly accessible and affordable. When you actually run the numbers, a well-designed BI solution often costs significantly less than the salary of a single full-time analyst.
More importantly, think about the "soft costs" you're already paying. How many hours does your team sink into manual reporting every month? What's the cost of a bad decision made on shaky data? What about the opportunities you can't even see? That's where the real ROI kicks in, and fast.
A boutique consultancy like Vizule specialises in creating lean, high-impact business intelligence reporting solutions built for an SMB's budget. We focus on solving your single biggest pain point first, so you only pay for what you need to see immediate, measurable value.
My Data Is a Mess. Do I Need to Fix It First?
This is the second most common reason businesses hesitate. The idea that your data needs to be “perfect” before you can even start with BI is a total myth. In fact, waiting for data perfection is the number one reason BI projects die on the vine.
A core, fundamental part of any BI project is the data transformation process. This is where the magic happens. We don't expect you to hand us flawless data; our job is to bring order to the chaos.
Here’s how it works:
- We find the critical sources: First, we pinpoint the essential data needed to answer your key business questions and ignore all the noise.
- We build automated workflows: Next, we create data pipelines that automatically pull, clean, standardize, and connect your information.
- We create a single source of truth: The BI solution itself becomes the engine that forges a unified view from all your messy, siloed inputs.
You don't need a pristine setup to get started. You just need a clear idea of the business questions you’re trying to answer. The BI solution is the tool that fixes the mess, not the other way around.
How Long Does It Take to Get a BI Solution Running?
The timeline to see real, tangible value is much shorter than most founders think. We're talking weeks, not months or years. Our whole approach at Vizule is built around delivering quick wins that generate immediate momentum.
For most SMBs, a foundational project focused on automating key financial or sales reports can deliver the first set of valuable dashboards in just a few weeks. We don't believe in long, drawn-out projects that leave you wondering where your money is going.
Our roadmap always starts by solving your single most pressing reporting problem. This gets you a tangible return on your investment early, building trust and confidence in the system. From there, we can iterate and expand the solution to tackle your other strategic priorities one by one.
Will My Team Be Able to Use the Dashboards Easily?
Absolutely. The days of BI being a tool for data scientists are long gone. Modern reporting platforms are designed from the ground up to be user-friendly and intuitive, especially for people who don't live and breathe data.
We build dashboards in Power BI with your end-users as our top priority. If you can use a website, you can explore your data. The entire experience is designed to be interactive and empowering.
- Self-Serve Answers: Your team can filter, slice, and drill into the data to answer their own questions without needing to file a ticket with an analyst.
- Intuitive Design: We focus on clean, clear visuals that tell a story at a glance, avoiding cluttered screens and confusing charts.
- Targeted Training: We provide hands-on training that’s tailored to your team's needs, making sure everyone feels confident from day one.
The goal is to build a culture of data-driven decision-making. That can only happen when the tools are easy and accessible for everyone.
Ready to stop wrestling with spreadsheets and start making insight-led decisions? The team at Vizule specialises in building custom Power BI solutions that give SMB founders the clarity and control they need to scale with confidence.
Book your free BI consultation today and see how we can help automate your reporting stack.


