


Are you tired of wrestling with messy spreadsheets to understand your business performance? A data warehouse is the central, trusted library for all your business data—from sales and finance to marketing and operations. For a growing business, this is the pivotal step to finally stop relying on manual reports and start generating automated, reliable insights that actually drive smart decisions. It becomes your company's single source of truth, ending the chaos for good.
Escaping the Spreadsheet Nightmare

If your business is running on a tangled web of Excel files, CRM exports, and disconnected reports, you're not just being inefficient—you're flying blind. Many small and mid-sized business owners know this pain all too well.
It's that constant, draining cycle of manual data entry. It's the sheer frustration of seeing conflicting numbers from different departments. And it's all those hours wasted compiling reports that are already outdated the second they’re finished.
This "spreadsheet nightmare" isn't just a minor headache; it actively holds back your growth. When your finance team’s revenue numbers don’t line up with what’s in the sales CRM, how can you forecast with any confidence? When you spend half of every Monday just pulling and cleaning data, when do you find the time for actual strategic thinking? This is the reality for countless businesses trying to scale with tools never meant for complex, multi-source data analysis.
The Problem with Disconnected Data
The core issue is that your most valuable information lives in isolated silos. Each platform—your QuickBooks for finance, HubSpot for sales, or Google Analytics for marketing—holds a critical piece of the puzzle. But without a way to bring them all together, you can never see the full picture.
This siloed approach leads to common frustrations that directly hit your bottom line:
- Inaccurate Reporting: Manual copy-pasting is a recipe for human error, leading to major decisions based on flawed information.
- Wasted Time and Resources: Your team spends valuable hours on low-value data prep instead of high-value analysis and strategy.
- Lack of a Unified View: It's nearly impossible to accurately calculate critical cross-functional metrics like customer lifetime value (CLV) or cost of customer acquisition (CAC).
For a growing SMB, creating a data warehouse isn't a complex IT project. It’s the foundational step to automate reporting, make confident decisions, and finally get a clear, unified view of performance.
This is precisely where a data warehouse changes the game. It acts as a central hub, automatically pulling, cleaning, and organizing information from all your systems into one reliable place. It's the engine that powers modern business intelligence, turning data chaos into clarity. For any business ready to move beyond tedious manual work, learning how to automate Excel reports with a more robust system is a crucial first move.
Ready to build a system that delivers trustworthy insights on demand?
Book your free BI consultation today and let our experts design a data strategy that fuels your growth.
Why a Central Data Hub Is Your Growth Engine
Let's cut through the technical jargon. A data warehouse isn't about complex code; it's about getting a complete, real-time picture of your business so you can make smarter moves.
Imagine seeing a customer’s entire story in one place. You watch their journey from the first click on a Google Ad, to their chat with sales in your CRM, right through to their purchase history in Stripe and any support tickets they’ve raised. This isn't some far-off dream—it's exactly what a central data hub makes possible.
This unified view puts an end to the frustrating guesswork that comes from scattered data. No more boardroom debates over which department's "revenue" number is the right one. No more manually trying to connect the dots between your marketing spend and actual sales.
From Scattered Data to a Strategic Asset
When all your data lives in one place, you stop putting out fires and start building a strategy. You can finally get solid answers to the big questions that used to be impossible to tackle.
- What's our true Customer Lifetime Value (CLV)? By connecting acquisition costs from your marketing tools with long-term purchase data from your payment processor, you can see which channels bring in the most profitable customers, not just the most leads.
- Which marketing campaigns are really driving sales? You can move past surface-level clicks and attribute revenue directly back to specific ads, content, or promotions.
- How do we build a financial forecast that isn't just a guess? Your financial models can pull live data directly from your sales pipeline and operations, making them dynamic and far more accurate.
This is precisely why creating a data warehouse is no longer just for massive corporations. The global market for data warehousing was valued at around $13 billion in 2018 and was projected to soar to nearly $30 billion by 2025. It's a clear signal of its growing importance for ambitious businesses of all sizes. You can check out more of these data warehouse market trends on 99firms.com.
The Power of a Single Source of Truth
At its heart, a data warehouse gives you a single source of truth. This concept is the bedrock of scalable growth. When everyone in the company—from finance to marketing to operations—is working from the same, verified data, alignment just… happens.
A single source of truth eliminates persistent headaches like inconsistent KPIs, manual report building, and endless debates over whose numbers are right. It turns your data from a messy collection of files into a reliable, strategic asset you can bet on.
Instead of arguing about data, your teams can focus their energy on what the numbers actually mean and what to do next. We dive deeper into this foundational concept in our guide to achieving a single source of truth for your data.
Ultimately, having this central hub doesn't just tidy up your data; it unlocks its true potential to fuel genuine, sustainable growth.
Your Practical Data Warehouse Blueprint
Building a data warehouse isn't an engineering puzzle—it's a business strategy. Forget complex diagrams for a moment. This is a practical framework for business leaders who need results, starting with the questions you need to answer and the data you already have.
The whole process kicks off by figuring out your most critical data sources. For most businesses, this isn't some overwhelming list. It's usually a handful of platforms you live and breathe in every single day.
Start with Your Core Systems
The biggest mistake we see is trying to boil the ocean. The initial goal is simple: connect the vital systems that, together, tell the complete story of your business's performance. Just think about where your most important data lives right now.
- Financial Data: Your accounting software—think QuickBooks or Xero—holds the ultimate truth about your revenue, costs, and profitability.
- Sales & Customer Data: This is your CRM, like HubSpot or Salesforce. It tracks your entire pipeline, every sales activity, and all customer interactions.
- Transaction Data: Payment processors like Stripe or Square give you the granular, line-by-line detail on every single sale.
- Web & Marketing Data: Tools like Google Analytics show you the customer journey—how they find you and what they do on your site.
When you're designing this blueprint, knowing how to pull data from core business systems is absolutely essential for creating a single source of truth. If you're using a larger, more integrated platform, an ERP system implementation guide can be a lifesaver for understanding how to consolidate that data. The objective is to get a seamless flow of information from these platforms into your central hub.
The real secret to success? Start small. Pick one high-impact area, like sales performance or financial reporting. Get a quick win on the board to prove the value of your data initiative from day one.
Trying to connect everything at once is a classic rookie error that leads to long, expensive projects with zero immediate payoff. Instead, choose the business area causing you the most headaches or offering the biggest opportunity. Is it that painful weekly sales report? Or maybe the monthly financial close process that takes forever? Start right there.
This flow chart perfectly visualizes how moving from scattered data to a centralized hub directly fuels business growth.
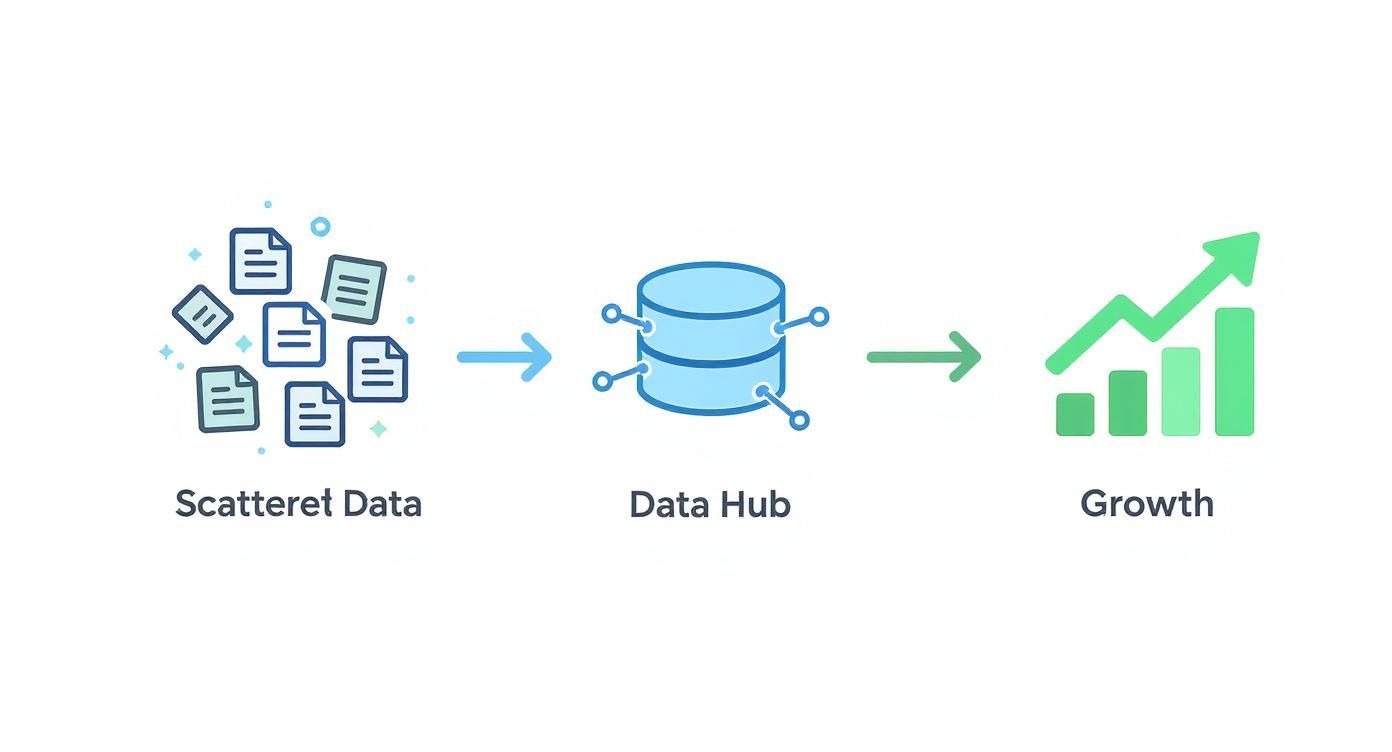
By bringing this information together, you’re not just cleaning up data; you’re laying the foundation for scalable insights and much smarter decision-making down the road.
Define Your Key Business Questions
Once you've picked your focus area, the next step is to get crystal clear on the business questions you need to answer. This is so much more effective than just listing random metrics you think you should track. Good questions are what guide the entire design of the warehouse.
For example, if you chose sales performance as your starting point, your key questions might be:
- Which sales reps are consistently hitting their targets, and what do their activity levels actually look like?
- What's our average time-to-close for a deal, from the moment a lead comes in?
- Which marketing channels are bringing in the leads that actually convert into high-value customers?
See how that works? These questions immediately tell you exactly which data points you need to pull from your CRM, marketing platform, and payment processor. This focused approach naturally builds the requirements for your first automated dashboard without getting bogged down in endless technical meetings.
This first project is all about building momentum and showing a clear ROI. Once you have a reliable data pipeline feeding into your warehouse, you can start building powerful reports in tools like Power BI. If you want to dive deeper into that part of the process, check out our guide on how to build a data pipeline.
This strategic, question-led approach ensures your data warehouse is built for a clear business purpose right from the very beginning.
Choosing the Right Tools Without the Headaches
The world of data tools can feel like a maze, but here’s the good news: building a data warehouse today is nothing like it was a decade ago. You don't need a room full of blinking servers or a small army of engineers anymore. The modern approach is all about smart, cloud-based tools that are affordable, scalable, and genuinely user-friendly.
For a small or medium-sized business, this is a massive advantage. You can now build a seriously powerful data setup using just a handful of subscription services. This means no eye-watering upfront costs—you simply pay for what you use and scale as your data and business grow.
The modern data stack really just boils down to three key parts. Think of it as a simple system designed to get data from all your different apps into a dashboard where you can finally make sense of it.
The Three Core Components of Your Data Stack
You don't need a dozen different tools to get this right. A solid, automated reporting pipeline really only needs these three pieces working together.
-
The ETL Tool (The Transporter): First, you have to get your data out of its silos. An ETL (Extract, Transform, Load) tool does this for you automatically. It connects to platforms like QuickBooks, Stripe, or Google Analytics, pulls the data, cleans it up, and sends it on its way.
-
The Cloud Data Warehouse (The Central Library): This is the heart of your entire operation. It's a specialized, cloud-based database built to hold massive amounts of structured data from all your sources. Platforms like Google BigQuery, Snowflake, or Amazon Redshift become your single source of truth, keeping everything organized and ready for analysis.
-
The BI Tool (The Storyteller): This is where the magic happens. A Business Intelligence (BI) tool like Power BI plugs directly into your data warehouse. It’s what you use to explore the data, run calculations, and build the dynamic, automated dashboards that show you exactly how your business is performing.
This cloud-first model is quickly becoming the industry standard. The market for Data Warehouse as a Service (DWaaS) was valued at around $80.6 billion in 2024 and is on track to hit an incredible $390 billion by 2032. This explosive growth, detailed in this DWaaS market growth analysis on GlobeNewswire, shows just how many businesses are ditching clunky, old-school systems for flexible cloud solutions.
Making an Informed Decision for Your Business
Picking the right tools isn't about finding the single "best" option out there. It's about finding the best fit for your budget, your team's skills, and what you're trying to achieve.
For example, when it comes to ETL, tools like Fivetran or Stitch offer hundreds of pre-built connectors that turn data integration into a simple point-and-click process. No coding needed.
For the warehouse itself, BigQuery is often a fantastic starting point for SMBs. It has a generous free tier and plays nicely with other Google products you're probably already using. And for the final BI layer, Power BI is a powerhouse, especially if your business already operates within the Microsoft ecosystem.
To give you a clearer picture, we've put together a simple table comparing some of the top cloud data warehouse choices for businesses like yours.
Comparing Cloud Data Warehouse Options for SMBs
| Platform | Best For | Key Advantage for SMBs | Typical Starting Cost |
|---|---|---|---|
| Google BigQuery | Businesses new to data warehousing or already in the Google ecosystem. | Very generous free tier and serverless architecture mean you only pay for queries you run. | Often $0 to start, scales with usage. |
| Snowflake | Companies needing flexibility to scale compute and storage independently. | Easy to use and separates compute from storage, so you don't pay for processing power when idle. | Starts around $25/month + usage fees. |
| Amazon Redshift | Organizations heavily invested in the AWS ecosystem. | Deep integration with other AWS services and strong performance for complex queries. | Starts around $0.25/hour for on-demand nodes. |
This isn't an exhaustive list, but it highlights the main players and how they position themselves for smaller businesses. Each has its strengths, and the right one depends entirely on your specific situation.
The goal isn't to become a data engineer overnight. It's about selecting a set of modern, user-friendly tools that do the heavy lifting for you, empowering you to focus on the insights, not the infrastructure.
Navigating all the options can still feel a bit overwhelming. To help you sort through it, we put together a guide that dives deeper into the visualization and reporting side of things. You can check out our business intelligence tools comparison to see how the leading platforms stack up for different scenarios.
Ultimately, the right tools are the ones that get you from data chaos to clarity with confidence.
Ready to design the right data stack for your business? Book a free BI consultation and let's map out a solution that fits your unique needs.
Bringing Your Data to Life with Power BI
Once your data has a central, reliable home, the real magic begins. Building a data warehouse isn't just about storage; it's about creating a powerful engine that makes everything else possible. This is where we finally connect the dots and turn raw, organized numbers into genuine business insights.
With your new data warehouse in place, a tool like Power BI can connect directly to it. This unlocks the ability to create dynamic, automated dashboards that were a pipe dream when your data was trapped in spreadsheets and siloed apps. Honestly, this is the ultimate payoff for all your hard work.
From Raw Data to a Consolidated Dashboard
Let's walk through a real-world scenario. Imagine you're a growing business and you want a single, consolidated view of your financial performance. That means pulling live data from your accounting, sales, and marketing systems.
Before, this was a manual nightmare. You’d export a CSV from QuickBooks for your P&L, another from your CRM for the sales pipeline, and maybe another from your ad platforms to see marketing spend. Then you'd spend hours wrestling with VLOOKUPs in Excel, knowing the report was outdated the second you finished. Sound familiar?
With a data warehouse, the process is completely different. Power BI plugs directly into this central hub, accessing pre-cleaned and structured data from all those sources at once.
The result is a dynamic financial performance dashboard that’s always up to date. You can slice and dice your data in real-time to answer critical questions without ever touching another spreadsheet.
This setup allows you to visualize the metrics that truly drive the business forward, all in one place:
- Profitability by Product/Service: Finally see which offerings are actually making you money by connecting sales data from your CRM with cost data from your accounting software.
- Customer Acquisition Cost (CAC) vs. Lifetime Value (LTV): Automatically track how much you spend to acquire a customer against the revenue they generate over their lifetime.
- Sales Pipeline vs. Financial Forecast: Compare your live sales pipeline against financial targets to spot potential shortfalls weeks—not days—in advance.
To make these powerful reports possible, it's all about structuring the data correctly behind the scenes. Without getting too technical, this involves creating a logical model that allows Power BI to understand the relationships between different data sets (like how sales data connects to customer data).
Empowering Confident Decision-Making
This isn't just about creating pretty charts; it's about fundamentally changing how you operate. When you have a reliable, automated view of your business, decision-making becomes proactive, not reactive.
Instead of guessing, you can see exactly which marketing channels deliver the most profitable customers. Instead of waiting for month-end reports, you can monitor cash flow daily. This clarity gives you the confidence to make bold, insight-led decisions about where to invest your time and capital.
To really maximize the impact of your dashboards, it's crucial to present information effectively. Brushing up on essential data visualization best practices will help ensure your reports are clear, intuitive, and drive action.
Ultimately, a well-implemented Power BI dashboard, powered by a solid data warehouse, removes the friction between data and decisions. It provides a clear, reliable view that empowers you and your team to focus on what matters most: growing the business.
Ready to Build Your Single Source of Truth?
So, there you have it—a clear path from data chaos to genuine clarity. Creating a data warehouse isn't some mythical project reserved for massive corporations. It's an achievable and powerful next step for ambitious SMBs looking to scale smarter, not harder. This is all about laying a solid foundation for growth, one that’s built on reliable insights instead of guesswork.
This move from gut-feel decisions to data-driven strategy is quickly becoming a core business necessity, not just a nice-to-have. The global data warehousing market was valued at USD 34.9 billion in 2024 and is projected to skyrocket to an estimated USD 126.8 billion by 2037. You can dig into these long-term forecasts for the data warehousing market at researchnester.com. That kind of growth tells you everything you need to know about how critical a central data hub is becoming for businesses of every size.
Your Journey to Data-Driven Decisions
Let's do a quick recap of the journey we’ve mapped out. We designed this process for business leaders, not just seasoned data engineers.
- First, you pinpoint your most urgent business questions to make sure the project delivers immediate, tangible value.
- Next, you round up your key data sources, like your CRM and accounting software—the places where the real story of your business lives.
- Then, you pick a modern, cloud-based toolset that actually fits your budget and your long-term goals.
- Finally, you bring it all to life by visualizing your success with powerful BI tools like Power BI.
It’s time to stop wrestling with endless, conflicting spreadsheets and start leading with clear, actionable insight. If you're ready to finally automate your reporting, get your teams on the same page, and trust the numbers in front of you, the next step is simple.
Your business deserves a single source of truth—one that fuels confident decisions and sustainable growth. The tools and strategies are more accessible than ever. All it takes is that first step.
Want to automate your reporting and finally trust your data? Book a free discovery call with our BI consultants today.
Common Questions About Building a Data Warehouse
If you're a business owner, the idea of building a data warehouse probably feels like a mix of exciting and overwhelming. You can see the potential for making smarter decisions, but the complexity can feel like a huge hurdle. Let's tackle some of the most common questions we hear from founders and operators who are in your exact shoes.
How Much Does It Actually Cost to Build One?
Good news: it's far more accessible than you might think. We're not in the era of buying massive, expensive servers anymore.
These days, you're looking at manageable monthly subscriptions for a few key services. Depending on how much data you have and the tools you pick, this could be anywhere from a few hundred to a few thousand dollars a month. Your main costs will be the data integration tool (your ETL), the cloud warehouse itself (like Google BigQuery), and your BI tool for visualization (like Power BI).
The smartest way to approach this is to start small and scale your investment as you see the returns. Prove the value with a single, high-impact project, then build out from there. This keeps your initial costs down and ties every dollar you spend directly to business value.
Do I Need to Hire a Full-Time Data Engineer?
Not necessarily, especially when you're just getting started. Many of the best cloud data tools today are "low-code" or even "no-code," which means your existing team can get a lot done without needing deep programming skills.
For most small and mid-sized businesses, working with a consultancy like Vizule hits the sweet spot. You get expert guidance to build a solid, scalable foundation and your first critical set of automated reports. This way, you avoid the long-term overhead and the headache of recruiting a full-time hire. We can get the system built and then hand the keys over to your team, empowering them to find their own insights.
How Long Does It Take to Get Running?
The timeline is all about scope. One of the biggest mistakes we see is companies trying to connect every single data source from day one. That’s a surefire way to drag a project on for months with very little to show for it.
A much better approach? Pick one high-impact area to focus on first. Zero in on the part of the business that's causing the most pain or holds the biggest opportunity.
- Financial Reporting: Pull data from QuickBooks and your CRM to finally get a real-time, accurate picture of profitability.
- Sales Analytics: Connect your sales and marketing platforms to figure out what your true customer acquisition cost really is.
- Operational Efficiency: Link your inventory and sales data to stop guessing and start optimizing your stock levels.
By taking this focused approach, a well-defined initial project can deliver real, tangible value in as little as 4 to 8 weeks. You get a quick win, prove the concept to the rest of the team, and build momentum for what comes next. It’s about making progress, not trying to boil the ocean.
Ready to stop wrestling with spreadsheets and start leading with insight? The team at Vizule can help you design and build the single source of truth your business needs to scale.
Book your free BI consultation and see how we can automate your reporting and unlock confident, data-driven decisions.


