


A data model for a data warehouse is the blueprint that brings order to your messy business data. Think of it as the master plan for creating a single, trusted source of truth. It’s the process of translating disconnected spreadsheets and siloed reports into a logical, structured system—turning a jumble of data into a powerful asset for making smart decisions.
For small and medium-sized business owners, this isn't just a technical exercise; it's the foundation for automating reports, aligning your teams, and finally trusting your numbers.
From Data Chaos to a Blueprint for Success
If you're running an SMB, you're likely drowning in disconnected spreadsheets. Your finance numbers are in one system, your sales data is in another, and marketing metrics live somewhere else entirely. Sound familiar?
Every manual report you build by copy-pasting from different sources is a symptom of this deeper issue. You’re spending hours trying to connect the dots, only to end up with reports that are out-of-date the moment they're finished and numbers that never quite match up. This is the "Excel chaos" that holds so many growing businesses back.

This is exactly where a data model for a data warehouse comes in. It's not an abstract technical diagram; it's a practical blueprint designed around your business processes. It takes all that raw, messy data from your various sources and organizes it logically, creating a stable foundation for every report and analysis you'll ever need in tools like Power BI.
Instead of manually wrestling with data, a solid data model automates the entire process, making sure everyone is looking at the same trusted numbers. This foundational step solves the constant headaches of inconsistent reports and wasted time, turning your data from a frustrating liability into your most valuable competitive asset.
From Data Frustration to Business Clarity
A well-designed data model directly tackles the most common frustrations founders and operators face. It forges a clear path from disconnected information to the kind of actionable insights that actually drive growth.
See how a proper data warehouse model can transform your operations:
| Your Pain Point | How a Data Model Provides the Solution |
|---|---|
| "Our sales and finance numbers never match." | It creates a single source of truth by integrating and standardizing data from all your systems. |
| "We spend days building the monthly report." | It provides a structured, automated source for BI tools, eliminating manual copy-pasting. |
| "I don't trust the data I'm seeing." | It enforces business rules and consistency, so everyone from finance to operations sees the same numbers. |
| "We can't answer deeper questions about our business." | It organizes data logically, making it easy to analyze things like customer lifetime value or campaign profitability. |
A proper model doesn't just put an end to data chaos; it gives your team the confidence to make decisions backed by solid evidence.
A great data model does more than just organize data—it organizes your business thinking. It forces you to define what metrics truly matter and how different parts of your operation connect, setting the stage for genuine, insight-led decision-making.
Before diving deep into modeling techniques, it's good to know the bigger picture. Understanding the difference between a Data Lake vs Data Warehouse can help you decide on the right architecture for your company. Of course, any model is only as good as the information it's built on.
Choosing Your Blueprint: Star vs. Snowflake Models
Think of a data architect like a building architect. You wouldn't use the same blueprint for a skyscraper as you would for a single-family home, right? The same logic applies to data models. In the world of data warehousing, two core blueprints have become the gold standard for their clarity and performance: the Star Schema and the Snowflake Schema.
Understanding these isn't about getting lost in jargon. It’s about picking the right framework to answer your most important business questions—quickly and reliably. For most SMBs, this choice directly impacts how easily you can pull real insights from your data.
These structured approaches fall under a discipline known as dimensional modeling, which is the bedrock of modern data warehouse design. If you want to go deeper on the fundamentals, check out our guide on what dimensional modeling is and why it matters.
The Star Schema: Your Go-To for Speed and Simplicity
Imagine a simple hub-and-spoke system.
At the very center—the hub—is your main business event, like a sales transaction. This is your Fact Table, and it’s packed with the numbers you care about: sales amount, quantity sold, profit. It’s the "what happened."
Radiating out from this hub are the spokes, which provide crucial context. These are your Dimension Tables, and they describe the 'who, what, where, and when' of that sale.
- Who: The customer who bought something.
- What: The product they purchased.
- Where: The store location or sales region.
- When: The exact date and time of the transaction.
This structure is called a Star Schema because a diagram of it looks like a star. It’s direct, clean, and incredibly efficient for reporting. When your finance lead needs to ask, "Show me total sales by product category for last quarter," your system can grab the answer with minimal fuss. This design is built for the kind of straightforward, high-speed reporting that most businesses need to keep a pulse on performance.
The Snowflake Schema: When You Need More Detail
Now, let's take that same star blueprint and add more layers. The Snowflake Schema is an extension of the star. It starts with the same central fact table, but it then breaks down the dimension tables into more granular, related tables.
For instance, instead of one big 'Product' dimension, you might have a 'Product' table that links out to a 'Product Category' table. That 'Product Category' table might then link to a 'Product Department' table. The dimensions branch out, creating a pattern that looks like a snowflake.
The benefit here is a highly organized structure that cuts down on data redundancy. But that pristine organization comes at a price. To answer that same simple sales query, your system now has to perform more "joins," piecing together information from several tables. This can slow down your reports.
For most SMBs, the Star Schema is almost always the better starting point. It aligns perfectly with the goal of getting clear, actionable insights quickly without getting bogged down in unnecessary complexity. The speed and simplicity it offers are invaluable when you need to make fast, data-informed decisions.
Making the Right Choice for Your Business
So, how do you decide? It boils down to a classic trade-off: reporting speed versus data organization.
| Aspect | Star Schema | Snowflake Schema |
|---|---|---|
| Performance | Faster. Fewer table joins mean quicker reports. | Slower. More joins are required to retrieve data. |
| Simplicity | Simpler. Easier for business users to understand and for BI tools like Power BI to use. | More Complex. The structure can be harder to navigate. |
| Maintenance | Easier. Fewer tables to manage and update. | More Effort. Requires managing a larger number of tables. |
| Best For | Most BI Reporting. Ideal for SMBs focused on performance dashboards and KPIs. | Complex Hierarchies. Useful for businesses with deep, multi-level data relationships. |
The power of dimensional modeling isn't just theory. Industry studies consistently show that companies using dimensional models see a 30-40% improvement in query performance compared to more complex relational models. This performance boost is exactly why the star schema remains the blueprint of choice for agile, data-driven businesses.
The Core Components of a Powerful Data Model
Every blueprint has its essential components, and a data model for a data warehouse is no different. You don't need to be a data expert, but understanding these building blocks is crucial for getting the reporting you want. Think of these components as the language of your business, translated into a structure that a tool like Power BI can understand.
Your business tells stories every day through its operations. A sales transaction, a marketing campaign click, a customer support ticket—each one is a story. A good data model gives those stories a consistent grammar so you can actually read them.
Facts and Dimensions: The Numbers and the Story
At the heart of any effective data model are two simple but powerful concepts: Facts and Dimensions. They work together to turn raw numbers into genuine business intelligence.
-
Facts are the measurable business events you want to track. Think of them as the verbs—the key actions in your business story. They are almost always numbers. Good examples include Sales Revenue (
$500), Units Sold (5), or Website Clicks (120). -
Dimensions provide the context for those facts. They answer the "who, what, where, and when" that give the numbers their meaning. If facts are the verbs, dimensions are the nouns. Examples include:
- Who: Customer Name (
Jane Doe), Sales Rep (John Smith) - What: Product Name (
Premium Widget), Service Tier (Gold Plan) - Where: Store Location (
London), Sales Region (North America) - When: Date (
2023-10-26), Quarter (Q4)
- Who: Customer Name (
Without dimensions, a fact is just a number. A report showing "$500" is useless. But a report showing "$500 in sales for the Premium Widget, sold to Jane Doe in London on October 26th" tells a complete, actionable story.
The infographic below shows how these components are typically arranged in the popular Star and Snowflake schemas.
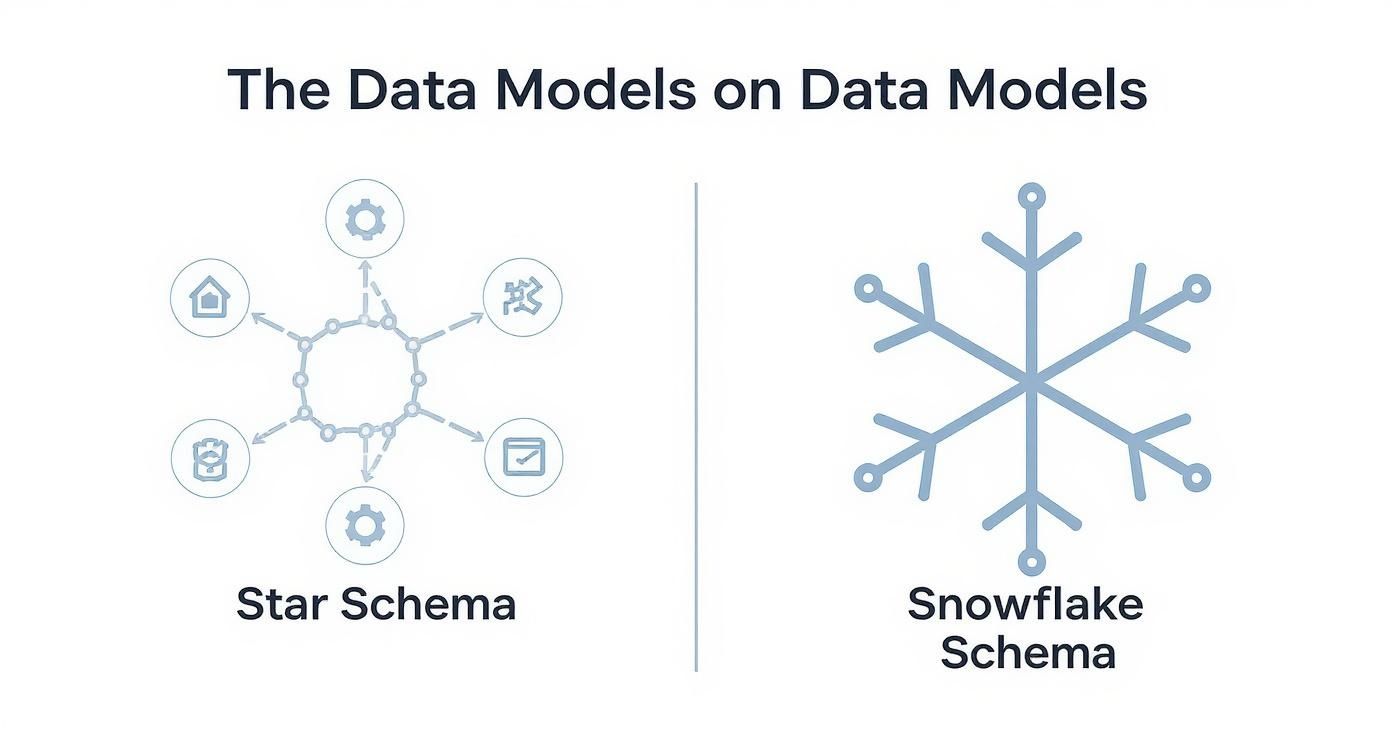
This visual highlights the Star Schema's direct, hub-and-spoke simplicity against the more branched, hierarchical structure of the Snowflake Schema.
Keys and Slowly Changing Dimensions
So, how do these pieces connect? That’s where Keys come in. A key is just a unique identifier, like a Customer ID or Product SKU, that links a fact (a sale) to its corresponding dimensions (the customer and product details). This link is what lets you filter your data in a Power BI report.
But what happens when your contextual data changes over time? This is a common scenario for any growing business.
Imagine a sales rep, Sarah, gets promoted and her sales territory changes from "East" to "West." If you just update her record, all her past sales will now be incorrectly credited to the "West" region. This could completely wreck your historical sales analysis.
This is where Slowly Changing Dimensions (SCDs) become essential. An SCD is a technique for managing these historical changes in your dimension tables. Instead of overwriting old data, you create new versions of a record. This preserves historical accuracy, ensuring that when you look at a report from last year, you’re seeing the business as it actually was. Properly handling these changes is a core part of the process, and you can learn more about how raw data is prepared for modeling in our guide on what data transformation is.
A Practical Design Process for Your Business Data
So, how do you actually go from a pile of business needs to a working data model? This isn't just a technical exercise. The whole point is to build something that answers the questions that keep you up at night, driven entirely by what the business needs to achieve.
The biggest mistake we see SMBs make is trying to model everything at once. A much better approach is to start small. Pick one high-impact area, get a win, and then build on that momentum. The goal is to get a tangible asset into your team's hands, fast.
This comes down to a practical, step-by-step process that starts not with tables and columns, but with a simple question: What decision do you need to make?
Start with Business Questions, Not Tables
Before you think about facts, dimensions, or star schemas, you have to nail down the business questions you're trying to answer. A good data model is a direct reflection of your commercial priorities. Are you trying to understand customer retention? Figure out which products are truly profitable? Or see which sales initiatives are hitting the mark?
Each of these goals demands a different view of your data.
- To analyze customer retention, you might ask: "What's the average lifetime value of customers we acquired from our Q3 marketing campaign?"
- To understand product profitability, the question could be: "Which product categories have the highest profit margins after factoring in returns?"
- To optimize sales, you might need to know: "Which sales reps are crushing their quota for high-margin products in the EMEA region?"
Think of your business questions as the requirements document for your data model. They tell you exactly what metrics (facts) and context (dimensions) you need. Without this clarity, you risk building a technically perfect model that is commercially useless.
Once you have those core questions, you can start translating them into a technical blueprint.
A 4-Step Checklist for Your First Data Model
Building your first data model doesn’t have to feel like a monumental task. Following a structured path ensures you're capturing the right information.
Here’s a simple checklist to guide you:
-
Identify the Business Process: First, pick one core process to model. Don't try to boil the ocean. Choose something high-value like sales orders, inventory movements, or customer support tickets.
-
Declare the Grain: Next, decide on the "grain." This is just a practical way of saying: "What does one row in my central table represent?" For a sales model, the grain might be one row per line item on an invoice. A clear grain is non-negotiable; it prevents confusion and ensures your numbers always add up correctly.
-
Identify the Dimensions: Now, think about the "who, what, where, when" that gives context to that grain. If the grain is a sales invoice line, your dimensions are: Customer, Product, Date, Sales Rep, and maybe Store Location. These will become your dimension tables.
-
Identify the Facts: Finally, what are the numbers you want to measure? For that sales invoice line, the obvious facts are Quantity Sold, Unit Price, Total Sale Amount, and Discount Amount. These are the numeric metrics that will become the columns in your central fact table.
Following these four steps gives you a logical path from a high-level business question to a well-structured data model for a data warehouse. This clean, organized data then becomes the reliable foundation for everything that comes next. To see how this structured data is moved and transformed, you can learn more by exploring our guide on how to build a data pipeline. Getting this right is what makes your data truly ready for analysis in tools like Power BI.
Connecting Your Model to Power BI for Real Insights
A perfectly designed data model is only half the battle. Its true value is unlocked when it starts powering the reports and dashboards your team uses every day to make critical decisions. This is where a powerful tool like Microsoft Power BI enters the picture, bridging the gap between your structured data warehouse and actionable insights.
The beauty of a well-built data model for a data warehouse, especially a simple star schema, is how seamlessly it translates into the Power BI environment. There’s no complex mapping required. The logical structure you’ve created becomes an intuitive playground for analysis.

This direct translation from your model to the report is what makes modern business intelligence so effective. It’s the final, crucial step in turning a solid data foundation into automated, trustworthy insights that drive your business forward.
From Model Components to Dashboard Interactivity
The components of your data model directly correspond to the interactive elements in your Power BI reports. This one-to-one relationship is what makes a well-designed model so powerful for your team.
Here’s how the pieces connect:
- Fact tables become your KPIs. The numbers in your fact table—things like
SalesAmountorUnitsSold—are the core metrics you'll display on your dashboards as Key Performance Indicators (KPIs). These are the headline numbers that tell you how the business is doing. - Dimension tables become your filters and slicers. All that descriptive context from your dimension tables (
Customer,Product,Date) becomes the interactive filters in Power BI. This lets you slice and dice your data effortlessly, drilling down from total company revenue to sales for a specific product in a single region with just a few clicks.
A clean, logical model is the secret to avoiding common Power BI frustrations like slow-loading reports and incorrect calculations. It ensures that when a user filters by "Q3," the numbers are fast, accurate, and reliable every time. To truly unlock the power of your data model and transform it into actionable insights with tools like Power BI, consider exploring comprehensive business intelligence services.
The Evolving Landscape of Data Modeling
While dimensional models like the star schema remain the workhorse for most BI applications, the field is constantly evolving. The rise of diverse data sources, from social media feeds to sensor data, is pushing businesses toward more flexible approaches.
The evolution of data warehouse modeling has seen a significant shift toward hybrid and multi-model approaches. Between 2015 and 2025, the use of hybrid data models—combining relational, dimensional, and NoSQL structures—is projected to grow by over 50% in large enterprises.
This trend is driven by the need to integrate structured financial records with unstructured data like customer feedback or weblogs. The adoption of these blended models has already led to a 25% increase in data processing efficiency and a 20% reduction in time-to-insight for business users, showcasing the tangible benefits of adapting your data architecture.
Even with these new methods, the core principle remains the same: a well-structured data model for a data warehouse is the engine that drives meaningful reporting. Whether it’s a classic star schema or a more complex hybrid, the goal is to provide a clean, reliable source for your analytics tools.
Ready to Build Your Single Source of Truth?
We’ve covered a lot of ground, moving from the chaos of disconnected data to the clarity of a well-designed data warehouse model. By now, you know that a data model isn't just a technical diagram—it's the strategic blueprint for automating reports, getting your teams on the same page, and finally unlocking the insights you need to grow your business smartly.
This is the critical difference between reacting to old, questionable data and making proactive decisions with a live, complete picture of your company. It’s how you turn your data from a frustrating liability into your most valuable asset.
From Blueprint to Business Value
While the core concepts—facts, dimensions, and schemas—are straightforward, putting them into practice successfully takes real-world experience. The true challenge is translating your unique business processes into a logical structure that’s both efficient today and ready to scale tomorrow.
Don't let technical hurdles keep your business stuck in spreadsheet hell, wasting precious hours on manual reporting that nobody fully trusts.
Building a robust data model for a data warehouse is the first, most crucial step toward establishing a genuine single source of truth—the bedrock of confident, data-driven leadership. You can read more on the importance of this concept in our guide to creating a single source of truth for your business data.
If you’re ready to stop questioning your numbers and start using them to drive growth, it’s time to take the next step. Transforming your scattered information into a reliable, automated engine for insight is more accessible than you might think. It all starts with a clear plan and the right partner to help you build it.
Tired of wrestling with messy data? Let's design the clear, automated reporting stack your business deserves.
Book Your Free BI Consultation
Frequently Asked Questions
Even with a clear plan, diving into data warehouse modeling can stir up a few practical questions. We get it. Here are some straight answers to the most common queries we hear from business owners and founders ready to ditch the spreadsheet chaos.
How Long Does It Take to Build a Data Model?
For a small or medium-sized business, building a solid data model for a single area—like sales or finance—is usually a matter of weeks, not months. The timeline depends on how complex your business rules are and how clean your source data is to begin with.
The trick is to avoid boiling the ocean. We always advise starting with one high-impact area, like sales performance, to get a tangible win on the board fast. This proves the value and lets you build on that success as you go.
Do I Need a Data Warehouse Before Using Power BI?
You can connect Power BI directly to sources like Excel or your accounting software, but you'll hit a wall pretty quickly. As your data grows, performance will nosedive. Think of it like building a house on a shaky foundation—it might stand for a bit, but it’s not built to last.
A data warehouse with a proper data model is that solid foundation. It's an optimized, central source of truth that structures your data before it gets to Power BI. The result? Your reports are dramatically faster, more reliable, and easier to manage. It's the professional setup for any business that's serious about its data.
Is My Business Too Small for a Data Warehouse?
Absolutely not. In fact, setting up a solid data foundation early is a massive competitive advantage. It stops you from accumulating "data debt"—that tangled mess of conflicting reports and manual processes that slows so many scaling companies down.
Modern cloud platforms have made data warehousing affordable and accessible for businesses of any size. Starting now means you build good data habits from day one and have the right infrastructure in place to support growth, rather than scrambling to fix a broken system down the line.
It comes down to being proactive. You're setting your business up with the tools to scale intelligently from the get-go. The investment pays for itself in time saved, confidence in your numbers, and ultimately, better decisions.
Ready to stop wrestling with spreadsheets and build a reporting engine you can finally trust? The team at Vizule specialises in designing practical, high-impact data models for SMBs.


