


Think of data modeling in a data warehouse as the architectural blueprint for your company's information. Before you build a house, you need a detailed plan to ensure the plumbing, electrical systems, and rooms all connect logically. It's the same idea here; a data model ensures all your scattered data—from sales in HubSpot, financials in Xero, and marketing in Google Ads—fits together into a single, reliable structure.
This isn’t just a technical exercise. For a founder, this is the critical first step to turning chaotic spreadsheets into automated, insightful Power BI reports you can actually trust to run your business.
Why Your Messy Spreadsheets Are Costing You Growth
If you're running a small or medium-sized business, you know the frustration. You spend hours pulling data from your CRM, accounting software, and various marketing platforms. Then comes the painful, error-prone process of trying to stitch it all together in Excel or Google Sheets.
It’s slow. It’s prone to human error. And by the time you've finished, the report is probably already out of date.

This isn't just an inconvenience; it's a major business risk. When you can’t trust your numbers, you can't make confident decisions. You're left guessing which marketing channels are really profitable, what your actual customer lifetime value is, or if your cash flow projections for next quarter are even close to reality. The problem isn't the data itself—it's the complete lack of a coherent structure to connect it all.
From Data Chaos to Reporting Clarity
This is exactly where data modeling in a data warehouse changes the game. It’s the foundational step you take to escape spreadsheet hell and build a dependable reporting engine for your business. Instead of siloed, disconnected data, you create a central, organized hub—a single source of truth—that fuels all your analytics and Power BI dashboards.
The table below breaks down this transformation from common founder frustrations to tangible business outcomes.
| Your Current Pain Point | How Data Modeling Solves It | The Business Outcome |
|---|---|---|
| Hours spent manually combining spreadsheets every week. | Centralizes data from all sources into one structured warehouse. | Automated Reporting: Reports are always on, always up-to-date, with zero manual effort. |
| Inconsistent numbers between departments (e.g., sales vs. finance). | Creates a "single source of truth" with standardized definitions. | Trust in Your Numbers: Everyone works from the same data, ending debates over whose numbers are "right." |
| Can't see the full picture (e.g., how marketing spend affects sales). | Links disparate datasets together in a logical, business-focused way. | True Visibility: Connect operational activities to financial results for a complete view of performance. |
| Reporting breaks as you add new tools or grow the team. | Builds a scalable data foundation designed for future growth. | Scale with Confidence: Your data infrastructure supports your growth instead of holding it back. |
For ambitious SMBs, getting this foundation right is non-negotiable.
A well-designed data model doesn't just store data; it organizes it for answers. It transforms raw information into a powerful asset that directly informs your most critical business questions, from forecasting revenue to optimizing operations.
Ultimately, investing in a proper data structure is about reclaiming your time and empowering your team to make smarter moves. It shifts the focus from mind-numbing data wrangling to strategic, insight-led decision-making.
If you're ready to move beyond the limitations of spreadsheets, our guide on data analytics for small business is a great place to start exploring what's possible. It's the first step toward building the automated dashboards and financial models your business needs to truly thrive.
What Is Data Modeling for a Data Warehouse?
Let's use an analogy that will instantly click for any business operator. Picture all of your data—sales figures from Stripe, customer lists from HubSpot, financial reports from Xero—as a massive, chaotic library where all the books are just dumped on the floor. Trying to find one specific piece of information would be a nightmare.
A data model is your library's shelving system. It’s the logical structure that organizes everything into clear, intuitive sections. Instead of digging through piles, you have a system designed to help you find exactly what you need, right when you need it.
That organization is the whole point of data modeling. It’s a strategic blueprint for turning raw, messy data into a reliable asset. This isn’t a technical chore for the IT department; it’s how you build the Power BI dashboards and financial reports your business actually trusts.
Facts and Dimensions: The Building Blocks of Clarity
At its core, data modeling organizes information into two simple but powerful categories that are easy for anyone to understand:
- Facts: These are your numbers, the measurable business events you track. Think of them as the "verbs" of your business—things like sales revenue, ad spend, or website visitors.
- Dimensions: This is the context that gives those numbers meaning. They answer the who, what, where, and when. These are the "nouns" of your business—things like customer name, product category, sales region, or order date.
A fact like "$5,000 in sales" is meaningless on its own. But once you add dimensions, a story emerges: "We generated $5,000 in sales (fact) from the 'New Customer' segment (dimension) in London (dimension) on last Tuesday (dimension)." Suddenly, you have an actionable insight.
This fundamental split between facts and dimensions is the gold standard for business intelligence. It's a proven method that allows non-technical leaders to ask complex questions of their data without needing to be data wizards.
Why This Structure Matters for Your Business
Organizing your data this way is everything because it directly maps to the business questions you need to answer. It creates a stable foundation for all your reporting, letting you slice and dice information from any angle. For a deeper look into this structure, check out our guide on what is dimensional modeling.
Data modeling is the bridge between having data and having answers. It imposes a business-centric logic on your technical assets, ensuring that every report is built on a foundation of clarity and trust.
Of course, before you can model your data, you have to get it in one place first. For a comprehensive look at how data is gathered for your warehouse, explore a complete guide to extracting data from various online sources. Getting this first step right is critical to avoiding the classic "garbage in, garbage out" problem that trips up so many analytics projects.
Choosing the Right Blueprint for Your Business Data
Think of building a house. Before you lay a single brick, you need an architectural blueprint. The same goes for your data. A data model is simply the blueprint that dictates how your business information is organized, stored, and connected in your data warehouse.
Picking the right blueprint isn't about becoming a data architect overnight. It’s about understanding the basic trade-offs so you can have an informed conversation about what you actually need from your reports.
For most small and medium-sized businesses, this conversation starts and ends with a beautifully simple and powerful approach: the Star Schema.
The Star Schema: Your Go-To Model for Speed and Clarity
Let's use an analogy. Imagine a simple filing cabinet for all your sales information.
You have one big, central folder labeled "Sales Transactions." Inside, there's just a list of numbers—sales amounts, profit margins, quantities sold. These are your facts. Then, clipped directly to the outside of that folder, you have separate tabs for "Customers," "Products," and "Dates." These are your dimensions.
That’s a Star Schema in a nutshell. It’s built around a central fact table (the sales numbers) that connects directly to several dimension tables (the context, like who bought what, and when). The structure looks like a star, with the facts at the core and the dimensions radiating out.
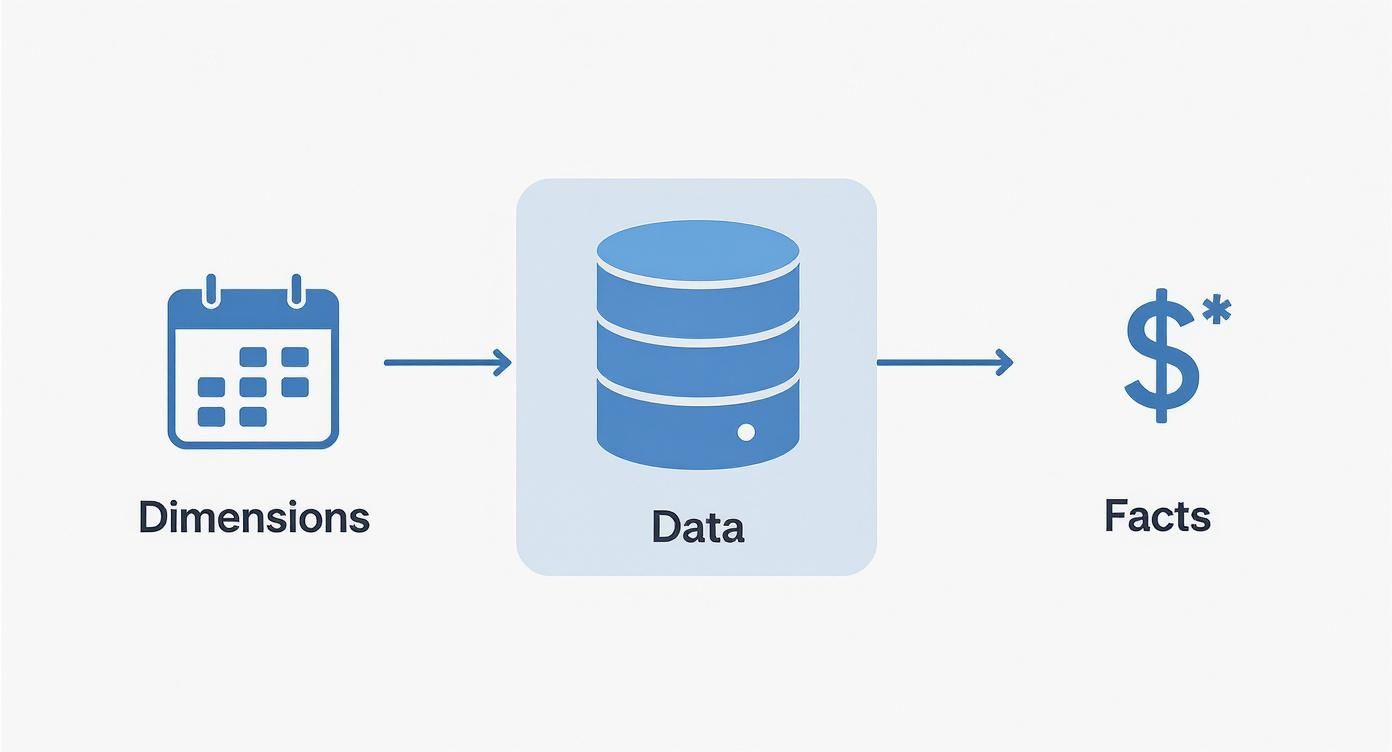
This diagram shows how contextual 'dimensions' like time and product give real meaning to the central 'facts' like your sales figures.
For a business owner, the benefits are immediate and tangible:
- It’s Fast: Your reports and Power BI dashboards will run incredibly quickly. Because the design is so simple, queries don't have to jump through a dozen hoops to find an answer.
- It’s Intuitive: This model mirrors how you already think about your business. You want to see "sales by region" or "profit per product line." The Star Schema is literally built to answer these kinds of questions directly.
- It’s Perfect for Most SMBs: When it comes to tracking your core KPIs across finance, operations, and marketing, the simplicity and performance of a Star Schema are just unmatched.
The Star Schema deliberately prioritizes speed and ease of use over perfect, textbook data normalization. It’s a pragmatic choice designed for one thing: getting clear answers from your data, fast.
Other Models You Might Hear About
While the Star Schema is the undisputed workhorse for most analytics, it’s good to be aware of other options you might come across.
The Snowflake Schema is a more complex cousin of the star. Going back to our filing cabinet, instead of a single "Products" tab, you might have a "Products" tab that then contains sub-folders for "Category" and "Supplier." It’s technically more organized and reduces some data repetition, but this extra layering often slows your reports down. Each query has to open more folders to piece together the full picture.
For massive enterprises with incredibly complex, ever-changing data from dozens of systems, you might hear about a Data Vault model. It's built for ultimate flexibility and auditability, but for the reporting needs of a typical SMB, it's complete overkill. It's like building a commercial archive facility when a simple filing cabinet will do the job perfectly.
Which Data Model Fits Your SMB
Choosing a model boils down to finding the right balance between performance, flexibility, and the effort required to maintain it. The "best" model on paper can easily introduce delays and complexity that just get in the way of making good decisions. The table below breaks down the practical choice for a founder.
| Modeling Approach | Best For… | Key Benefit for Founders | Potential Trade-off |
|---|---|---|---|
| Star Schema | Most SMB analytics—finance, sales, marketing dashboards. | Speed & Simplicity. Answers business questions directly. | Some data redundancy (which is fine for analytics). |
| Snowflake Schema | Situations with very complex, multi-layered dimensions. | Tidiness. Reduces data duplication. | Slower report performance due to more complex queries. |
| Data Vault | Large enterprises needing audit trails and massive scale. | Flexibility. Adapts to changing business rules. | Overkill. Far too complex for typical SMB reporting. |
| Normalized (3NF) | Transactional systems (like an ordering app), not reports. | Data Integrity. Eliminates all data redundancy. | Extremely slow for analytics and business reporting. |
At the end of the day, the goal is clarity, not complexity.
The key takeaway is that for 90% of SMBs, a Star Schema is the ideal foundation for a fast, reliable, and scalable reporting engine. It directly connects your core business numbers to the context that gives them meaning, letting you move from raw data to real insight without getting bogged down in unnecessary technical details. This is the core principle of a well-designed data warehouse, which is a very different beast from other storage systems. To learn more, check out our breakdown of a data warehouse vs data lake.
How Modern Tools Finally Made Data Warehousing Accessible
Not long ago, building a proper data warehouse felt a bit like launching a satellite. It was an incredibly expensive, complex project reserved for massive corporations with sprawling IT departments and even bigger budgets. For a small or medium-sized business, it was completely out of reach.
Thankfully, that's all changed. Modern cloud platforms and powerful BI tools have completely democratized data analytics. This shift means you no longer need a server room or a team of database administrators to build a single source of truth. The power to turn your messy, scattered data into a strategic asset is now both accessible and affordable.
Scalability That Grows With You
One of the biggest breakthroughs for SMBs is the idea of cloud scalability. The old way involved buying and maintaining expensive physical servers, forcing you to guess your future needs. If you guessed too low, your systems would crash during busy periods. Guess too high, and you'd be paying for expensive capacity you never even used.
Modern tools like Snowflake, Google BigQuery, and Microsoft Azure tossed that model out the window.
- Elastic Resources: These platforms automatically give you more computing power when you need it (like during month-end reporting) and scale right back down when you don’t.
- No Upfront Investment: You don’t need to buy any hardware. You can start small and grow your data infrastructure right alongside your revenue, without a massive capital hit.
This means you can build a robust foundation that supports your business today and is ready to handle your growth tomorrow—all without breaking the bank.
From a Cost Center to a Strategic Asset
The pricing model has been completely transformed, too. Instead of hefty software licenses and painful maintenance contracts, modern data warehouses use a pay-as-you-go model. You only pay for the data you store and the queries you run. For most SMBs, this makes the cost of entry incredibly low.
This shift in accessibility is critical. It allows founders and operators to stop seeing data as a backend cost and start treating it as their most valuable asset for driving growth, optimizing operations, and making confident, insight-led decisions.
This new reality is why building a modern data stack is no longer a luxury but a competitive necessity for businesses of all sizes. It’s the engine that powers everything from financial forecasting in Power BI to finally understanding your true customer acquisition cost.
AI Is Your New Automated Data Analyst
The next wave of accessibility is being driven by artificial intelligence. AI and machine learning are no longer just buzzwords; they're being baked directly into data warehousing tools to automate complex tasks that once required a specialist.
The integration of AI is becoming central to modern data warehouse modeling, especially as businesses handle more data than ever. In fact, market projections suggest that before 2026, roughly 80% of data and analytics developments will rely on AI or machine learning, transforming how data models are designed and used.
This automation shows up in practical ways that actually help your business:
- Automated Optimization: Behind the scenes, AI can fine-tune your data model and queries for better performance without you needing to lift a finger.
- Predictive Forecasting: Tools like Power BI now have built-in AI features that allow you to generate sales or cash flow forecasts with just a few clicks, based on the historical data in your warehouse.
- Natural Language Queries: You can now ask questions in plain English (e.g., "What were our top 5 products in London last quarter?") and get back an instant chart or report.
These advancements put immense analytical power directly into the hands of business leaders. You can now get answers in minutes, not weeks, turning your well-structured data into immediate, actionable insights.
A Practical Implementation Checklist for Founders
Theory is one thing, but actually putting it into practice is a whole different ballgame. As a founder, you don't need to become a data engineer overnight. What you do need is a clear, practical roadmap to guide the process.
Think of this as your project plan for turning scattered data into your most powerful strategic asset. It's designed to keep the focus squarely on business outcomes, not just the technical nitty-gritty.
1. Define Your Business Questions First
Before you even think about touching a piece of data, start with the answers you need most. What are the top 3-5 questions that, if you had reliable answers to every single morning, would fundamentally change how you run your business?
- What's our true customer lifetime value, broken down by acquisition channel?
- Which of our product lines have the highest profit margin after all associated costs?
- How does our marketing spend actually correlate with sales pipeline growth?
These questions become the North Star for your entire data modeling effort. Starting here ensures you're building a system to solve real-world business problems, not just creating a technical curiosity piece.
2. Identify Your Key Data Sources
Okay, now it's time to figure out where the answers to those questions are hiding. Just make a simple list of the platforms that hold the puzzle pieces. For most businesses, this usually includes:
- CRM: This is where all your customer and sales pipeline data lives (think HubSpot or Salesforce).
- Accounting Software: The source of your financial truth (e.g., Xero, QuickBooks).
- Marketing Platforms: All your ad spend and engagement metrics are here (e.g., Google Ads, LinkedIn Ads).
- Operational Tools: Any other key systems you rely on, like an inventory manager or a project management tool.
3. Map Your Core Business Processes
How does your business actually work? Sketch out a simple flow of a core process, like your customer journey. It might look something like this: A prospect clicks a LinkedIn ad, fills out a form on our site, becomes a lead in HubSpot, gets a call from sales, and eventually makes a purchase that's recorded in Stripe.
This simple narrative is incredibly powerful. It helps you connect the dots between your different data sources and reveals exactly how they should be linked together in your data model.
A data model shouldn't just be a technical diagram; it should tell the story of how your business operates. Mapping your processes ensures the model actually reflects your reality.
4. Choose Your Metrics and Context
This step brings us right back to the core concepts of facts (your numbers) and dimensions (the context surrounding them). Based on the business questions you defined earlier, list the specific metrics you need to track.
- Facts: Sales Amount, Ad Spend, Gross Profit, Number of Units Sold.
- Dimensions: Customer Name, Product Category, Sales Region, Date, Marketing Channel.
This is the most critical step in data modeling in a data warehouse. It's where you directly translate your business goals into a structural blueprint for your data.
5. Design a Simple Starting Model
My advice? Don't try to boil the ocean. Start with one crucial business area, like sales performance. A simple Star Schema is almost always the right choice to get going. You'll have a central "Sales" fact table surrounded by dimensions like "Customer," "Product," and "Date."
This approach will deliver tangible value quickly and give you a solid foundation to build on later.
6. Select the Right Tools
With your blueprint in hand, you can now choose the right tools for the job. This usually involves a cloud data warehouse (like Snowflake or BigQuery) to store and organize the data, paired with a powerful BI tool like Power BI to build your dashboards and reports. The modern toolset has made this far more accessible and affordable than it was just a few years ago.
7. Test and Refine with Real Reports
Finally, it's time for the moment of truth. Build a real report in Power BI using your new model and try to answer one of the critical business questions you started with. Does the data make sense? Is the report fast?
This real-world test is the ultimate validation. It will quickly highlight any gaps or issues, allowing you to refine the model before you invest time in building out your entire reporting suite. Following these steps gives you a clear, manageable path to success, ensuring your data warehouse project delivers the automated reporting and trusted insights your business truly needs.
Connecting Your Data Model to Real Business Insight
A well-designed data model isn't just a technical blueprint; it's the engine that powers the automated, insightful reports your business needs to thrive. This is where theory meets reality, turning scattered data points into a clear story about your performance.
Let's ground this in a real-world scenario every founder obsesses over: understanding customer lifetime value (CLV). Without a solid data model, calculating this is a manual nightmare. You're stuck exporting spreadsheets from your CRM, payment processor, and ad platforms, then trying to mash them all together. It’s slow, full of errors, and impossible to do daily.

From Manual Reporting to Automated Insight
This is where your data model truly shines. It acts as the central hub, automatically connecting all the essential pieces of the puzzle:
- Customer Data: It pulls in customer information straight from your CRM (like HubSpot or Salesforce).
- Transaction Data: It links every single payment from your processor (like Stripe) to the correct customer.
- Marketing Data: It connects acquisition details from your ad platforms (like Google or LinkedIn Ads) to reveal which channels bring in the most valuable customers.
Once those connections are made, a Power BI dashboard can automatically calculate and display CLV, updated every single day. Suddenly, you’re not just staring at a static number. You're exploring dynamic insights. You can instantly see which marketing campaigns deliver the highest ROI or pinpoint your most profitable customer segments. This is the very essence of effective data modeling in a data warehouse—it makes complex analysis simple and accessible.
A data model transforms your analytics from a historical record-keeping exercise into a forward-looking strategic tool. It allows you to ask "what if" questions and get immediate, reliable answers that drive growth.
Unlocking Advanced Analytics
The value of this structured approach snowballs as your business grows. The global data warehouse market is projected to hit nearly USD 69.64 billion by 2029, and that growth is fueled by the need for sophisticated models that can handle massive data volumes and power advanced analytics. A solid model is the foundation for everything from financial forecasting to spotting market trends.
For instance, a well-designed data model is fundamental for advanced analytics applications like predicting customer churn, helping you proactively retain valuable customers before they walk away. By translating this structured data into compelling reports, you can make smarter decisions, faster. Our guide on data visualization and dashboards shows exactly how to turn these insights into powerful visual stories.
Ultimately, this is the real ROI of data modeling. It’s not about neatly organizing data for the sake of it; it's about building an automated reporting engine that unlocks the insight-led decisions you need to scale your business with confidence.
Common Questions We Hear from Founders
If you're a business owner or operator, you're probably wondering what this all means in practical terms. Let's cut through the jargon and tackle the questions we hear most often from founders trying to move from spreadsheet chaos to automated clarity.
How long does this actually take?
This is always the first question, and the answer is usually a pleasant surprise: it's faster than you think.
For a specific business area, like sales performance or marketing analytics, we can often design and roll out a foundational data model in about 30 days. The trick is to start small. We pinpoint a clear business problem, prove the value quickly, and then build from there. The goal isn't to boil the ocean and model your entire business at once; it's about getting a quick win that immediately cuts down on manual reporting and delivers insights you can trust.
Do I need to hire a full-time data engineer?
Not anymore. A few years ago, the answer would have been a definite yes, but modern tools like Power BI and cloud data warehouses have made data modeling far more accessible.
For most small and mid-sized businesses, partnering with a specialized consultancy is the smartest move. You get deep expertise right out of the gate without the long-term overhead of a full-time hire. It’s the best way to make sure your data foundation is built correctly from day one.
What’s the difference between a data model and a data warehouse?
Great question. It's easy to get these two mixed up. Here’s a simple analogy:
- Think of your data warehouse as the physical building—it's the secure, central place where all your business data lives.
- The data model is the architectural blueprint inside that building. It lays out how the rooms (your data tables) are organized and connected, making it easy to find and use information when you need it.
You can’t have a useful data warehouse without a good data model. The model is what transforms a simple storage locker into a powerful engine for business intelligence.
Ready to stop wrestling with spreadsheets and start making decisions with confidence? The team at Vizule specializes in building the data foundations that power automated reporting and financial clarity for growing businesses.
Book your free BI consultation and let's map out a clear path to trusting your data.


