


Are you constantly battling a sea of conflicting spreadsheets and outdated reports? An enterprise data architecture isn't just a buzzword for massive corporations; it's the strategic blueprint that lets growing businesses automate reporting, get finance and operations on the same page, and finally make decisions with confidence.
Think of it as the foundational plan for moving from reactive fire-fighting to proactive, data-driven strategy. It’s how you answer the critical question: "Why are my reports always out of date and can I trust my numbers?"
From Excel Chaos to Strategic Clarity

For most founders and operators, the daily grind of managing data is pure chaos. You probably spend hours manually pulling numbers from different systems—your CRM, your accounting software, your operational platforms—only to dump them into a master Excel file that’s obsolete the moment you save it. This constant scramble just to get a clear picture of performance is a huge source of frustration and, frankly, a major business risk.
Ever tried to align your finance and operations teams when each is working from a different version of the "truth"? One spreadsheet screams that sales are up, while another shows margins are tanking. This lack of trust in your own numbers makes confident decision-making feel like a shot in the dark and puts a hard ceiling on scalable growth.
The True Cost of Disconnected Data
The problem runs deeper than just wasted time; it’s about the opportunities you’re missing. When your data is siloed, messy, and inconsistent, you simply can't see the full story. This leads to some critical pain points for any growing business:
- Reactive Decision-Making: Without a clear, up-to-date view of what's happening, you're always putting out fires instead of preventing them.
- Misaligned Teams: When finance and ops have conflicting data, strategic conversations devolve into arguments over whose numbers are right.
- Inaccurate Forecasting: Manual, error-prone reporting makes building reliable financial models and planning for the future nearly impossible.
- Limited Scalability: The manual processes that barely worked for a small team quickly become a crippling bottleneck, stopping your business from growing efficiently.
The core issue here is the lack of a deliberate plan for how your data is collected, stored, and accessed. Without a proper enterprise data architecture, you're essentially building your business on a shaky foundation of disconnected spreadsheets.
Building a Foundation for Growth
Making the leap from Excel chaos to strategic clarity demands a structured approach, and an enterprise data architecture is the blueprint for that structure. It defines exactly how data flows through your business, ensuring everyone is working from a single, reliable source of truth. To really turn scattered data into actionable insights, you need to think about realtime data integration for your business.
This guide is designed to demystify this concept for non-technical founders. We'll walk you through how building a solid data foundation—often with powerful tools like Power BI—can help you automate reporting and unlock the insights you need for smart, sustainable growth. For a closer look at this, check out our article on data analytics for small business.
What Exactly Is Enterprise Data Architecture?
Let's cut through the jargon. At its heart, an enterprise data architecture is the master blueprint for how your entire business handles information—from the moment it's created to how it's stored, moved, and ultimately used. It’s not a single piece of software you can buy off the shelf. Think of it as the strategic design governing your whole data ecosystem.
Imagine you're building a custom house. Your data architecture is that detailed plan showing how everything connects. The plumbing represents your data sources (like your CRM or accounting software), the electrical wiring is the data pipelines moving information around, and the finished rooms are where you live and work (your Power BI dashboards). Without that blueprint, you just have a chaotic mess of disconnected systems that don't work together.
From Raw Data to a Strategic Asset
The whole point of a well-designed data architecture is to transform all that raw, scattered operational data into a single, reliable strategic asset. It’s about creating one version of the truth that everyone in the company can actually trust for making decisions.
This is a world away from what happens in many growing businesses, where data is trapped in isolated silos. When the sales figures in your CRM tell a completely different story than the financial data in your accounting software, it just creates confusion and kills any trust in the numbers.
A strong data architecture demolishes these silos. It creates a logical, efficient flow of information from its source to the people who need it, ensuring critical data is accessible and consistent for every department.
The Core Purpose Explained
A thoughtfully planned architecture is designed to solve several critical challenges that hold companies back. It really boils down to achieving three main goals:
- Eliminate Data Silos: It pulls together separate systems—like your e-commerce platform, marketing tools, and financial software—into one unified view. This means your operations and finance teams are finally looking at the same numbers.
- Ensure Data Quality and Governance: The architecture sets up the rules and processes for cleaning, standardizing, and validating all your data. You can finally trust your reports without having to second-guess where the figures came from.
- Democratize Access to Insights: It makes reliable data easily available to your team through user-friendly tools like Power BI. Instead of waiting weeks for someone to manually pull a report, your team can access live dashboards to track their own KPIs and find answers.
Ultimately, this structure turns your data from a constant source of frustration into a powerful engine for growth. The central piece that makes this all possible is a well-structured repository for your clean, integrated data. To get a better handle on this key element, check out our guide on the differences between a data model and a data warehouse. This foundation is what empowers your team with meaningful, automated reports.
The Building Blocks of a Modern Data Architecture
A solid data architecture isn't one single piece of technology. It’s more like a connected system of components, each with a specific job, all working together to turn raw, messy data into a reliable source of business insight.
Think of it like an automated manufacturing plant designed to produce one thing perfectly: insights.
Just as a factory has distinct stages—raw material intake, processing, assembly, and a showroom—so does your data architecture. Each stage is essential. Understanding these building blocks demystifies the whole process and shows why automation isn't just a nice-to-have; it's essential for growth.
Data Sources: The Raw Materials
Every business has a goldmine of data sources. These are the raw materials for your insight factory—the starting points for all the information you need to run your business and see what's working.
For most businesses, these sources are a jumble of different apps and platforms that don't talk to each other. That digital disconnect is exactly where the headaches of manual reporting come from.
Common data sources include:
- Customer Relationship Management (CRM) systems like Salesforce or HubSpot, holding your sales pipeline, customer interactions, and lead data.
- Financial and Accounting Software such as Xero or QuickBooks, containing your revenue, expenses, and cash flow reporting.
- E-commerce Platforms like Shopify, which track every sale, product performance, and customer buying habit.
- Operational Tools, which could be anything from project management software to the inventory systems that run your day-to-day operations.
This raw data is valuable, but it's disconnected. To be useful, it needs to be gathered and moved to one central place for processing. That brings us to the next piece of the puzzle.
Data Integration Pipelines: The Conveyor Belts
Once you’ve identified your raw materials, you need a way to transport them automatically. This is where data integration pipelines come in. Think of them as the automated conveyor belts of your factory, reliably moving data from its source to a central hub without anyone lifting a finger.
These pipelines are the backbone of reporting automation, completely replacing the tedious copy-paste work that eats up so much time. To get a better feel for how these automated workflows are built, check out our detailed guide on how to build a data pipeline. The goal is a seamless, continuous flow of information that feeds your analytics engine.
Data Warehousing: The Central Factory
The central facility where all your raw data ends up is the data warehouse. But it's so much more than a storage unit; it's an organized, structured environment where your data gets cleaned, standardized, and prepped for analysis.
Inside the data warehouse, raw data from all your different sources is transformed into one consistent format. For example, customer names from your CRM and your e-commerce platform are matched up, and sales data is aligned with financial records. This creates a clean, reliable, and unified dataset—your single source of truth.
Key Components of Your Data Architecture Blueprint
To put it all together, here’s a quick breakdown of how these essential parts function and why they're so critical for a growing business. Each component plays a unique role, building on the last to create a powerful, automated system.
| Component | Analogy | Primary Function | Why It Matters for Your SMB |
|---|---|---|---|
| Data Sources | Raw Materials | The origin points of all your business data (CRM, finance software, etc.). | Provides the foundational information needed for any analysis. Without it, you have nothing to work with. |
| Data Integration | Conveyor Belts | Automatically moves data from sources to a central location. | Eliminates manual data entry, saves countless hours, and ensures data is consistently and reliably collected. |
| Data Warehouse | The Factory | A central repository that stores, cleans, and structures data for analysis. | Creates a "single source of truth," ensuring everyone in the company is working from the same reliable data. |
| Business Intelligence | The Showroom | Tools that visualize data from the warehouse into dashboards and reports. | Turns clean data into actionable insights your team can easily understand and use to make smart decisions. |
This blueprint shows how each layer supports the next, leading to the clear, automated dashboards that every business leader wants.
The infographic below illustrates how these foundational elements support the entire data architecture, all the way up to the business-facing dashboards.
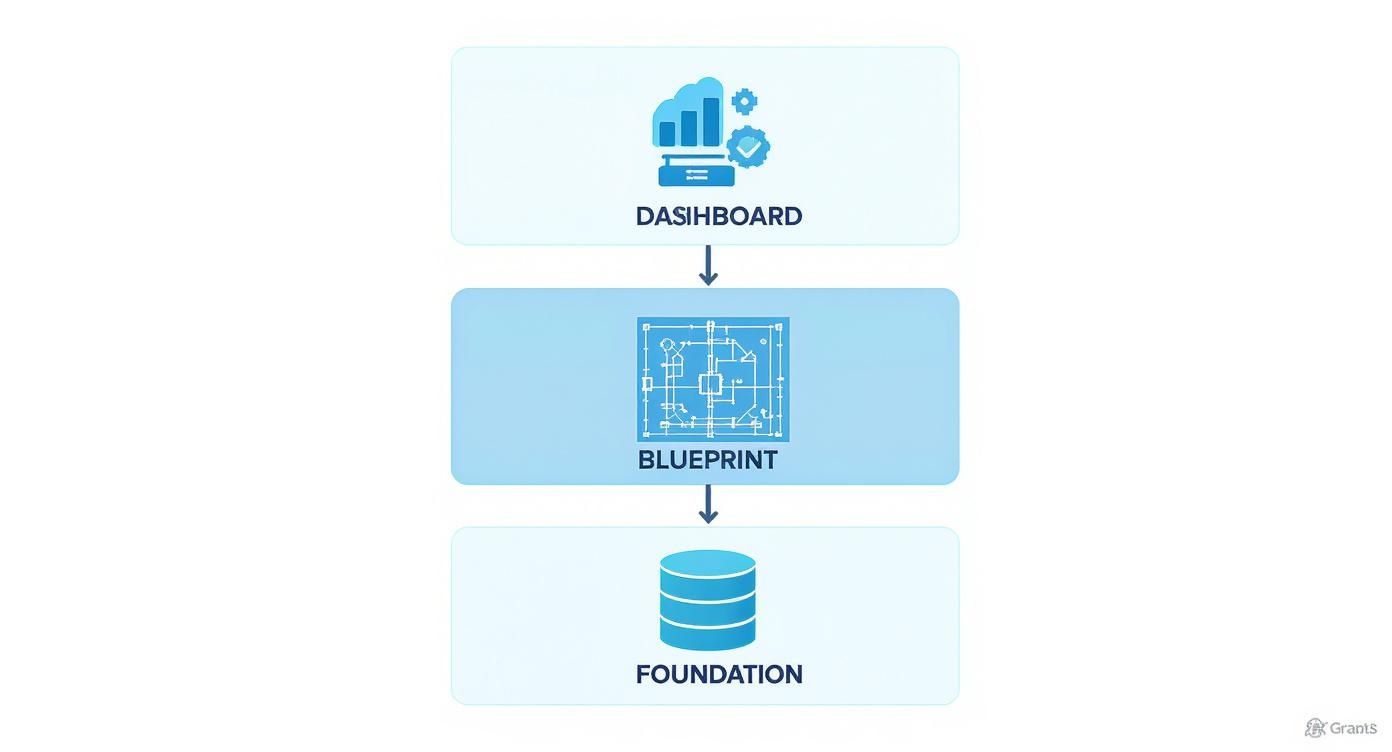
As you can see, clear business dashboards are built on a well-defined blueprint, which in turn rests on a solid data foundation.
Business Intelligence Tools: The Showroom
Finally, we arrive at the showroom. Business intelligence (BI) tools are the storefront where your team interacts with the finished product. Tools like Microsoft Power BI connect directly to your data warehouse to create interactive, insightful, and always-up-to-date reports and dashboards.
This is where the value of your entire data architecture becomes crystal clear. Instead of staring at static spreadsheets, your team gets live, dynamic views of business performance, from high-level financial summaries down to granular operational KPIs.
This complete system—from sources to dashboards—is what allows a business to finally escape the chaos of manual reporting and build a scalable foundation for data-driven decisions.
The need for this kind of integrated system is exploding. The enterprise data management market is projected to grow from USD 119.1 billion in 2025 to USD 266.8 billion by 2035, driven by the critical need for better data integration. You can discover more insights about enterprise data management trends on futuremarketinsights.com. This massive investment highlights a major shift: businesses are finally treating data as a core asset.
Choosing the Right Framework for Your Business
So you've got a handle on the building blocks. Now comes the big decision: which blueprint will you use to build your company's data house? I'll be upfront—there's no magic "best" enterprise data architecture framework. The right choice is all about your business goals, how messy your data is, and where you see the company heading in the next few years.
For most growing businesses, this decision really boils down to two main paths. Each has its own strengths, and figuring out which one fits is key to building a foundation that not only solves today's problems but is ready for tomorrow's opportunities.
Think of it like choosing between a perfectly organized library and a state-of-the-art workshop. Both are incredibly useful, but they're built to solve completely different kinds of problems.
The Traditional Data Warehouse: A Structured Library
The traditional data warehouse is your classic, meticulously organized library. Every book—or piece of data—has a specific, cataloged spot on the shelf. The rules are strict, the system is predictable, and you know that every time you pull a report, the information will be consistent and accurate. No surprises.
This approach is an absolute lifesaver for businesses that depend on rock-solid, predictable reporting, especially for finance and operations.
- Highly Structured: Data is cleaned up, transformed, and forced into a predefined structure (what we call a schema) before it gets stored. This is what guarantees all your reports will line up perfectly.
- Reliable for Reporting: It's the gold standard for creating a single source of truth. When you need to know your monthly recurring revenue (MRR) or customer acquisition cost (CAC) down to the last penny, this is your guy.
- Optimized for Known Questions: This model is brilliant at answering the questions you already have. It's built for your standard financial statements, sales performance dashboards, and tracking those crucial operational KPIs.
If your main headache is wrestling with manual reports, killing spreadsheet errors, and making sure your finance and ops teams are singing from the same hymn sheet, the traditional data warehouse is a powerful, reliable choice.
The Modern Data Platform: A Versatile Workshop
On the other side, you have the modern data platform. This is less like a library and more like a high-tech, flexible workshop. It's got all the tools to handle any material you throw at it, from perfectly planed lumber to raw, unstructured junk you just dragged in. This model is all about versatility and is perfect for businesses looking to do more than just standard reporting.
This framework can happily store data in its raw, messy format, making it ideal for juggling all kinds of information—think website clickstream data, social media comments, or customer support chat logs.
- Flexibility First: It can handle both structured data (like your sales numbers) and unstructured data (like raw text or images). This gives you a much bigger pile of raw materials to play with.
- Scalable for Growth: It’s built to expand. As your data volume and variety explode—and they will—the platform can scale right alongside you without needing a complete overhaul.
- Future-Ready: This approach opens up a world of advanced analytics. We're talking predictive modeling, deep dives into customer behavior, and uncovering insights you didn't even know you should be looking for.
This shift toward modern platforms isn't just a trend; it's a response to how business and technology have changed. The entire enterprise architecture market is expected to jump from USD 1.33 billion in 2025 to USD 2.18 billion by 2035. That's a clear signal that companies are betting big on more flexible, powerful data systems. You can read the full research on the enterprise architecture market on marketresearchfuture.com to get a deeper look at this industry shift.
For many growing businesses, the answer isn't "either/or" but "both/and." You can start with a structured data warehouse to get your core financial reporting locked down. Then, as your analytics needs grow, you can start bolting on components of a modern data platform.
At the end of the day, you need a framework that solves your immediate pain points (like that reporting chaos) while giving you a runway to scale. It’s about building a foundation that brings clarity today and unlocks the game-changing insights of tomorrow. If you're stuck trying to figure out which path makes sense for you, we can help.
Book your free BI consultation, and our experts will help you map out a data architecture that’s built for your unique goals.
How the Cloud Levels the Playing Field for SMBs
Not so long ago, a proper enterprise data architecture was a luxury. It was the exclusive playground of massive corporations with the cash and the IT muscle to buy, install, and maintain racks of expensive physical servers. For most small and medium-sized businesses, that kind of upfront investment was a complete non-starter.
Today, that barrier to entry has completely crumbled.
The cloud has totally changed the game, making powerful, scalable data infrastructure accessible to literally everyone. Instead of building a costly data centre in your office, you can now rent exactly what you need from providers like Microsoft Azure or AWS. The playing field is now level.
This fundamental shift means SMBs can finally compete on data and insights without needing an enterprise-level budget to do it.
The Power of a Cloud-Based Approach
Moving your data architecture to the cloud isn't just about dodging hardware costs; it’s about unlocking a level of strategic flexibility that was once unthinkable for a smaller company. It allows a growing business to be nimble, tough, and ready for whatever the market throws at it.
For most SMBs, going with a cloud-based approach is simply the smartest choice. Here’s why:
- Cost-Efficiency: You swap a massive capital expense for a predictable, manageable operating expense. There’s no hardware to buy, no servers to babysit, and no need for a huge IT team to keep the lights on. You just pay for what you use.
- Infinite Scalability: As your business finds its footing and starts to grow, your data needs will absolutely explode. Cloud platforms are built to scale with you, effortlessly. You can ramp up storage or processing power with a few clicks, making sure your architecture never becomes a bottleneck.
- Enhanced Accessibility and Security: Your data is kept secure and can be accessed from anywhere, which is a massive win for remote or hybrid teams. Cloud providers also pour billions into their security infrastructure, offering a level of protection most SMBs could never dream of affording on their own.
To really get the most out of cloud computing in your data strategy, looking into comprehensive cloud services can give you a significant advantage.
Your End-to-End Solution in One Place
Modern cloud platforms like Microsoft Azure offer every single tool you need to build a complete, end-to-end data solution from the ground up. You get a whole suite of integrated services that cover every single stage of the data lifecycle, from storage and integration all the way to analytics and visualization with tools like Power BI.
This integrated ecosystem is the real game-changer for SMBs. It completely removes the headache of trying to stitch together a dozen different tools. Instead, you get a unified environment where your data can flow seamlessly from its source right into a powerful financial dashboard.
This isn't a niche trend; it's a massive shift. By 2025, a staggering 63% of organizations are expected to store their data in private clouds, while 52% will use public clouds. They're all chasing the incredible scalability and cost-effectiveness that the cloud offers. You can learn more about these cloud adoption findings on cloudera.com.
At the end of the day, the cloud democratizes enterprise-grade data capabilities. It gives you the power to build a sophisticated, secure, and automated data architecture that delivers the same kind of game-changing insights your larger competitors rely on—all at a fraction of the old-school cost. If you're planning this critical move, our guide on cloud migration planning offers practical advice to help ensure a smooth transition.
Your Roadmap to Implementing Data Architecture

Building a solid enterprise data architecture is a journey, not just a one-off project. Especially for a growing business, the idea of a massive technical overhaul can feel pretty daunting. The trick is to see it as a practical, step-by-step process that delivers real value right away and builds momentum over time.
Instead of trying to boil the ocean, you need to start small with a clear plan. A phased approach lets you lock in some quick wins, prove the ROI on your investment, and learn as you go. This roadmap breaks that journey down into manageable chunks designed for maximum impact.
Phase 1: Define Your Business Questions
Before you even think about technology, start with your biggest operational headaches. What are the critical questions you're constantly asking but can never seem to get a straight answer to? For a moment, forget all the technical jargon and focus purely on the insights your business desperately needs.
This could be anything from, "What's our actual customer acquisition cost?" to "Which of our product lines have the best margins?" or even "How is our cash flow looking week-over-week?" Defining these questions from the get-go gives your entire project a clear purpose. It ensures you’re solving real business problems, not just building tech for the sake of it.
Phase 2: Audit Your Data Sources
Next up, you need to figure out where the answers to your questions are hiding. This is basically a simple audit of all your current systems. Where do you keep your financial data? Where does all your sales and customer info live?
You’ll probably find that the information is scattered all over the place, in platforms that don’t talk to each other. We’re talking about your accounting software, your CRM, your e-commerce platform, and a dozen different spreadsheets. This mapping exercise is crucial because it shows you the real scope of the integration work ahead.
Phase 3: Design a Scalable Blueprint
With your goals set and your sources mapped out, it's time to design a simple, scalable blueprint. This doesn't need to be some overly complex technical diagram. Think of it as a plan for how data will flow from its various sources, get integrated, land in a central data warehouse, and finally show up in your Power BI dashboards.
The most important principle here is to plan for future growth. Your architecture has to be flexible enough to handle new data sources and more complex questions as your business evolves. A well-designed blueprint stops you from having to rip everything out and start over in a year or two.
Phase 4: Implement in Phases and Start Small
This is the most critical step of all: do not try to do everything at once. Pick one high-impact area to begin with. Automating financial reporting is often the best first move because it delivers immediate, tangible value that everyone in the business can see.
Focus on connecting your finance software to a data warehouse and building out your first automated P&L or cash flow dashboard in Power BI. This quick win proves the power of a proper architecture, builds trust in the process, and gets everyone excited for what’s next. This approach is the bedrock of a solid data analytics strategy that puts impact first.
A well-planned data architecture is the ultimate foundation for automating reports, finally trusting your numbers, and unlocking sustainable growth.
Want to automate your reporting and finally trust your data? Book a free call with our BI consultants today.
Frequently Asked Questions
Jumping into the world of enterprise data architecture can feel a bit daunting, especially when you're busy running a business. Here are a few straightforward answers to the questions we hear most often from founders and SMB leaders who are ready to move beyond Excel chaos.
What’s the Price Tag for a Data Architecture?
The cost can swing quite a bit, depending on things like how much data you have, how many different systems you’re pulling from, and which tools you go with. But the good news is, modern cloud-based setups are surprisingly affordable and don't require the massive upfront cash that they used to.
Platforms like Microsoft Azure and BI tools like Power BI let you start small with a monthly cost that grows with you. The trick is to kick things off with a focused, high-impact project—like automating your core financial reports—to prove the value before you go all-in.
Do I Need to Hire a Bunch of Tech People to Run This?
Not at all. One of the best things about modern cloud and BI tools is that they’re built to be much more user-friendly than the clunky, complex systems of the past. You definitely don’t need to go out and recruit a full-time data engineering team just to get started.
For most small and mid-sized businesses, the smartest route is to partner with a consultancy like Vizule. We handle all the technical heavy lifting—the setup, the integrations, the maintenance—so you can focus on what you do best: using the insights to make better decisions and grow your company.
How Quickly Will I Actually See Results?
You’ll start seeing a real impact much faster than you probably think. Building out a full-scale architecture is more of a journey than a weekend project, but getting you quick wins is a huge part of our process.
We start by tackling a major pain point. For example, building your first automated financial dashboard in Power BI can put real, tangible value in your hands—and save you hours of manual work—in just a few weeks. The idea is to build momentum by solving your biggest headaches first.
Ready to stop wrestling with spreadsheets and start making decisions with confidence? Vizule can help you design and implement an enterprise data architecture that automates your reporting and finally gives you a single source of truth.


