


From Data Chaos to Business Clarity: A Guide to Predictive, Descriptive, and Prescriptive Analytics
Are you staring at another tangled spreadsheet, wondering what your data is actually telling you? You're not alone. Many small business owners feel like they're drowning in data but starved for actual insight. The journey from data chaos to strategic clarity starts with understanding the crucial differences between predictive, descriptive, and prescriptive analytics. Think of them less as complex jargon and more as a powerful framework to help you make smarter, faster decisions.
This guide will show you how to move beyond manual reporting and unlock the kind of insight that drives real growth.
From Spreadsheet Chaos To Strategic Clarity
For many small and medium-sized business (SMB) owners, data feels more like a burden than an asset. You're likely trapped in a cycle of manual reporting—exporting CSVs from different systems and wrestling with VLOOKUPs in Excel, only to get a report that’s already out of date. It’s a common pain point we see every day.
This constant firefighting keeps you from focusing on what really matters: scaling smart, aligning your finance and operations, and leading your team.
But what if you could move beyond just looking in the rearview mirror? Imagine if your data could not only tell you what happened last quarter but also what’s likely to happen next month—and even suggest the best course of action. This is the real power of modern business intelligence. A foundational step is grasping the differences between spreadsheets and databases, which sets you up for a scalable system.
The Three Levels of Business Insight
As a consultant, I often compare the analytics journey to learning to navigate a road trip. At first, you only know where you've been. Then, you learn to read a map to see where you're going. Finally, you get a smart GPS that reroutes you around traffic in real time.
This progression perfectly mirrors the three types of analytics:
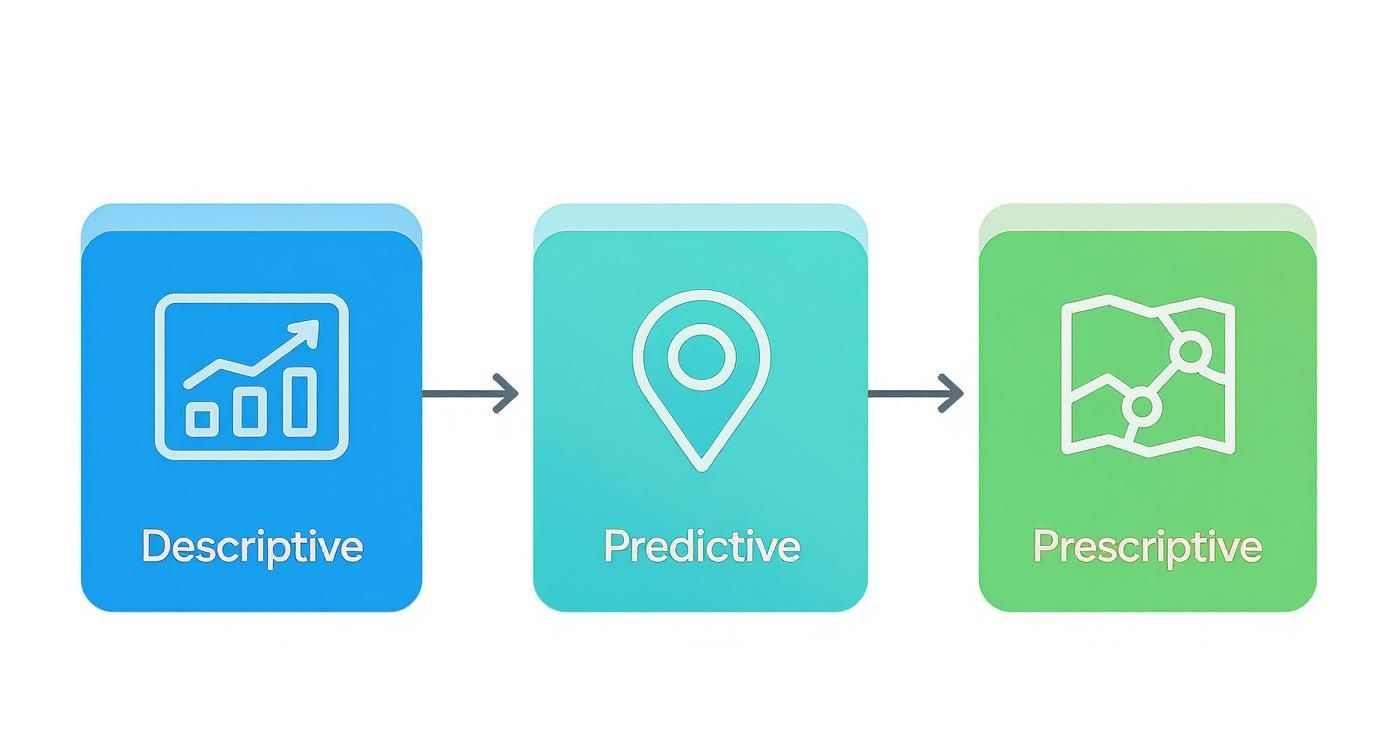
- Descriptive Analytics: This is your car's dashboard showing your current speed and fuel level. It answers the question, “What happened?”
- Predictive Analytics: This is your GPS estimating your arrival time based on current traffic. It answers the question, “What is likely to happen?”
- Prescriptive Analytics: This is that smart rerouting feature, actively avoiding the traffic jam ahead. It answers, “What should we do about it?”
For a quick reference, here’s how they stack up against each other.
The Three Types Of Analytics At A Glance
| Type of Analytics | Core Question It Answers | Key Function | Business Value |
|---|---|---|---|
| Descriptive | What happened? | Summarizes past data into understandable reports. | Provides a clear picture of historical performance and a single source of truth. |
| Predictive | What is likely to happen? | Uses statistical models to forecast future outcomes. | Helps anticipate trends, manage cash flow, and prepare for future events. |
| Prescriptive | What should we do about it? | Recommends specific actions to achieve desired goals. | Guides strategic decisions with data-backed options to optimize results. |
Each type builds on the last, taking you from simply understanding the past to actively shaping the future.
This concept map below visualizes that journey.
This flow shows how each type of analytics builds on the last, moving from basic reporting to advanced, decision-driving recommendations. Gaining this visibility is the core value of adopting modern business intelligence for small business, as it puts you firmly in control of your company’s future.
This guide will give you a clear, actionable path to make this transition, empowering you to lead with proactive, data-backed strategy.
What Happened? Understanding Descriptive Analytics

Every solid data strategy starts with a strong foundation. In the world of business intelligence, that foundation is descriptive analytics. It’s the essential first step, the one that answers a single, crucial question: “What happened?”
Think of it as the rearview mirror and dashboard for your business. It doesn’t tell you where you’re going or which turn to take next, but it gives you a crystal-clear, factual picture of where you’ve been and where you are right now. For SMB operators drowning in spreadsheets, this is the first breath of fresh air—a reliable way to see exactly how things stand.
This isn't just about making pretty charts. It’s about building a single source of truth that everyone on your team can trust. Without this historical context, any attempt at forecasting (predictive) or strategic planning (prescriptive) is really just a shot in the dark.
From Raw Data to Clear Insights
So, how does this actually work? Descriptive analytics is the process of gathering historical data from all your different systems—your accounting software, CRM, and sales platforms—and pulling it all together into a format you can actually understand. Plain and simple.
The whole point is to get beyond endless rows of numbers and generate insights you can grasp in a moment. This process uncovers patterns, tracks your key performance indicators (KPIs), and measures how you’re doing against your goals. It's the engine that powers those dynamic dashboards and automated reports that finally free you from manual data entry.
Descriptive analytics transforms your historical data from a cluttered archive into an organized library of business performance. It’s the process of making sense of the past to inform your actions in the present.
You can't overstate how important this foundational layer is. The global data analytics market, which is built on descriptive analytics, was valued at USD 69.54 billion in 2024 and is projected to hit USD 302.01 billion by 2030. That massive growth, detailed in this data analytics market report, shows just how critical it is for businesses of all sizes to get a handle on their historical data.
Practical Applications for SMBs
For a startup founder or small business operator, the value here is immediate and tangible. It’s about automating the reports you currently spend hours, or even days, building by hand. With a tool like Power BI, we can connect your different data sources and create live, interactive dashboards that do the work for you.
Here are a few real-world examples:
- Automated Financial Reporting: Instantly pull up your Profit & Loss (P&L) statement, cash flow reporting, or balance sheet without messing with a single VLOOKUP. Your financial health is right there, updated in real-time.
- Sales Performance Tracking: Instead of a static weekly report, you get a live dashboard to monitor your sales pipeline, track revenue by product or salesperson, and see who your most profitable customers are.
- Operational Efficiency: Dig into your production costs, inventory turnover, or project timelines to spot bottlenecks and find opportunities to tighten things up.
Picture an e-commerce owner who used to spend the first Monday of every month painfully exporting sales data from Shopify, ad spend from Google Ads, and inventory levels from their warehouse system into a monster Excel file.
With descriptive analytics set up in Power BI, that entire time-consuming process is automated. Now, they just open a single dashboard that shows last month's revenue, top-selling products, and marketing ROI—all updated automatically. This shift doesn't just save 10-15 hours a month; it gives them the reliable, up-to-the-minute insights needed to make faster, smarter decisions. Of course, to make those dashboards truly impactful, it helps to follow a few key data visualization best practices.
This clarity is the launchpad for the entire descriptive, predictive, and prescriptive analytics framework. Once you have a firm grasp on "what happened," you’re perfectly positioned to ask the next logical question: "What will happen next?"
What Will Happen? Unlocking Predictive Analytics

Once you have a crystal-clear, automated view of your past performance, the next logical question is, "So, what's likely to happen next?" This is where you graduate from reacting to the past to proactively shaping the future. Welcome to the world of predictive analytics.
Predictive analytics builds directly on the foundation laid by your historical data. It uses statistical models and forecasting techniques to map out the likelihood of future outcomes. In simple terms, it’s like using your rearview mirror (descriptive data) to anticipate the traffic patterns on the road ahead.
For a business owner, this isn't about gazing into a crystal ball. It’s about making calculated, intelligent estimates that give you a serious competitive edge. Instead of guessing, you can start making strategic calls based on what your data suggests is just around the corner.
From Historical Data to Future Scenarios
The real power of predictive analytics for a growing business is how practical it is. It translates those raw historical numbers into actionable forecasts that can directly beef up your bottom line. There's a reason the global predictive analytics market is exploding; it's expected to rocket from USD 10.5 billion to USD 28.1 billion by 2026. This rapid adoption shows just how essential forecasting has become.
This is where tools like Power BI really start to flex their muscles. By connecting to your historical sales, financial, and operational data, Power BI can run forecasting models to help you answer your most pressing business questions.
Predictive analytics is the bridge between knowing where you’ve been and preparing for where you’re going. It empowers you to stop reacting to market changes and start anticipating them.
Let’s make this real. Remember our e-commerce owner who automated their monthly reporting? Now, they can take it a giant leap further.
Real-World Forecasting for SMBs
By applying predictive models to their sales history, they can generate remarkably accurate forecasts for future demand. This isn't just an interesting data exercise; it has immediate, tangible benefits for the business.
Here are a few scenarios where predictive analytics becomes a game-changer:
- Cash Flow Forecasting: By analysing past revenue cycles and payment behaviours, you can build a reliable cash flow forecast. This helps you manage your operational runway, plan for large expenses, and know exactly when you might face a cash crunch. No more nasty surprises.
- Customer Churn Prediction: Your data can reveal subtle patterns in the behaviour of customers who are about to leave. A predictive model can flag these at-risk accounts, allowing your team to jump in with targeted offers or support before it's too late.
- Inventory and Demand Planning: For any product-based business, this is huge. Forecasting demand for the upcoming holiday season means you can optimise your stock levels—avoiding both costly stockouts on popular items and getting stuck with overstock on products that won't sell.
This is how a business shifts from being reactive to proactive. You’re no longer blindsided by a sudden dip in sales or a stockout during your busiest season. Instead, you have the foresight to prepare. To see how this translates into real-world value, you can explore examples like predictive maintenance applications that save companies a fortune.
The techniques behind these forecasts can range from simple time-series analysis to more complex regression models. If you're curious about the mechanics, we've covered a range of predictive modeling techniques that can be applied in both financial and operational contexts.
With these forward-looking insights in hand, you’re ready for the final, most powerful step. You know what happened and what’s likely to happen. Now it’s time to answer the ultimate strategic question: "How can we make the best outcome happen?"
How Can We Make It Happen? Mastering Prescriptive Analytics

This is the final, most powerful stage of your analytics journey. You’ve mastered descriptive analytics ("what happened") and unlocked predictive insights ("what will happen"). Now you’re ready for the ultimate question: "So, what should we do about it?"
Welcome to prescriptive analytics. This is where data stops being a rearview mirror and starts being your GPS, recommending the best route to your destination. It takes all that historical data and your new forecasts, runs them through sophisticated models, and provides concrete, actionable recommendations.
For a non-technical founder, this might sound intimidating, but the outcome is beautifully simple. It’s about getting clear, data-backed answers to your toughest strategic questions, taking the guesswork and gut feelings out of the equation.
From Prediction to Actionable Recommendation
Prescriptive analytics doesn’t just show you one possible future; it simulates many possible futures to pinpoint the best one. Think of it as having a team of analysts working 24/7, testing every single option and handing you the one that promises the highest return.
The explosive growth in this field says it all. The global prescriptive analytics market, valued at around USD 9.56 billion in 2024, is expected to skyrocket to USD 82.31 billion by 2034. This surge, detailed in recent prescriptive analytics market projections, shows just how critical this step is becoming for staying competitive.
Prescriptive analytics is the difference between a weather forecast that predicts rain and a navigation app that not only tells you it will rain but also reroutes your drive to avoid flooded roads and suggests the best time to leave.
This is what turns your data from a passive asset into your most powerful competitive weapon.
Real-World Scenarios for SMBs
Let’s go back to our e-commerce business owner. They've automated their reporting (descriptive) and forecasted next quarter's demand (predictive). Now, prescriptive analytics helps them act on that intelligence with surgical precision.
Here’s what that looks like in practice:
- Dynamic Pricing Optimization: A prescriptive model could recommend the exact discount to apply to slow-moving stock to clear inventory while maximizing profit. It would factor in everything from demand elasticity to competitor pricing.
- Marketing Budget Allocation: Instead of guessing where to put marketing dollars, the model can pinpoint the channel that will deliver the highest ROI for a new product launch, even suggesting a precise budget split for your cash flow reporting.
- Supply Chain Improvements: The system can recommend the perfect reorder points for materials by simulating different lead times and demand spikes. The result? You minimize both storage costs and the risk of running out of stock.
These aren't just theories; they're direct, data-driven instructions. This same logic is used in more complex financial modeling. To see how businesses simulate countless outcomes to find the optimal path, check out our guide on applying a Monte Carlo simulation in finance.
By mastering this final stage, you complete the journey from being reactive to truly proactive. You’re no longer just observing your business—you're actively steering it toward its best possible future.
Your Roadmap From Data Overload To Actionable Insight
Knowing the theory behind descriptive, predictive, and prescriptive analytics is one thing. Putting it into practice is another. For the founder of a small or medium-sized business, the thought of rolling out a full analytics framework can feel daunting. Honestly, where do you even start?
The good news is you don't have to boil the ocean. This isn't an all-or-nothing leap. Think of it as a journey that builds on itself, delivering more value at every stage. This roadmap lays out a clear, step-by-step approach to get you from data chaos to clear, actionable insight. It’s all about scoring quick wins while building a solid foundation for the long haul.
Phase 1: Unify Your Data Sources
Before you can analyze anything, you need one reliable source of truth. Most SMBs have their data scattered all over the place: accounting software like Xero or QuickBooks, a CRM like HubSpot, e-commerce platforms like Shopify, and of course, a mountain of spreadsheets. The first job is to tear down those data silos.
This means connecting all those separate systems into a central data model. The goal is simple: put an end to the mind-numbing manual exporting and copy-pasting that eats up your time and is riddled with errors. By creating one unified view, you guarantee that every report and every dashboard is pulling from the same consistent, up-to-date information.
Phase 2: Select The Right BI Tool
Once your data is ready, you need a platform to make it all come alive. While there are many business intelligence tools out there, we find Power BI is an exceptionally smart choice for SMBs, and here’s why:
- Cost-Effectiveness: It packs a serious punch with powerful features at a price point that won't make a small business wince, delivering a much higher ROI than many massive enterprise platforms.
- Deep Integration: It's a Microsoft product, so it plays beautifully with tools you’re probably already using—most importantly, Excel. This makes the transition from Excel to Power BI incredibly smooth for your team.
- Scalability: Power BI grows right alongside you. You can start with simple descriptive dashboards and then layer on more sophisticated predictive and prescriptive models as your business gets more complex.
Picking the right tool is a massive part of a successful data analytics strategy, because it’s the engine that will power all your future insights.
Phase 3: Build Foundational Descriptive Dashboards
This is where you bank your first big "quick win." With your data unified and BI tool in hand, the next step is building your core descriptive dashboards. This is the bedrock of the entire predictive descriptive prescriptive framework.
Start with the basics—the reports you're currently sinking the most hours into building by hand.
- Financial Health Dashboard: A live look at your P&L, cash flow, and key financial ratios.
- Sales Performance Dashboard: Tracking revenue, where deals are in the pipeline, and performance by product or salesperson.
- Operational KPI Dashboard: Monitoring vital metrics like customer acquisition cost (CAC), lifetime value (LTV), or inventory turnover.
The whole point here is immediate value. By automating these fundamental reports, you instantly reclaim hours of manual work and give your entire team a single, trusted place to see how things are going. This step alone can be a total game-changer for how efficiently you operate.
Phase 4: Layer On Predictive Forecasting
Once your descriptive dashboards are giving you a crystal-clear picture of "what happened," you can start looking ahead. All that historical data you've meticulously organized is now the fuel for your predictive models.
Don't try to predict everything at once. Start with one focused, high-impact forecast. A great starting point for many SMBs is a forecasting model for cash flow. Using your historical sales and expense data, we can help you build a model in Power BI that projects your cash position over the next few months. This is huge for managing runway, planning investments, and avoiding nasty financial surprises.
From there, you can branch out into other areas, like forecasting customer demand or predicting which customers might be about to leave. Each new model builds on your data foundation, moving you from being reactive to truly proactive.
Making the jump from theory to a live system that generates real insight is a structured process. It starts with getting your data house in order and ends with you making smarter, forward-looking decisions. Ready to build your own roadmap?
Want to automate your reporting and finally trust your data? Book your free BI consultation today and let our experts guide you through each step.
Start Making Confident Data-Driven Decisions
Moving from descriptive to predictive and prescriptive analytics isn't just a technical upgrade; it's a fundamental shift in how you see and run your business. It means you stop being reactive to the past and start actively shaping your future. Think of it as the difference between poring over last quarter’s numbers and confidently steering the ship toward next year’s goals.
For small and mid-sized businesses, this is huge. It means saving countless hours, stamping out the costly manual errors hiding in spreadsheets, and finally getting a crystal-clear view of your financial performance. You can stop second-guessing and start making strategic moves backed by solid data.
It’s time to stop wrestling with your data and start using it as your most powerful asset. True growth happens when you can trust your numbers to guide every critical decision.
Getting from data chaos to clarity is a journey, not a light switch moment. It’s a structured process where each step—from automating your first P&L report to building a forecasting model—builds on the last and delivers immediate value along the way.
Ready to unlock what your data is trying to tell you?
Book a free discovery call with our BI consultants today and let's build your roadmap to clarity and growth.
Frequently Asked Questions About Business Analytics
Jumping into the world of analytics can stir up some practical questions. As a founder or operator, you need to know how these concepts actually create value for your business. Let's tackle some of the most common concerns we hear from SMBs starting this journey.
Do I Need All Three Types of Analytics Right Away?
Absolutely not. In fact, trying to implement a full descriptive, predictive, and prescriptive framework from day one is a recipe for frustration. As trusted advisors, we always recommend building it up piece by piece.
You should always, always start with descriptive analytics. This is your foundation. Getting your core financial and operational dashboards automated gives you immediate wins. It saves a ton of time and, more importantly, establishes a single source of truth for your numbers. Once you have a crystal-clear, reliable view of what happened, you can then start building on it with predictive forecasting.
Is Power BI Too Expensive For My Business?
This is a very common myth. While some enterprise-level BI platforms can carry an eye-watering price tag, Power BI was built to be incredibly accessible for small and medium-sized businesses. Its cost-effectiveness is one of its greatest strengths, packing powerful features without the six-figure investment.
When you think about the hours you'll save by ditching manual reporting and the value of making smarter, data-backed decisions, Power BI usually pays for itself very quickly.
How Quickly Can I Expect To See Results?
The timeline really depends on where you are in your analytics journey. The good news? The foundational work delivers value almost instantly.
-
Initial Dashboards (Descriptive): You can see tangible results within a few weeks. Automating key financial reports like your P&L or cash flow statement provides immediate relief from spreadsheet headaches and gives you clear, real-time visibility.
-
Advanced Models (Predictive/Prescriptive): Building out reliable forecasting and optimization models is more of a long-term play. These projects need clean, historical data and careful development, but they're what unlock the deeper strategic advantages over time.
The key is to nail those initial descriptive reports first. It builds momentum and gives you the clean data you'll need for the more advanced stuff down the road.
Ready to stop guessing and start seeing what your data is truly capable of? The team at Vizule specializes in building custom analytics roadmaps for SMBs. We connect the dots in your data so you can make confident, insight-led decisions.


