


So, what exactly is a data strategy?
Think of it less like a dense, technical document and more like a business roadmap. It's a clear, practical plan that connects your big-picture goals—like boosting customer retention or smoothing out cash flow—directly to the data you collect every day. It outlines exactly how you'll capture, store, manage, and actually use that information to get ahead.
From Data Chaos to Strategic Clarity
Let’s be honest. For many small and medium-sized business owners, the phrase "data strategy" sounds like something reserved for massive corporations with entire floors dedicated to analytics. But in reality, it's the very thing that helps ambitious, smaller companies punch well above their weight.
It’s the difference between being drowned in information and being genuinely empowered by it.
Without a plan, data often ends up creating more problems than it solves. Sound familiar? Maybe you're stuck in "Excel hell," where different team members are working from conflicting spreadsheets, making reporting a painful, manual chore. Decisions get made on gut feelings or shaky information simply because getting a straight answer takes far too long. This reactive mess isn't just inefficient—it's a serious roadblock to growth.
Here’s a quick comparison showing how a data strategy transforms daily operations:
| Business Function | Without a Data Strategy (The Chaos) | With a Data Strategy (The Clarity) |
|---|---|---|
| Reporting | Manual, time-consuming report building in spreadsheets. | Automated, real-time dashboards with a single source of truth. |
| Decision-Making | Based on gut feelings, anecdotes, or incomplete data. | Based on reliable, up-to-date facts and clear performance metrics. |
| Team Alignment | Sales, Marketing, and Ops use different numbers and metrics. | Everyone works from the same data, towards the same goals. |
| Operations | Reactive problem-solving; fixing issues as they appear. | Proactive performance tracking; identifying trends and opportunities early. |
This table illustrates the fundamental shift: a data strategy moves you from a constant state of putting out fires to a position where you can prevent them from starting in the first place.
The Shift from Guesswork to Growth
A well-designed data strategy changes this dynamic completely. It acts as a blueprint for turning scattered data points from your sales, marketing, and operations into a cohesive, single source of truth. Instead of just passively collecting data, you start using it with a clear purpose.
This intentional approach means you can:
- Stop guessing: Swap out assumptions for hard facts when making critical business moves.
- Automate reporting: Free up countless hours by killing off manual report-building and data-wrangling tasks.
- Gain clear visibility: Finally understand what's really driving performance, from customer behaviour to operational bottlenecks.
- Align your team: Get everyone, from finance to the sales floor, working from the same numbers and pulling in the same direction.
A great data strategy isn't about hoarding more data; it's about having the right data, organized in a way that answers your most important business questions. It transforms data from a passive asset into an active driver of growth.
Ultimately, a well-defined strategy makes https://vizule.io/data-driven-decision-making/ a practical reality, not just an empty buzzword. It's the essential foundation that allows you to build automated reporting systems, create powerful Power BI dashboards, and unlock the insights you need to scale with confidence. This plan ensures every piece of data you collect serves a direct commercial purpose, helping you move faster and smarter than the competition.
Understanding the Four Pillars of a Data Strategy
A strong data strategy isn't some monolithic project you tackle once and forget. It's a living system, balanced on four pillars that all have to work together. For founders and operators, breaking it down this way makes the whole thing feel less daunting and gives you a clear framework for action.
Think of it like building a house. You need a solid foundation (governance), the right structure and plumbing (technology), skilled builders who know what they're doing (people), and a clear reason for the building to exist in the first place (analytics).
When these four pieces click into place, they create a powerful engine for growth. Raw data stops being a messy byproduct of your operations and starts becoming your most valuable strategic asset. But if you neglect any one of them, the whole structure can get pretty wobbly.
Pillar 1: Data Governance
Data Governance is the bedrock of everything. Put simply, it’s about making sure your data is accurate, consistent, secure, and trustworthy. If your team can’t rely on the numbers they’re seeing, any dashboard or report you build is basically useless. It’s the quality control for your information.
For a growing business, this doesn’t mean creating a mountain of complex rules. It starts with simple, practical questions:
- Who owns our key data? Is the sales team responsible for keeping the CRM clean? Does finance own the numbers in your accounting software?
- What’s our "single source of truth"? You need to define exactly how you calculate crucial metrics like "customer lifetime value" or "monthly recurring revenue." This stops different departments from showing up with conflicting numbers.
- How do we keep data clean and secure? This involves setting basic standards for how data is entered and controlling who can access sensitive information.
Good governance builds confidence. When your team trusts the data, they’ll actually use it to make important decisions. You can learn more about how effective policies create reliable insights in our guide to data strategy and governance.
Pillar 2: Technology and Architecture
This pillar covers the tools and infrastructure you use to collect, store, and process all your data. It’s the plumbing and wiring of your data house. For any founder wrestling with disconnected systems, getting the architecture right is an absolute game-changer.
This isn’t about buying the most expensive software on the market. It’s about picking the right tools for your specific needs. The stack usually includes:
- Data Sources: This is your raw information, living in places like QuickBooks, HubSpot, Shopify, or even those sprawling operational spreadsheets.
- Data Warehouse/Lakehouse: This is a central hub where you bring all that disconnected data together. Modern cloud solutions have made this more accessible for small and mid-sized businesses than ever before.
- Business Intelligence (BI) Tools: This is where the magic happens. A tool like Power BI connects to your central data source and turns raw numbers into interactive, easy-to-understand dashboards and financial models.
The goal here is to create a seamless flow of information from where it’s created to where it can be analyzed, automating all that painful manual work of exporting and merging spreadsheets.
Pillar 3: People and Processes
You can have the best data and the most powerful tools in the world, but they’re worthless if your team doesn’t know how—or why—to use them. This pillar is all about the human side of your strategy: building a data-literate culture and defining the workflows that embed data into everyday decisions.
It’s about empowering your people, not just handing them a new piece of software. This involves:
- Building Data Literacy: Training your team not just to read reports, but to ask the right questions of the data.
- Defining Clear Processes: Establishing routines around data. For example, maybe the leadership team reviews an automated sales dashboard every Monday morning to set priorities for the week.
- Encouraging Curiosity: Creating an environment where people feel comfortable digging into the data to find new opportunities or spot problems before they blow up.
A successful data strategy doesn't just deliver reports; it changes behaviours. It shifts the default from "I think" to "The data shows," making your entire organization smarter and more agile.
Pillar 4: Analytics and Business Intelligence
This is the final, most visible pillar. It’s where all the other components come together to deliver real, tangible value. Analytics and Business Intelligence (BI) is the process of turning your governed, well-structured data into insights that answer your most pressing business questions.
This is where you move beyond just looking at what happened (descriptive analytics) to understanding why it happened (diagnostic analytics) and even predicting what’s likely to happen next (predictive analytics). For a growing business, this could mean:
- Creating a Power BI dashboard that reveals which marketing channels deliver the most profitable customers.
- Building an automated cash flow forecasting model that updates in real-time.
- Identifying the key drivers of customer churn by connecting sales data with support tickets.
Getting these four pillars aligned with your core business objectives is the whole game. But getting it right isn't easy. An analysis of over 850 companies by Boston Consulting Group found that only 35% of digital transformation projects—which are all powered by data—actually achieve their goals. This really underscores the importance of a structured, expert-led approach. You can discover more about these challenges and how to overcome them by reading more on data transformation statistics.
Your Roadmap From Spreadsheets to Strategy
Knowing the theory behind a data strategy is one thing, but turning that theory into action is what actually drives growth. For most founders we talk to, the biggest question is always the same: "Where on earth do we start?"
The path from a tangle of messy spreadsheets to clear, strategic insights can feel like a mountain to climb. But it doesn't have to be. It’s all about taking a practical, step-by-step approach—one that focuses on quick wins to build momentum.
At Vizule, we've distilled this journey into a simple but powerful three-phase framework: Map–Model–Mobilise. This isn't some rigid, multi-year corporate overhaul. It's an agile roadmap designed for SMBs, built to deliver real value in weeks, not years. It takes the abstract idea of a "data strategy" and makes it a concrete action plan.
Phase 1: Map Your Data and Define Your Questions
Before you build a single dashboard, you need a map of where you're going. The Map phase is all about discovery and getting everyone on the same page. We always start by asking the most fundamental question: What critical business questions do you need answers to right now?
This isn't a technical exercise; it's a commercial one. We hone in on your biggest headaches and opportunities. Are you struggling to figure out which customers are actually profitable? Is your cash flow forecast a complete black box? Do you have any real idea which marketing channels are bringing in sales?
Once we’ve locked down these key questions, we start hunting for the data needed to answer them. This usually means digging into information that’s siloed across different systems:
- Financial Data tucked away in QuickBooks or Xero.
- Sales Data living in your CRM, like HubSpot or Salesforce.
- Operational Data often trapped in a web of complex Excel or Google Sheets.
The whole point of this phase is to create a clear blueprint connecting your most urgent business problems to the exact data needed to solve them. As you move away from manual data wrangling, setting up solid Automated Data Processing becomes a game-changer for ensuring efficiency right from the get-go.
Phase 2: Model Your Data for Clarity and Insight
With your map in hand, it’s time for the Model phase. This is where the magic happens. We start bringing your disconnected data together to build the engine that will power your insights. We take all that raw information we found in the Map phase and structure it into a cohesive, reliable single source of truth.
This usually involves building a lightweight, central data model that cleans, standardises, and connects your information. For example, we can finally link your sales transactions from Shopify to your marketing spend from Google Ads and your financial records from Xero. Suddenly, you have a unified view of the business that was simply impossible before.
From this solid foundation, we start building powerful, intuitive dashboards and financial models in tools like Power BI. These aren't just generic reports. They are custom-built visualisation tools designed specifically to answer the key questions we defined in phase one. The result is a dynamic view of your business that updates automatically, finally freeing your team from the soul-destroying cycle of manual reporting.
Phase 3: Mobilise Your Team for Action
The final and most critical phase is Mobilise. A beautiful dashboard is completely useless if it doesn't lead to better decisions. This phase is all about empowering your team to use these new insights to take confident, data-backed actions. We don't just hand over a tool and walk away; we help you weave it into the very fabric of your team's weekly and daily routines.
This looks like:
- Hands-on Training: We sit down with your key team members to make sure they're comfortable navigating the dashboards and can ask their own questions of the data.
- Defining New Rhythms: We help you establish new habits, like reviewing key performance indicators (KPIs) in your weekly leadership meeting or using the cash flow model to guide monthly strategic planning.
- Fostering a Data Culture: We help you shift the company mindset from relying on gut feel to trusting the data. It’s about making insight-led decision-making a habit, not a chore.
This practical, three-step journey is at the heart of our philosophy. For a more detailed breakdown, you can check out our complete guide on building a successful data strategy roadmap.
The global data analytics market is booming for a reason—it’s expected to hit $132.9 billion by 2026 because businesses are seeing real returns. In fact, research shows over 90% of organisations report getting measurable value from their data investments.
The infographic below illustrates the core pillars that our Map-Model-Mobilise framework helps you build and strengthen.
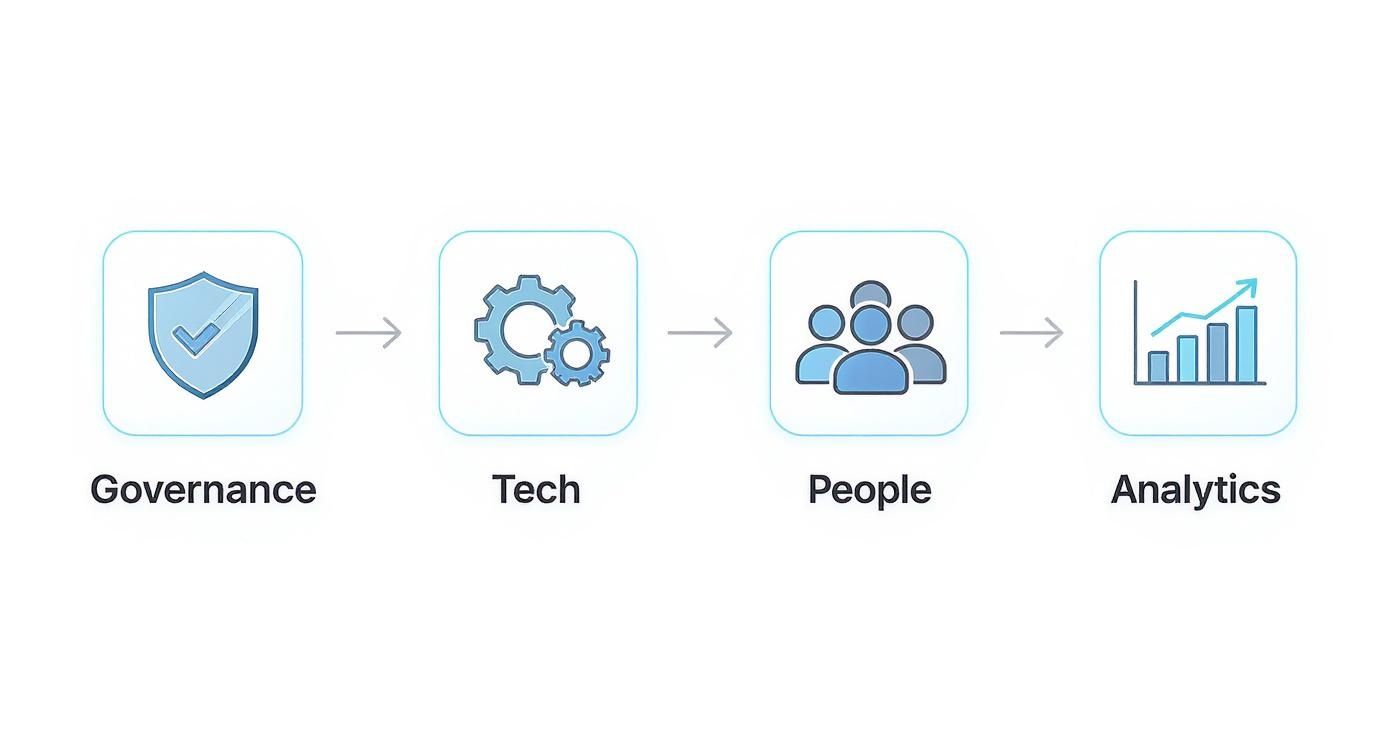
As you can see, governance, technology, people, and analytics are all interconnected. For a strategy to truly work, they have to be in sync. Our approach makes sure each pillar is addressed in a practical, results-focused way, turning a complex process into an achievable roadmap for any SMB.
How a Data Strategy Actually Drives Business Results
Theory is one thing, but results are what really matter. A data strategy isn't some abstract plan that sits on a shelf; it's the engine that solves real-world business problems and unlocks tangible growth. When you finally connect all the right dots, the impact is felt directly on your bottom line.
Let's move past the concepts and look at what a well-executed strategy looks like in action for businesses just like yours. These aren't just stories—they're concrete examples of how connecting siloed information leads to smarter decisions and a genuine competitive edge.

Uncovering True Profitability in E-commerce
Picture a growing e-commerce brand. They're fantastic at bringing in new customers, but their actual profitability is a complete mystery. Sales data is stuck in Shopify, ad spend lives in Google Ads, and all the financial records are siloed in Xero. Answering a simple question like, "Which of our products actually make us money after all the costs?" becomes a week-long spreadsheet nightmare.
This is where a data strategy delivers its first huge win.
By building a central data model that automatically pulls from all three systems, the founder can finally see the complete picture on a single Power BI dashboard. This unified view reveals two game-changing insights:
- Customer Lifetime Value (CLV): They discover that customers acquired through organic search have a 3x higher CLV than those from paid social ads, even though the initial acquisition cost was similar.
- True Product Margin: After factoring in shipping, transaction fees, and ad spend, they learn their best-selling product is barely breaking even. Meanwhile, another, less popular item has a massive 70% net margin.
Armed with this newfound clarity, the business can immediately reallocate its marketing budget to more profitable channels and strategically promote its high-margin products. The result is a direct, measurable jump in net profit—without spending a single extra dollar on advertising.
Improving Cash Flow Forecasting for B2B Services
Now, think about a B2B service firm that's constantly wrestling with cash flow visibility. They depend on a clunky spreadsheet to forecast incoming payments and outgoing expenses. It’s always out of date, riddled with human error, and makes planning for future hires or investments feel like a total shot in the dark.
Their data strategy zeroes in on automating this critical financial process. By connecting their accounting software (QuickBooks) with their project management tool (Asana) and CRM (HubSpot), they build a dynamic cash flow model in Power BI.
This isn't just another report; it's a strategic weapon. It lets them run what-if scenarios in real time. What happens to our cash position if we land that big client next month? What if a major project gets delayed by two weeks?
The impact is immediate. They improve their cash flow forecast accuracy by over 25%, giving them the confidence to make proactive decisions about hiring and capital investments. The once-dreaded weekly finance meeting transforms into a forward-looking strategy session, guided by reliable, up-to-the-minute data.
Enhancing Operational Efficiency
A solid data strategy is essential, but its true power is often unlocked by the right technology. Once you have a clean, reliable data foundation, you can start exploring powerful automation and analytics. For businesses looking to streamline even further, exploring the best AI tools for small business can open up new ways to improve decision-making and operational efficiency.
These examples all point to a core truth: a data strategy is the bridge between the information you have and the outcomes you want. It’s about turning fragmented data into clear, actionable insights that boost profitability and efficiency. By focusing on strategic data analytics, you transform data from a confusing liability into your most valuable asset for growth.
Common Data Strategy Mistakes to Avoid
Starting a data journey is exciting, but it’s remarkably easy to stumble if you don't know where the landmines are buried. Too many well-intentioned businesses fall into the same common traps, wasting time, money, and momentum. If you understand these pitfalls upfront, you can navigate your own path to data clarity with confidence.
Knowing what not to do is just as important as knowing what to do. The goal isn't to build a perfect, all-encompassing system overnight. It's to sidestep costly errors and focus your resources where they'll make the biggest impact, fast.
Mistake 1: Treating Data as a Tech Project
One of the most common blunders is viewing data strategy as something for the IT department to handle. Business leaders often delegate it to their tech teams, expecting a magic solution to appear. But here’s the thing: a data strategy is fundamentally a business strategy. Technology is just the vehicle that gets you there.
When there are no clear commercial goals driving the process, you end up with technically brilliant dashboards that nobody uses because they don't answer the right business questions. Your strategy must start in the boardroom, with leadership defining what success actually looks like, not with choosing a piece of software.
Mistake 2: Boiling the Ocean
Faced with years of accumulated data, the temptation is to try and track and analyse everything at once. This "boil the ocean" approach almost always leads to paralysis. Teams spend months trying to clean every last spreadsheet and connect every possible data source, burning through budget and patience before delivering a single insight.
The most effective data strategies are ruthlessly focused. They start by identifying one or two critical business problems and delivering a clear, tangible solution. This creates momentum and demonstrates ROI, building the case for further investment.
Instead of trying to do everything, just ask: "What is the one answer that would make the biggest difference to our business this quarter?" Start right there.
Mistake 3: Ignoring Data Quality
Another critical oversight is diving straight into building dashboards with messy, unreliable data. If your inputs are garbage, your outputs will be useless—it’s that simple. This erodes trust and, worse, can lead your team to make terrible decisions based on completely inaccurate information.
Good data is the foundation for everything that comes next. According to recent surveys, 78% of organisations now use artificial intelligence in at least one business function, a huge jump from 55% just a year earlier. That surge is happening because high-quality data is finally available to power these advanced tools.
Ensuring your data is clean and consistent is a non-negotiable first step. Taking the time to establish good governance practices will pay massive dividends down the road. For practical steps on this, you can learn how to improve data quality in our dedicated guide. Getting this right builds a foundation of trust that encourages your entire team to actually use the insights you generate.
Ready to Build Your Data-Driven Future?
Let’s bring this all home. A data strategy isn't some lofty, abstract plan that sits in a forgotten folder. Think of it as your practical, powerful blueprint for real, sustainable growth. We've walked through how it transforms operational chaos into strategic clarity, giving you the power to scale smarter and make decisions with unshakable confidence.
It's time to stop fighting with broken spreadsheets and wrestling data out of siloed systems. For ambitious SMBs, building a business powered by insight isn't a luxury anymore—it's the new standard. Getting a true handle on your performance, from cash flow right down to customer profitability, is what separates the market leaders from everyone else.
A data strategy is what moves you from asking, "what just happened?" to confidently answering, "what's next?". It's the framework that turns raw information into your most valuable competitive edge.
If you’re ready to finally connect the dots in your data and trust your numbers, the next step is simple. Want to automate your reporting and finally trust your data?
Take the first step toward automating your reporting and unlocking the insights you need to grow. Book a free call with our BI consultants today, and let's start mapping out your path to a data-driven future.
Frequently Asked Questions About Data Strategy
Even with a clear roadmap, it's natural for founders and operators to have some practical questions before diving in. We get it. Here are some straightforward answers to the questions we hear most often, designed to clear things up so you can move forward with confidence.
Do we have enough data as a small business?
This is probably the number one question we're asked, and the answer is a definite yes. The magic of a good data strategy isn't about wrestling with massive, terabyte-sized datasets; it’s about being smart with the right data. You'd be surprised what a small amount of clean, focused information can tell you.
For a growing business, this could be as simple as analysing a few hundred sales records to finally see who your most profitable customers really are. Or it might mean tracking a few key metrics from a single spreadsheet to spot where your operations are leaking money. The whole point is to start small, fix a real problem, and then build on that success. Small data, used intelligently, beats big data sitting in a corner every single time.
How much does a data strategy cost?
There's no single price tag on a data strategy, because it's not an off-the-shelf product. A much better question to ask is: what's the return on investment? A solid strategy should pay for itself, and then some, by plugging expensive leaks in your business—think wasted marketing spend, fuzzy cash flow forecasts, or operational bottlenecks that are quietly killing your margins.
At Vizule, we're all about scalable solutions that grow right alongside you. Our approach completely avoids huge upfront costs for complicated software you don't need yet. Instead, we zero in on quick wins using agile, powerful tools like Power BI to deliver real, tangible value early on. This way, the investment is directly tied to business results. Frankly, the cost of doing nothing—sticking with manual reports and gut-feel decisions—is almost always higher.
How long until we see results?
You won't be waiting around for a year, that's for sure. While a complete data transformation is a journey, not an overnight fix, our Map–Model–Mobilise framework is built to deliver actionable insights within the first 30-60 days.
Quick wins are baked right into the process. The first phase is all about tackling your single most urgent business pain point, which often leads to an immediate payoff like an automated sales dashboard that actually works or a cash flow forecast you can finally trust.
This initial momentum delivers immediate value and, just as importantly, builds confidence and excitement across your team. From that strong starting point, we build out, layering on more capabilities and insights. It's about continuous improvement, not some far-off finish line. A well-designed data strategy starts delivering value from day one and just keeps compounding.
Ready to stop guessing and get clear, confident answers about your own data challenges? Vizule can help you move from questions to action. Book your free BI consultation to see how we can help automate your reporting and unlock the insights you need to scale smarter.


