


Data modelling for a data warehouse is the blueprint for your company's data. For founders and operators tired of wrestling with spreadsheets, it’s how you take scattered information from sales, finance, and operations and organise it into a single, reliable source of truth. This structure is the magic that allows tools like Power BI to deliver fast, accurate reports you can actually trust to run your business.
From Data Chaos to Reporting Clarity

If you're running a small or medium-sized business, the daily data grind probably sounds familiar. You're trying to make critical decisions, but the numbers you need are buried in a mess of conflicting Excel sheets, siloed software, and reports that take forever to build by hand.
It’s a common story: your finance report says profit margin is X, but the sales dashboard says it's Y, and no one is sure which number is right. This constant data wrangling doesn't just eat up valuable time; it kills confidence and puts the brakes on growth. When you can’t trust your numbers, you can't confidently answer the most vital questions about your business.
The Before and After of Data Modelling
A well-designed data warehouse model is the bridge from that chaos to total clarity. This isn't just about storing data; it's about creating a logical structure that makes sense for your business and how you measure performance.
Let's break down the tangible shift this creates.
The "Before" Scenario (Data Chaos):
- Manual Reporting Hell: Your team spends hours every week painstakingly pulling data from QuickBooks, your CRM, and maybe Shopify, then mashing it all together in a monstrous Excel file.
- Conflicting Numbers: The sales team's revenue figures never quite match what the finance team has, usually because they pull data at different times or use slightly different business rules.
- Insights on a Delay: Asking a simple question like, "What was our customer lifetime value last quarter?" kicks off a multi-day data-digging expedition.
- Hitting a Wall: As your business grows, the spreadsheets get slower, are riddled with errors, and become a nightmare to manage.
This reactive, firefighting approach keeps you stuck looking in the rearview mirror, trying to piece together what already happened instead of planning your next move.
A data warehouse model isn't a technical luxury; it's the foundational step toward building a predictable, scalable business. It creates a single, reliable source of truth that powers every strategic decision.
The "After" Scenario (Reporting Clarity)
When you implement a structured data model within a data warehouse, you flip the script entirely. You're finally building a system that works for you, not the other way around.
The "After" Scenario (Data Clarity):
- Automated Dashboards: Your key performance indicators (KPIs) are updated automatically in Power BI, giving you a real-time pulse on the health of your business.
- One Source of Truth: Everyone from finance to operations works from the same verified data. The debates over whose numbers are "right" are finally over. This is a crucial step, and you can learn more about establishing a single source of truth for your data in our detailed guide.
- Instant Answers: You can get answers to strategic questions about cash flow, customer segments, or product profitability in minutes using interactive dashboards.
- Intelligent Scaling: Your data infrastructure is built to handle more complexity as you expand, without the whole system grinding to a halt.
This isn't just a niche trend; it's becoming standard practice. The global data warehousing market is projected to hit $30 billion by 2025, growing at an annual rate of 12%. Businesses making this shift report saving hundreds of hours each year on manual data tasks alone.
By turning raw data into structured insights, a data warehouse allows you to move beyond guesswork. It forms the bedrock of true data-driven decision-making and enables much smarter strategies. This shift from chaos to clarity is the single most important step in turning your data into your most valuable asset.
Ready to stop wrestling with spreadsheets and start getting clear, reliable insights? Book your free BI consultation with a Vizule expert today.
Choosing the Right Data Model for Your Business

Picking the right data model is like choosing the foundation for a house. It has to support what you're building today and whatever you've got planned for the future. The best choice hinges entirely on your specific goals for reporting and analysis.
For most SMBs, the main objective is getting a clear view of performance. You need fast answers to questions like, "Which marketing channel brings in our most profitable customers?" or "How is our inventory turnover impacting our cash flow?"
This is exactly where dimensional modeling shines. It's the most common and practical approach for business intelligence because it's built around how you actually think about your business, organising data into numbers and the context behind them.
The Power of Dimensional Modeling
At its core, dimensional modeling is about splitting your data into two types:
- Facts: These are the numbers you care about—the quantifiable metrics you want to measure. Think sales amounts, units sold, or website clicks. They are the "what happened."
- Dimensions: This is the context that gives those numbers meaning. It’s the "who, what, where, and when" behind the metrics, like your customers, products, dates, and store locations.
Structuring your data this way creates a model that feels incredibly intuitive when you pull it into a tool like Power BI. You can easily slice and dice your sales figures (facts) by customer segment or time period (dimensions) without getting tangled up in complex database queries. If you want to dive deeper, we have a detailed guide on what dimensional modeling is.
Within dimensional modeling, you'll hear about two main designs: the Star Schema and the Snowflake Schema.
The real value of a good data model isn't technical elegance; it's how quickly it can deliver a clear, trusted answer to a critical business question. Dimensional modeling is designed specifically for this purpose.
Star vs. Snowflake: A Simple Analogy
Imagine you run a growing e-commerce store. You've got sales data from Shopify, marketing data from Google Ads, and inventory info sitting in a spreadsheet.
- A Star Schema is the most direct route. You’d have one central ‘fact’ table for your sales transactions. This table connects directly to your ‘dimension’ tables for
Product,Customer, andDate. It’s clean, fast, and perfect for the vast majority of SMB reporting needs. - A Snowflake Schema is a slight variation where a dimension gets broken down even further. For instance, your
Productdimension might branch off into separate tables forProduct CategoryandSupplier. This adds more structure but can sometimes make your reports a little more complex.
For most founders and operators, starting with a Star Schema is the quickest way to get valuable insights. It aligns perfectly with the dashboards you need to run your business day-to-day.
To help you decide, here's a quick look at the most common approaches.
Data Modelling Approaches for SMBs at a Glance
A simplified comparison of the most common data modelling techniques to help you understand which is best suited for typical SMB reporting and analytics needs.
| Modelling Approach | Best For | Key Benefit for SMBs | Complexity |
|---|---|---|---|
| Star Schema | Most BI reporting, departmental analytics, performance dashboards. | Speed & Simplicity: Easy to understand and delivers fast query performance for reporting tools. | Low |
| Snowflake Schema | Normalizing large dimensions, reducing data redundancy. | Storage Efficiency: Saves space by breaking down large dimension tables, but can be slightly slower. | Medium |
| Data Vault | Complex data integration from many sources, auditability. | Flexibility & Scalability: Great for integrating messy data, but overkill for most direct reporting needs. | High |
| Hybrid Model | Blending the benefits of multiple approaches for specific use cases. | Custom Solution: Can solve unique problems but requires more expertise to design and maintain. | High |
For a growing SMB, the Star Schema is almost always the right place to start. It gets you the answers you need without getting bogged down in unnecessary complexity.
The rise of cloud-based data warehouses has also made these models more powerful and accessible than ever. The global market for data warehouse as a service (DWaaS) is projected to hit $37.84 billion by 2034, largely because this flexibility allows businesses to adopt dimensional modeling efficiently. By separating data into facts and dimensions, companies can perform complex analytics faster and generate truly meaningful business insights.
While other complex models like Data Vault exist, they are typically a better fit for large enterprises dealing with massive and messy data integration challenges. For an SMB focused on growth and clarity, a well-executed dimensional model is your key to unlocking the power of your data.
A Practical Walk-Through of the Design Process
Building a great data warehouse model doesn't start with code or technical diagrams. It starts with a simple question: "What do we need to know to run the business better?" A successful model is always built around business outcomes first. This is where the blueprint really comes together, turning high-level goals into a concrete plan.
To make this real, let’s walk through the key stages with a scenario familiar to many founders: running a subscription-based service. Let's say you're running a SaaS company and you're flying blind, struggling to connect user activity, subscription payments, and your marketing spend.
Start with the Business Questions (Requirements Gathering)
First things first: forget about tables and schemas. We need to focus entirely on the business. Requirements gathering is just a formal way of saying, "Let's figure out the exact questions we need data to answer." These aren't technical problems; they're commercial ones.
For our SaaS company, the list of burning questions might look like this:
- What's our Monthly Recurring Revenue (MRR), and where is it headed?
- What's our Customer Acquisition Cost (CAC) for each marketing channel?
- Which subscription plan delivers the highest Customer Lifetime Value (LTV)?
- What's our churn rate, and what user behaviors signal a customer is about to leave?
These questions are now the North Star for your entire data modelling data warehouse project. Every decision you make from here should serve the purpose of answering these questions accurately and automatically.
Sketch Out Your Data World (Conceptual & Logical Design)
Once you know the questions, you can start sketching out how your data fits together. This is the conceptual and logical design phase. Think of it like creating a mind map before you write a report—you're just identifying the key business concepts and how they relate.
In our SaaS example, the core pieces of the puzzle are clear:
- Customers: The people signing up.
- Subscriptions: The plans they buy.
- Payments: The money that comes in.
- Marketing Campaigns: How we got them in the door.
The logical design connects these dots. A Customer signs up for a Subscription. That Subscription generates Payments. And that Customer was acquired through a specific Marketing Campaign. This simple sketch outlines the relationships that will eventually become tables, ensuring you can connect the dots between Payments per Customer (LTV) and Marketing Campaign cost (CAC).
This stage is all about creating a simple, business-friendly map of your data. If someone from sales or marketing can look at the diagram and it makes sense to them, you're on the right track.
Build the Technical Blueprint (Physical Design)
With a clear logical map, it’s time for the physical design. This is where the back-of-the-napkin sketch becomes a detailed technical blueprint. You'll define the actual tables, columns, and specific data types (like text, number, or date) and formalise the relationships between them.
This part is more technical, but it's still driven by those initial business questions. For example, your Subscriptions table will need columns for Plan_Type, MRR_Amount, Start_Date, and a Status (like Active/Cancelled). The Payments table would need a Payment_Date and Amount.
This is also where you translate your model into a specific structure, like the Star Schema. Your Payments or Subscriptions data would likely become your central 'fact' tables, surrounded by 'dimension' tables like Customers, Dates, and Marketing_Campaigns.
This physical model is what your reporting tools will plug into. It also dictates how data needs to be moved and shaped to fit. That whole process—designing the data pipelines that feed your model—is a critical next step. To get a better handle on that, you can check out our detailed guide on how to build a data pipeline.
By sticking to this business-first process—from questions to sketch to technical plan—you guarantee the final data warehouse isn't just a cool piece of tech. It becomes a powerful commercial asset that delivers real, actionable insights.
Want to see how this process could solve your unique business challenges? Book a free discovery call with our BI consultants today and let's map out your path to data clarity.
Connecting Your Model to Power BI for Powerful Insights
A perfect data model is just a technical blueprint until it starts powering your business decisions. This is where we bridge the gap between your well-structured data warehouse and the interactive Power BI dashboards that will steer your company. After all the meticulous planning, connecting to a tool like Power BI is where the real value gets unlocked.
This is the moment all that careful work pays off. Concepts we've covered, like 'fact' and 'dimension' tables, aren't just jargon; they are the engine that makes your reports fast and intuitive. They translate directly into the filters and visuals you and your team will interact with every day.
For example, a clean ‘Date’ dimension table is what allows you to slice a sales report by day, week, month, or quarter with a single click—no more clunky, manual grouping in Excel. A ‘Customer’ dimension lets you filter every KPI by a specific client segment to instantly see who your most profitable accounts are.
How Your Data Gets into Power BI
The magic that keeps your dashboards current is an automated process known as ETL (Extract, Transform, Load). Think of it as the data pipeline humming along behind the scenes, making sure Power BI always has the latest, most accurate information from your data warehouse.
This process is what finally frees you and your team from the endless cycle of manual reporting.
- Extract: The process automatically pulls new data from your source systems, like your CRM or accounting software.
- Transform: It then cleans, standardizes, and shapes that raw data to fit the logical structure you designed in your data warehouse model.
- Load: Finally, it loads this polished data into the warehouse, ready for Power BI to pick up and visualize.
Once this workflow is set up, your reports are always on, always accurate, and require zero manual intervention from your team.
Here's a simple look at how these stages fit together within the broader data model design process.
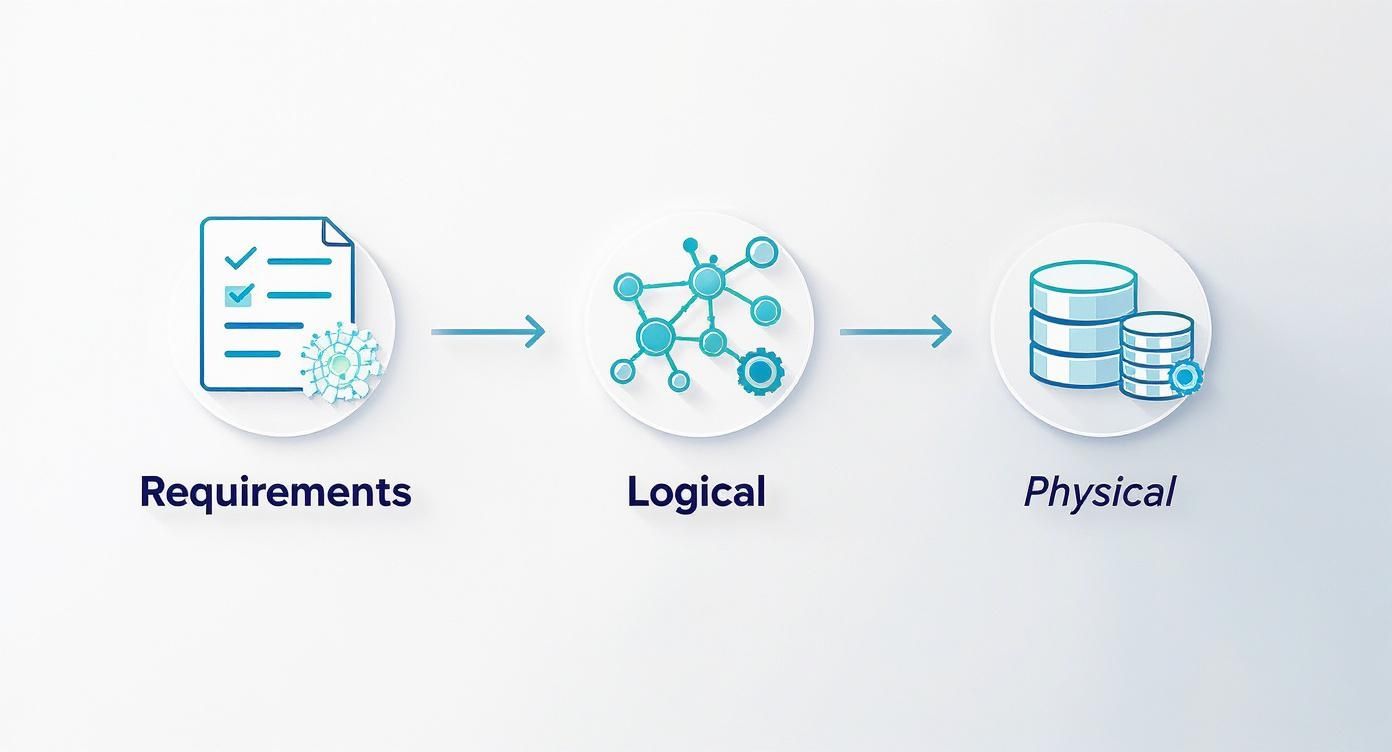
This graphic illustrates the journey: from understanding business needs (Requirements) to sketching out the data relationships (Logical) and finally building the technical foundation (Physical) that your ETL pipeline plugs into.
From Clean Data to Clear KPIs
When Power BI connects to a well-designed data warehouse, the results are immediate. Because the data is already structured, cleaned, and reliable, building insightful reports becomes surprisingly straightforward. You're no longer fighting with the data; you're finally able to explore it.
This is how you get to dashboards that give you a clear, trustworthy view of your most important KPIs—from cash flow and profit margins to customer acquisition costs. That's the ultimate goal of any data modelling data warehouse project.
When your data is clean and your model is solid, you can build powerful visuals that bring your key metrics to life, allowing you to spot trends, identify opportunities, and make informed decisions faster than ever before. It’s all about moving from reacting to old data to proactively shaping your business's future.
The quality of your insights is directly tied to the quality of your data model. A solid foundation in the data warehouse is what makes powerful, interactive reporting in Power BI not just possible, but easy.
By creating this automated reporting stack, you build a scalable system for business intelligence. It’s a huge leap forward from static spreadsheets and endless manual updates. If you're interested in learning more about the tangible benefits, our guide can help you unlock big wins with Power BI for your business.
Common Data Modelling Mistakes to Avoid
Building a solid data warehouse model is a serious investment. Getting it right from the beginning saves you from a world of hurt down the line. Based on our experience pulling founders out of Excel chaos and into automated clarity, we've seen a few common pitfalls derail otherwise promising projects.
Think of this as a friendly gut-check—the things to look out for to make sure your data model becomes a strategic asset, not just a technical headache.
Mistake 1: Building Without a Business Blueprint
The single biggest mistake we see is jumping straight into the technical weeds before anyone has nailed down the business requirements. It’s like an architect designing a house without ever asking the family how many bedrooms they need. You might end up with a beautifully engineered structure, but it’s completely useless for the people who have to live in it.
Here’s how this plays out in the real world:
An e-commerce company pours money into a slick data warehouse to track sales performance. They can slice revenue by product, region, and time of day. Great, right? The problem is, they completely forgot to bring in their marketing spend data from Google Ads and Facebook.
The result? They can see what they sold, but have no way to calculate their Return on Ad Spend (ROAS) or Customer Acquisition Cost (CAC). The entire model is useless for making the most critical marketing budget decisions.
Actionable Tip: Always, always start with the business questions you need to answer. Write them down. A successful data warehouse project is measured by the quality of the business decisions it enables, not its technical elegance.
Mistake 2: Over-Complicating the Design
It’s tempting to try and build a model that answers every possible question you might have in the future. This almost always leads to an overly complex design—a "snowflake" schema so intricate that it’s slow, brittle, and impossible for anyone but its creator to understand. For most businesses, simplicity is speed.
A complex model will also bog down your reporting tools like Power BI or Tableau, leading to dashboards that load at a crawl. That’s a surefire way to kill user adoption. The goal is to build the simplest model that can reliably answer your most important questions today.
You might be over-complicating things if:
- Your model has dozens of interconnected tables for a simple business process.
- Your reports require complex, multi-level queries just to get a basic metric.
- Your team can't explain how a KPI is calculated without a 20-minute technical walkthrough.
Mistake 3: Ignoring Data Quality
Your data model is only as good as the data you feed it. Neglecting data quality is like building that perfect house on a foundation of sand. It’s only a matter of time before it all comes crumbling down. Inconsistent formats, duplicate entries, and missing values will destroy trust in your reporting and lead to terrible, flawed decisions.
Don't just take our word for it. The global data warehousing market is expected to rocket from $34.9 billion in 2024 to $126.8 billion by 2037—that growth is entirely dependent on trusted, actionable data. Proper data modelling is the foundation, with organizations that invest in it seeing up to a 25% reduction in data errors. You can dig into these trends and the impact of effective modelling in this detailed data warehousing market report.
This means you need to establish clear rules for how data is entered and cleaned before it ever hits the warehouse. Our guide to effective data cleansing techniques is a great place to start, offering practical steps to get your data clean, consistent, and ready for analysis.
By sidestepping these common mistakes, you’re setting your business up to build a data warehouse that actually does its job—delivering fast, accurate, and actionable insights that drive real growth.
Want an expert eye to help you avoid these pitfalls and design a data model that delivers from day one? Book your free BI consultation with a Vizule expert today.
Your Data Warehouse Questions Answered
We get it. The world of data warehousing and modelling can feel overwhelming, especially when your main focus is just running the business. Here are straightforward answers to the questions we hear all the time from founders and SMB owners.
How Do I Know if My Business Is Ready for a Data Warehouse?
You’re probably ready when you start feeling those data "growing pains." These are the classic signs that your current setup—which for many is a collection of spreadsheets—is starting to crack under pressure.
If any of this sounds familiar, you're there:
- You're burning hours every week just trying to stitch together reports from your CRM, accounting software like QuickBooks, and sales platforms like Shopify.
- Your team meetings are a mess because everyone shows up with different versions of the "same" report, and nobody's numbers match.
- Answering a simple strategic question turns into a multi-day data-gathering project that pulls people away from their real jobs.
When you're constantly bogged down in spreadsheets and can't get a single, trustworthy view of what’s happening, that's a huge signal it's time to build a scalable data foundation.
What Is the Difference Between a Database and a Data Warehouse?
Think of a normal database, like the one that powers your e-commerce store, as being built for speed and transactions. Its main job is to record things as they happen—a new sale, an updated customer address—quickly and efficiently. It's all about getting data in.
A data warehouse is the complete opposite. It's designed from the ground up for analysis and reporting. It pulls historical data from all those transactional systems and organizes it so you can ask the big, complex questions. The entire purpose of data modelling data warehouse design is to structure that information so you can get meaningful insights out—fast.
Can I Just Use Power BI Without a Data Warehouse?
You absolutely can. For very simple needs, connecting Power BI directly to an Excel file or a single database can work for a while.
But as soon as your data grows or you start pulling from more sources, you'll hit a wall. Performance will tank, and you'll be wrestling with data that doesn't line up. A data warehouse acts as that clean, optimised "single source of truth" that feeds Power BI. It makes your reports fast, consistently accurate, and scalable across all your systems without clunky manual workarounds.
A data warehouse gives Power BI a stable, high-performance engine to run on. It transforms reporting from a fragile, manual task into a reliable, automated asset.
How Much Does It Cost to Build a Data Warehouse Model?
The cost really depends on the complexity of your business, how many data sources you have, and the level of reporting you're aiming for. The good news for SMBs is that modern cloud tools have made this a far more accessible project than the million-dollar price tags of the past.
The main investment is in the expert time for the strategic design, development, and implementation. While a data warehouse is a more structured system, it’s important to understand how it differs from other big data storage solutions. For more context, you can read our guide comparing a data warehouse vs a data lake.
Honestly, the best way to get a real sense of the cost is to have a conversation about your specific goals and challenges.
Ready to stop guessing and start getting clear, reliable insights to scale your business? At Vizule, we specialise in building the data foundations that empower founders and operators to make confident, insight-led decisions.


