


If you're wrestling with clunky Excel files and reports that take an eternity to refresh, the problem probably isn't your data—it's how it's all put together. For founders and SMB operators frustrated with manual reporting, the data model star schema is a battle-tested method for organizing data that dramatically speeds up business intelligence tools like Power BI, making it the ultimate escape from spreadsheet chaos.
Why Your Reports Are Slow and Untrustworthy
Sound familiar? You kick off a report refresh and go make a coffee, hoping it’s done by the time you get back. Or worse, you spend hours stitching together data from different spreadsheets, only to look at the final numbers and just… not trust them.
This is a classic growing pain for businesses. It’s a sure sign you've pushed your current reporting process past its breaking point.
Nine times out of ten, the root cause is the data’s structure. Think of your business data as a messy garage. Every tool, spare part, and can of paint is tossed into one giant, disorganized pile. When you need a specific wrench, you have to dig through everything. It’s slow, it’s frustrating, and you might not even find the right one. That's exactly what happens when you rely on a single, massive "flat file" or spreadsheet for all your reporting.
Organizing Your Data for Speed and Clarity
A data model star schema is like hiring a professional organizer for that messy garage. It doesn't just dump everything in one place. Instead, it creates a clean, logical structure that BI tools are specifically designed to read—and read fast.
This structure is beautifully simple and has two main parts:
- A central workbench (the Fact Table): This is where you keep your core business numbers—the metrics and events you track, like sales figures, quantities sold, or budget forecasts. It's all about the numbers.
- Neatly labeled drawers (the Dimension Tables): These drawers hold all the descriptive context that gives your numbers meaning. Think "who," "what," "where," and "when." Each drawer is a dedicated list for things like your customers, products, store locations, or dates.
So, when you ask a question like, "What were our total sales for Product X in the North region last quarter?" Power BI doesn't have to search the whole messy garage. It goes straight to the workbench for the sales numbers, then instantly pulls the right context from the "Product," "Location," and "Date" drawers.
This clean separation is the secret sauce. It's why reports built on a star schema are incredibly quick and consistently accurate.
The star schema isn't just a technical trick; it's a business strategy. It’s the foundation for a reliable reporting system—a single source of truth that kills the inconsistencies and errors that creep in from manual data wrangling.
Making the move from a flat, chaotic structure to an organized data model star schema is the most critical step you can take toward automated, trustworthy reporting. It’s how you stop fighting with your data and start using it to make decisions with confidence.
Of course, a great model is only as good as the information flowing into it. For more on that, check out our guide on how to improve data quality.
Understanding the Building Blocks of a Star Schema

To really get your head around the star schema, you only need to understand two core parts. Forget the complex jargon; this is just a powerful, common-sense way to organize business data so you can actually use it for reporting.
At its heart, a star schema simply splits your data into two types of tables: one for your numbers and another for all the context behind them. It's this clean separation that makes it so fast and effective for business intelligence.
Let’s break down each piece.
The Fact Table: Your Business Ledger
Picture a simple ledger that records every single important event in your business. Every sale you make, every transaction you process, every single line item on an invoice. That’s your Fact Table.
The Fact Table is the center of your star schema universe. It holds all the quantitative, numerical data about what your business does. It answers the question, "What happened?" by storing the metrics, or facts, that you want to measure, add up, or average out.
Take a sales transaction, for example. The key numbers are things like:
- Quantity sold
- Unit price
- Total sales amount
- Discount applied
These are the pure, unadorned numbers, and they all live in the Fact Table. It's almost always the largest table in your model—we’re talking potentially millions of rows—but it’s also very narrow, designed purely for crunching numbers.
Dimension Tables: The Contextual Story
While the Fact Table gives you the numbers, it doesn’t tell you the story behind them. For that, we need Dimension Tables.
Dimension Tables provide the rich, descriptive context for your facts. They’re the ones answering the crucial "who, what, where, when, and why" questions that turn raw data into something you can actually make decisions with. Think of each Dimension Table as a unique list of business-related items.
Common examples include:
- A Customer Dimension: A list of every customer, along with their name, location, and other demographic details.
- A Product Dimension: A catalog of every product you sell, including its category, size, and brand.
- A Date Dimension: A master calendar providing details like day, month, quarter, and year for every transaction.
- A Location Dimension: A list of all your stores or sales regions.
These tables connect directly to the Fact Table, like spokes on a wheel, which creates that recognizable "star" shape.
A well-structured data model is the difference between a report that takes minutes to build and one that takes hours of manual work. The star schema’s design inherently simplifies queries, which is why it’s the gold standard for Power BI performance.
The star schema is far from a niche concept; it's the dominant data modeling approach used in business intelligence globally. A 2023 survey by Eckerson Group and BARC found that about 38% of organizations use multidimensional models like the star schema, making it one of the most prevalent techniques for structuring analytical data. You can read the full report on data warehouse adoption trends to see how it compares to other methods.
To fully grasp the architecture of a star schema, it's essential to understand fundamental database concepts, such as mastering many-to-many relationships, which form the backbone of dimensional modeling. These principles are fundamental to building a robust and scalable data foundation. For a deeper dive into how these concepts come together, you might be interested in our guide on what is dimensional modeling.
By separating your core numbers from their descriptions, the data model star schema makes your entire reporting system more organized, efficient, and easier for you and your team to understand. It’s the framework that finally lets you trust your data.
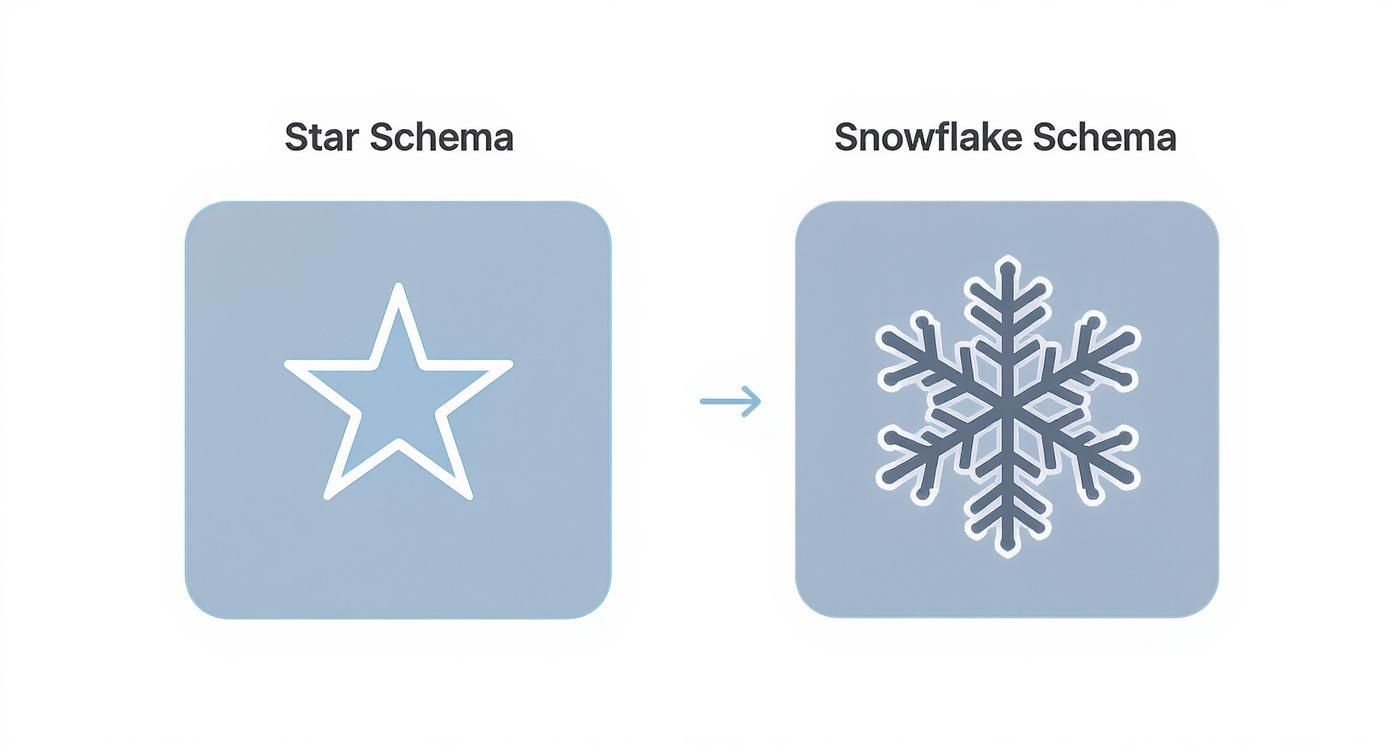
Choosing Between a Star and Snowflake Schema
As you dive into the world of data modeling, you’ll quickly hear about the star schema's close cousin: the snowflake schema. While they sound complex, the difference is actually pretty straightforward, and knowing it is crucial for making the right call for your business.
So, what’s the real distinction, and which model is genuinely better for a growing small or medium-sized business?
The star schema, as we've covered, is all about simplicity and speed. You have your central fact table connected directly to its descriptive dimension tables—clean and efficient. A snowflake schema, on the other hand, takes organization a step further by breaking down those dimension tables into even smaller, related tables.
Think of a "Location" dimension. In a star schema, it’s one simple table with columns for Country, State, and City. A snowflake schema would split this into three separate tables: a City table that links to a State table, which then links to a Country table. This branching structure is what gives it the "snowflake" name.
Star Schema vs Snowflake Schema: A Practical Comparison for SMBs
While the snowflake approach might sound more organized on paper, that extra layering adds a lot of complexity. That complexity directly impacts the two things you probably care about most: speed and how easy the system is to actually use.
Let's break it down with a clear comparison focused on what truly matters to business operators.
| Factor | Star Schema | Snowflake Schema | Vizule's Recommendation for SMBs |
|---|---|---|---|
| Query Performance | Faster. Fewer connections (joins) are needed to get an answer, making reports in Power BI load much quicker. | Slower. Queries have to navigate through multiple linked tables, adding complexity and slowing down report refresh times. | The star schema is the clear winner. Speed is critical for user adoption and making timely decisions. |
| Ease of Use | Simple. The model is intuitive and easy for anyone on your team to understand. You can clearly see how numbers relate to their context. | Complex. The web of interconnected tables can be confusing to navigate, making it harder for your team to build and troubleshoot their own reports. | Star schema's simplicity empowers your team to get answers without needing constant technical help. |
| Maintenance Effort | Lower. With fewer tables and simpler relationships, the model is far easier to manage, update, and scale as your business grows. | Higher. Juggling numerous small tables and their relationships requires more effort and expertise, which means a higher maintenance cost over time. | The star schema reduces your long-term maintenance burden, freeing up valuable time and resources. |
At the end of the day, the choice is clear for most businesses looking to get real value from their data without a massive headache.
Why a Star Schema is Almost Always Right for You
For nearly all SMB reporting and analytics, especially when you're working in a tool like Power BI, the star schema is the superior choice. It’s built from the ground up for performance and clarity. This aligns perfectly with the goal of making data accessible and actionable for business leaders, not just data engineers.
The core principle is simple: always start with a star schema. It delivers the best performance and lowest complexity for 95% of business use cases. Only consider "snowflaking" a dimension if you have a very specific, justifiable reason—like managing a truly massive dimension table with millions of rows (think a customer list for a major retailer) where storage is a primary concern.
For a growing business, the trade-off is obvious. The tiny storage savings you might get from a snowflake schema are rarely worth the significant hit to query speed and the added complexity it creates for your team.
Sticking with a data model star schema ensures your reporting foundation is fast, robust, and easy to understand. For a deeper dive into building these kinds of efficient data structures, our guide to data modeling for a data warehouse offers more practical insights.
How to Design a Star Schema for Financial Reporting
Alright, let's move from theory to action. How can a data model star schema actually turn your manual Profit & Loss (P&L) statements and chaotic cash flow reports into an automated, insightful financial dashboard?
This is a practical blueprint for designing a star schema specifically for your financial data. We'll walk through a common scenario many founders and operators face: building a flexible, driver-based financial model in Power BI.
The goal here is simple: stop wasting hours exporting data and updating spreadsheets. Instead, let's build a reliable reporting engine that grows right alongside your business.
Identifying Your Core Financial Tables
The first step in any data model star schema design is figuring out your central fact table and the essential dimensions that give it context. For financial reporting, this is pretty intuitive because it mirrors how you already think about your numbers.
Your model will revolve around a central Financial Transactions fact table. Think of this as the single, definitive ledger for every single monetary event you need to track.
It should hold all the key numerical values, like:
- Revenue amounts from your sales or invoicing system.
- Expense amounts pulled straight from your accounting software.
- Budget figures you’ve painstakingly planned for each department.
- Forecast projections for the periods ahead.
Once this central fact table is established, we can flesh out the model by identifying the dimensions that provide the "who, what, where, and when" for every number inside it.
The real power of a star schema in finance is its ability to stitch together disparate data sources—like your accounting system, CRM, and budget spreadsheets—into a single, trustworthy source of truth. This is the bedrock for creating holistic financial reports you can actually rely on.
Key Dimensions for Your Financial Model
For a robust financial model, you'll connect your Financial Transactions fact table to several crucial dimension tables. Each one acts like a filter or a slicer in your Power BI reports, letting you analyze performance from all sorts of different angles.
Your essential dimensions will include:
- A Chart of Accounts Dimension: This is your master list of all financial accounts (e.g., "Software Subscriptions," "Salaries," "Consulting Revenue"). It's what lets you roll up individual transactions into high-level P&L categories.
- A Master Date Dimension: This is non-negotiable. A single, shared calendar table is the backbone of all time-based analysis. It’s what allows you to consistently compare performance month-over-month, quarter-over-quarter, or year-over-year.
- A Departments Dimension: This table lists all the business units or cost centers in your organization (e.g., "Sales," "Marketing," "Operations"), making it easy to track departmental spending against its budget.
- A Scenarios Dimension: This powerful little table is what lets you tag every number in your fact table as "Actual," "Budget," or "Forecast." It's the key to building dynamic variance analysis reports in Power BI.
This simple structure immediately organizes your complex financial data into a clean, query-friendly model. If you're looking for a deeper dive into structuring these types of analyses, our guide on how to build financial models provides a comprehensive walkthrough.
The infographic below shows just how elegant and simple the star schema is compared to more complex alternatives.
This visual really highlights how the star schema's direct connections between the central fact table and its dimensions lead to simpler, faster queries—a massive advantage for responsive dashboards.
Defining the Granularity of Your Data
One of the most critical design decisions you'll make is setting the granularity of your fact table. This just means defining what a single row represents. Is it a single invoice line item? A daily summary of sales? A monthly budget figure per department?
For a flexible financial model, you should always aim for the most atomic (or detailed) grain possible. For example, a single row in your Financial Transactions fact table might represent one general ledger entry.
Starting with the most detailed data gives you maximum flexibility down the road. You can always roll it up to a higher level (like monthly summaries) in your reports, but you can never drill down into details that you didn't include from the start.
This principle is why the star schema remains so fundamental to modern business intelligence. It’s a simple structure that just works, perfectly aligning with in-memory analytical engines like Microsoft Power BI to deliver seriously impressive performance.
By carefully designing your fact and dimension tables, you create a scalable foundation that turns financial reporting from a manual chore into a true strategic advantage.
Modern Tools for Automating Your Data Model
Building a solid data model star schema used to be a long, painful, and manual slog. Thankfully, those days are over. Modern tools have completely changed the game, putting powerful data automation right in the hands of small and medium-sized businesses.
For many businesses, this journey kicks off within a tool they might already be using every day: Power BI. The real workhorse here is its built-in data transformation engine, Power Query. Think of it as an automated assembly line for your data. It can take messy spreadsheets, database exports, and other raw files and systematically whip them into the clean, organised fact and dimension tables that form the backbone of your star schema.
The Rise of Intelligent Data Modeling
While Power Query is brilliant for cleaning and shaping data based on rules you set, the truly exciting development is how artificial intelligence is stepping in to help design the schema itself. Instead of having to manually map out every single fact, dimension, and relationship, AI-powered tools can now scan your raw data and intelligently suggest an optimal star schema for you.
This has a massive impact on both speed and accuracy.
- It massively accelerates development: AI can spit out a surprisingly good first draft of your model in minutes, a task that used to take days.
- It cuts down on human error: These algorithms are great at spotting connections and patterns that a person might easily overlook during a manual build.
- It makes data modeling accessible: You no longer need a seasoned data architect to build a sound data foundation.
This approach is exactly how consultancies like Vizule build scalable data foundations for clients in a matter of weeks, not months. We combine the raw automation power of tools like Power Query with the smart suggestions from AI to get you from a pile of raw data to a powerful reporting system faster than ever before.
This isn't just theory; the use of AI here delivers real, tangible results. Recent experiments have shown that AI-assisted schema generation can achieve an impressive average accuracy of around 91%. Even more importantly for business owners, these tools have been found to slash schema design time by over 80%, leading to huge efficiency gains. To learn more, you can read about the impact of AI on enterprise data modeling.
Selecting the Right Automation Stack
Today, the market is full of tools that can help streamline this process. When looking at modern tools, powerful no-code API backend CRUD tools can seriously simplify how you implement and manage your data model, especially if you're trying to connect various cloud applications. The key is to pick a platform that can handle the entire data journey—from pulling the data out and cleaning it up to modeling and visualizing it.
By embracing these modern automation tools, you can sidestep the traditional headaches of data modeling. Instead of getting bogged down in the technical weeds, you can focus on what actually matters: using your data to find insights and drive your business forward. This leap from manual drudgery to automated intelligence is what finally makes a sophisticated data model star schema a practical reality for any growing business.
Ready to Build Your Automated Reporting System?
You’ve got the theory down; understanding the data model star schema is a huge first step. Now, it's time to actually put that knowledge to work. Think of a well-designed data model as the unshakable foundation for an automated reporting system—one that finally frees up your time and gives you the clarity to grow your business with confidence.
This is how you turn data from a frustrating bottleneck into your most powerful strategic asset. When your data is structured correctly, reporting becomes less about the mind-numbing manual drudgery and more about genuine discovery.
From Chaos to Clarity
If you're ready to leave the chaos of spreadsheets behind for good, the journey starts by getting your data structure right. A solid model doesn't just make your reports faster; it makes them trustworthy. It’s the single source of truth that aligns finance, operations, and sales, making sure everyone is finally working from the same numbers.
Don't let data complexity stall your progress any longer. The principles of the star schema were literally designed for simplicity and performance, making them the perfect starting point for any business eager to make insight-led decisions.
The ultimate goal is to build a system that works for you, not the other way around. An automated reporting engine gives you back your most valuable resource—time—by eliminating the hours spent on manual data wrangling and report building.
Taking the First Step
Putting these concepts into action means creating a streamlined process to get data from all your different sources into one structured model. The goal is a repeatable, automated flow that consistently feeds your Power BI dashboards with clean, reliable information. For a practical look at how this all connects, check out our guide on how to build a data pipeline.
This is where theory meets reality. It's time to connect the dots in your data and build the reporting engine your business deserves. Stop wrestling with unreliable spreadsheets and start making decisions with confidence.
Ready to transform your reporting? Book your free BI consultation today and see how Vizule can help you design and implement the automated reporting system that will power your growth.
Have Questions? We've Got Answers.
When you're running a business, the last thing you want to do is get bogged down in technical jargon. You just need reports that work, reports that are fast, and reports you can trust. We get it. Here are some of the most common questions we hear from founders and business leaders when they first start exploring a data model star schema.
Do I Need a Big, Expensive Data Warehouse to Use a Star Schema?
Not at all. This is probably the biggest myth out there. While star schemas are the gold standard for massive corporate data warehouses, the same principles work beautifully right inside a tool like Power BI. You can build an incredibly powerful data model star schema using the data you already have—from Excel files, your accounting software, or your CRM—without ever touching a formal data warehouse.
It all comes down to how you structure the data within your Power BI file. Taking this approach gives you almost all the performance perks on a scale that's a perfect fit for a growing business, minus the hefty price tag and complexity.
How Long Will This Take to Build?
This really depends on how clean your source data is to begin with. But for a specific business area, like building a solid financial reporting model or getting a handle on your sales pipeline, a well-designed star schema can be up and running in a matter of weeks, not months.
The first step is always the same: we identify your core business events (the facts) and all the surrounding context that gives them meaning (the dimensions). With modern tools like Power Query to handle the data cleanup, you can get from a collection of messy spreadsheets to a fully automated, reliable reporting model a lot faster than you might think. That initial time investment pays for itself over and over again by slashing the hours spent manually wrangling reports every single month.
Is This Going to Be Expensive to Set Up and Maintain?
Think of implementing a data model star schema as a one-time investment in getting your foundation right, not a major ongoing expense. For a small or medium-sized business using a tool like Power BI, you're not on the hook for expensive new software licenses or dedicated servers. The main cost is simply the time and expertise to design and build the model correctly the first time around.
The interesting thing is, a well-designed star schema actually reduces your costs in the long run. It simplifies maintenance, makes updating reports a breeze, and cuts down on the "technical debt" that builds up from relying on a tangled mess of fragile spreadsheets. It's a true investment in efficiency.
Once it's built, the model is designed for automation. New data flows in and fits right into the structure with little to no manual work. This frees up your team to spend their time analyzing what the data means, not fighting to get it into a usable format. You end up with a smarter, more scalable, and more cost-effective reporting system that grows right alongside your business.
Want to automate your reporting and finally trust your data? The expert consultants at Vizule can help you design and implement a powerful data model star schema tailored to your business needs, connecting the dots in your data to unlock insight-led decision-making.
Book your free BI consultation and discover how we can help you automate your reporting and unlock the insights hidden in your data.


