


Let's be honest, strategic data management probably sounds like another piece of corporate jargon you don't have time for. But for small and medium-sized business owners, it’s the answer to a question you're already asking: "Why are my reports always out of date, and why can't I trust my numbers?"
It’s not some abstract IT concept—it’s the practical shift from making educated guesses in Excel to making confident, data-backed decisions. It's about finally getting out of spreadsheet chaos and creating one version of the truth everyone in your business can rely on.
Moving From Data Overload to Strategic Advantage

Does this sound familiar? You're drowning in a sea of disconnected Excel files. The financial report from last week doesn't line up with the operational numbers from this week. Your team spends hours—sometimes days—just trying to piece together a basic report, leaving no time left to actually think about what the numbers mean.
This isn't just a minor headache; it's a genuine barrier to scaling your business. It means you're flying blind, making critical decisions on gut instinct and fragmented information. That introduces unnecessary risk right where you need clarity the most.
Why Data Is Your Most Critical Asset
Strategic data management flips this entire situation on its head. It’s not about buying expensive software or hiring an army of data scientists. It's much simpler: start treating your data with the same respect you give your cash flow.
The main goal here is to build a single source of truth. Think of it as one reliable, unified, and always-up-to-date view of your entire business. No more conflicting reports from finance and ops, no more outdated spreadsheets.
When you make this shift, the impact on your bottom line is almost immediate. Imagine a world where:
- Reporting is Automated: Key reports on cash flow, sales pipelines, and project profitability just show up, ready to go. Your team is freed up to focus on strategy, not manual data entry.
- Decisions are Confident: Everyone from finance to operations is working from the same verified numbers. Trust is restored, and meetings become productive again.
- Forecasting is Accurate: With clean, organised historical data, your financial and operational forecasts become incredibly reliable, letting you plan for the future with confidence.
This isn't just a trend; it's a fundamental change in how successful businesses operate. The global market for enterprise data management was valued at around USD 101.04 billion and is expected to soar to USD 243.48 billion by 2032. That’s a massive signal that businesses everywhere are getting serious about organising their data.
The Real-World Impact on Your Business
The table below breaks down the practical difference between the "before" and "after" states of managing your company's data.
The Shift from Manual Reporting to Strategic Management
| Challenge | Manual 'Excel Hell' Approach | Strategic Data Management Solution |
|---|---|---|
| Data Inconsistency | Finance and Ops reports never match. Hours are wasted arguing over which numbers are right. | A single, validated data source ensures everyone works from the same playbook. |
| Time-Consuming Reports | Key staff spend 10-15 hours a week manually pulling and cleaning data for basic reports. | Reports are automated. Dashboards in Power BI are live. Your team's time is freed up for analysis. |
| Reactive Decisions | Problems are only discovered after they show up in last month's numbers. | Real-time dashboards spot trends as they happen, allowing for proactive adjustments. |
| Unreliable Forecasts | Forecasting is more guesswork than science, based on messy historical data. | Clean, structured data leads to accurate financial and operational forecasting models. |
| No Cross-Functional Insight | It's nearly impossible to connect marketing spend to actual sales profitability. | Data from different departments is integrated, revealing powerful cause-and-effect insights. |
This table highlights a clear path away from frustration and toward control. For SMBs, the benefits are incredibly tangible. The real power of data analytics for small business is its ability to connect the dots. You can finally answer crucial questions like, "Which marketing channel is actually bringing us our most profitable customers?" or "Are our project margins secretly shrinking?"
By creating a single source of truth, you stop spending time arguing about which numbers are correct and start using that time to decide on the best course of action. It’s the foundation for scaling smart.
At the end of the day, strategic data management is about taking back control. It gives founders and operators the clarity to move beyond just putting out fires and start proactively steering their business toward sustainable, predictable growth—all backed by data you can finally trust.
The Four Pillars of an Effective Data Strategy
When founders hear "data strategy," their minds often jump to a massive IT project that costs a fortune and takes forever to show any real value. But that’s a misconception. A smart strategy isn't about the tech; it's about building a simple, repeatable system to turn raw data into better business decisions.
Think of it like building a house. You wouldn't just start throwing up walls without a blueprint. A solid strategic data management framework rests on four essential pillars. Each one builds on the last to create something reliable, functional, and ready for the future.
1. Data Governance: The Blueprint
Before a single shovel hits the dirt, an architect drafts a detailed blueprint. It defines everything—room dimensions, electrical wiring, plumbing—so that everyone on the job is working from the same plan.
Data governance is the blueprint for your data. It’s a practical rulebook that standardises your most important metrics and definitions across the entire company.
It tackles simple but mission-critical questions:
- What exactly makes someone a "new lead" in our CRM?
- How do we calculate "customer lifetime value," and is every department using the same formula?
- Who can see sensitive financial reports, and who is restricted?
Without these ground rules, you get data chaos. Your teams show up to meetings with conflicting numbers, and you spend more time debating whose report is "right" than actually using the insights to move forward.
Governance isn't about adding red tape; it's about creating trust. It ensures that when you see a KPI on a dashboard, you know precisely what it means and can count on it.
2. Data Integration: The Foundation
With the blueprint approved, the next step is pouring a solid foundation. You can have the best plans in the world, but a house built on shaky ground will eventually crack. Your data is no different.
Data integration is your foundation. This is the process of connecting all your disparate data sources—your CRM, accounting software, marketing platforms, and operational tools—and pulling that information into one central, stable location. For most SMBs, this isn't a huge, expensive data warehouse; it's often a lean, cloud-based system built for efficiency.
This step is absolutely crucial because it demolishes data silos. Your financial data from Xero no longer lives on an island, separate from your sales data in HubSpot. By bringing them together, you create a single, unified view of the business to build upon.
3. Data Modelling and BI: The Framework
Once the foundation is set, you can start framing the house. The walls, beams, and roof give the structure its shape and purpose.
This is where data modelling and business intelligence (BI) come into play. Using a powerful tool like Power BI, we take your integrated data and structure it to answer specific, high-value business questions. This isn't just about making pretty charts. It's about shaping the data to reveal cause-and-effect relationships.
We transform raw tables of sales transactions and ad clicks into a clear financial model that shows you which marketing campaigns are actually driving your most profitable customers. The output is a set of clean, logical data models that become the engine for your dashboards.
4. Automation and Analytics: The Smart Home
The final pillar is where you turn your well-built house into a smart home—where the lights turn on automatically and the thermostat adjusts itself. This is where the magic happens.
Automation and analytics is that finished, intelligent system. At this stage, your reports and dashboards refresh automatically on a schedule, with zero manual effort. No more exporting CSVs. No more copy-pasting into spreadsheets.
Your team gets instant access to fresh insights, freeing them up to focus on strategy and analysis instead of tedious data prep. This final pillar is what turns your data from a backward-looking chore into a forward-looking asset. Of course, to build an intelligent system, you need clean, reliable inputs. Understanding the importance of data quality for a competitive edge is a great place to start.
Each pillar builds upon the last, creating a logical system that can grow with your business. For a deeper dive into how these elements come together, check out our complete guide on building a successful data management strategy. The journey from data chaos to clarity starts here.
Your Phased Roadmap to Better Data Management
Getting from theory to practice can feel like the toughest part. I see it all the time: business owners know they need to get their data organised, but they put it off. They’re worried about starting some massive, disruptive project that will suck up time and money they don’t have.
That's precisely why a phased approach isn't just a good idea—it's the only way to go for most SMBs.
Instead of trying to solve every data problem at once, a smart strategic data management plan starts with a single, high-impact win. Get that one thing right, and you’ll build momentum, show immediate value, and get the team on board for what comes next. It’s all about taking small, deliberate steps that deliver real results, fast.
The process below lays out the core pillars that guide this journey, from setting the ground rules to getting automated insights.
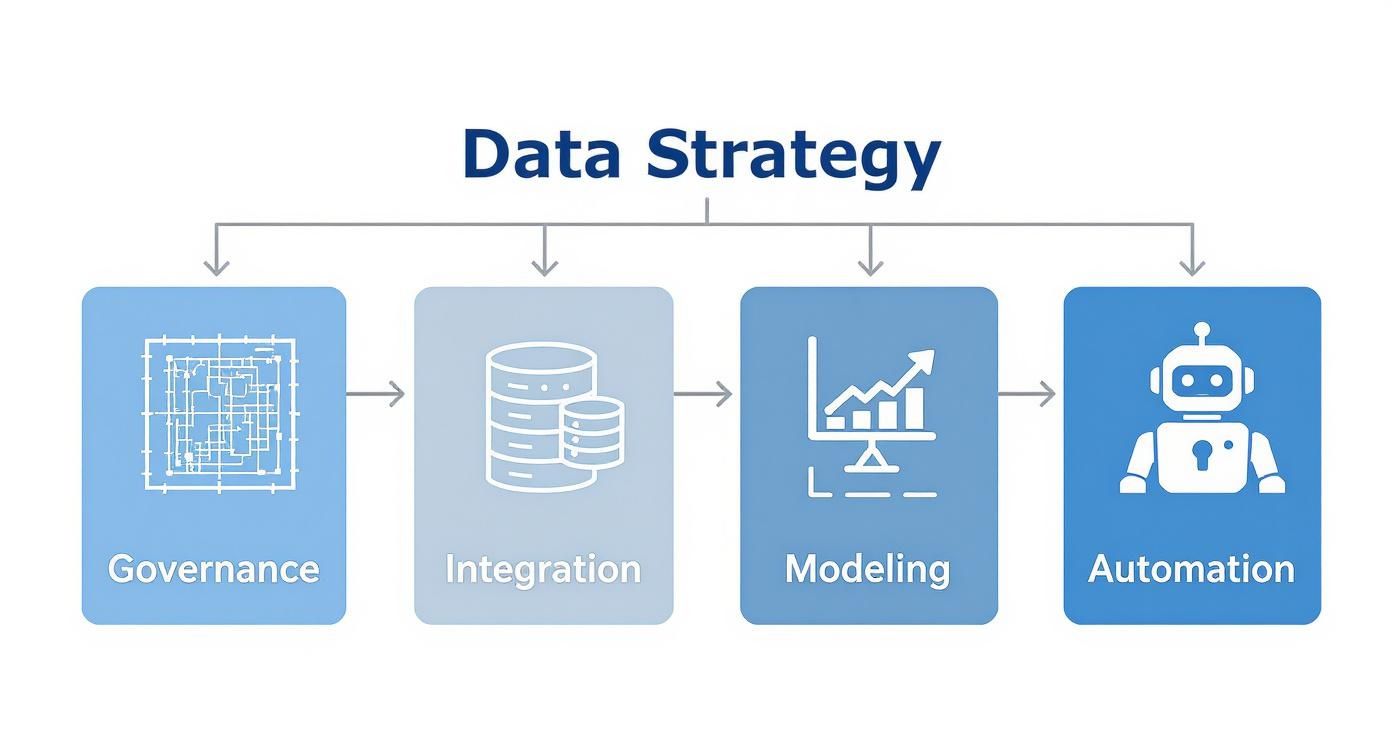
This visual breaks down how a structured strategy moves from a solid blueprint (governance) all the way to real-time insights (automation). Let’s unpack how you can apply this in practical, bite-sized phases.
Phase 1: The Foundation
First things first: find your single biggest reporting headache. Where does your team waste the most time? Which report causes the most arguments or just feels like a wild guess?
For a lot of businesses, that pain point is cash flow forecasting, sales pipeline analysis, or figuring out project profitability.
Once you’ve picked one, the goal is to solve just that one problem. This foundational phase looks like this:
- Connect 2-3 Core Data Sources: We’ll hook up the essential systems, like your accounting software (Xero), your CRM (HubSpot), and maybe a critical spreadsheet you live in.
- Build One Automated Report: Using a tool like Power BI, we build a single, automated dashboard to replace that manual nightmare. It's designed to be clean, accurate, and always up-to-date.
- Deliver Immediate Value: The result is a quick win. Your finance team might save 10 hours a month building reports, or the sales team gets a live look at their pipeline for the very first time. This tangible success proves the concept.
This initial phase is all about demonstrating ROI. By solving a real, nagging problem quickly, you create champions for the data initiative across the business.
Phase 2: The Expansion
With a win under your belt and your team seeing the benefits firsthand, it’s time to expand. This second phase builds on that solid foundation, widening the scope of your data ecosystem without getting bogged down.
This is where the momentum really starts to build. We’ll start integrating more data sources and developing new dashboards for other departments. For example, we might connect marketing analytics tools or inventory management systems to give you a more complete picture of performance.
It's also the perfect time to introduce some basic data governance rules. Now that more people are using the system, we can define key metrics (like "customer acquisition cost") to make sure everyone is singing from the same hymn sheet. The focus stays on practical application, not creating a bunch of red tape.
For a detailed guide on how to structure this entire process, check out our comprehensive data strategy roadmap.
Phase 3: The Scaling
As your business grows, your data needs will get more complex. The final phase is all about evolving your setup into a robust, company-wide asset that can handle sophisticated analytics and empower your team to find their own answers.
This phase is about future-proofing your data infrastructure. We might help you build out a more structured data warehouse to handle bigger data volumes and complexity. We’ll also implement stricter data quality checks and automated alerts to catch problems before they ever hit your reports.
The ultimate goal here is to get your team to a place of self-service analytics. This means giving key people the tools and training to ask their own questions of the data, discover new insights, and build their own reports without having to go through a central team. This is where strategic data management stops being a project and becomes part of your company culture.
This phased approach makes the entire process manageable and delivers value at every step. The table below summarises how it works in practice.
Practical SMB Data Roadmap
| Phase | Key Actions | Primary Outcome | Example Vizule Solution |
|---|---|---|---|
| Phase 1: Foundation |
- Identify one major reporting pain point.
- Connect 2-3 core systems (e.g., Xero, HubSpot).
- Build one automated dashboard in Power BI. | A quick, tangible win that saves time and proves the value of the investment. | An automated cash flow reporting model that saves the finance team 10 hours per month. |
| Phase 2: Expansion | - Integrate additional data sources (e.g., marketing, operations).
- Develop 2-3 new dashboards for other departments.
- Introduce basic data governance and metric definitions. | A more holistic business view and consistent reporting across teams. | A unified sales and marketing dashboard showing lead-to-customer conversion rates. |
| Phase 3: Scaling | - Implement a structured data warehouse.
- Establish automated data quality checks.
- Train key staff for self-service analytics. | A future-proof data asset that empowers the entire organisation to make data-driven decisions. | A self-service analytics environment where managers can build their own custom reports. |
This step-by-step method removes the guesswork and risk, turning a daunting initiative into a series of achievable milestones.
And this isn't just a niche trend. The enterprise data management market in the United States alone is projected to hit USD 20.7 billion and nearly double to USD 37.4 billion by 2033, growing at a CAGR of around 7.7%. This boom is driven by businesses just like yours adopting scalable strategies to get a better handle on their forecasting and planning. (Source: IMARC Group)
How to Sidestep Common Data Project Pitfalls
Kicking off a data initiative can feel like trying to cross a minefield. Many well-intentioned projects fail before they even get going, not because of a lack of ambition, but because of a few common, completely avoidable mistakes. As consultants, we've guided countless SMBs around these patterns.
Knowing what these pitfalls are is the first step. By seeing them coming, you can save a shocking amount of time, money, and frustration, making sure your investment delivers real value from day one.
The "Boil the Ocean" Approach
This is the classic mistake. A founder gets fed up with messy, disconnected spreadsheets and declares, "We need to fix all our data!" The sentiment is admirable, but the execution is a recipe for disaster. It results in a massive, sprawling project that takes months to deliver anything, loses momentum fast, and burns everyone out.
The fix is simple: start small with a single, high-impact problem. Don't try to boil the ocean; just make one perfect cup of tea.
- Find Your Biggest Headache: Is it the weekly cash flow report that takes 10 hours to build? Or the sales forecast that's basically a wild guess?
- Target a Quick Win: Isolate that one process. Focus all your initial energy on automating just that.
- Build Momentum: When you deliver a fast, tangible result, you prove the project's value and get everyone excited for what’s next.
This approach creates a positive feedback loop. Sceptics become champions, and you get the buy-in you need to tackle bigger challenges.
The "Tool-First" Trap
Next up is the siren song of shiny new software. A business owner hears about a slick BI tool, drops thousands on licences, and only then starts to wonder what to do with it. This "tool-first" mindset almost always backfires because it puts the cart before the horse. Technology is a powerful enabler, but it's not a strategy.
A tool without a clear business problem to solve is just an expensive icon on your desktop. The focus should always be on the 'why' before the 'what'.
To dodge this trap, flip your thinking:
- Define the Business Question First: What specific answer do you need? (e.g., "Which marketing channels are bringing in our most profitable customers?")
- Figure Out the Data You Need: What information is required to answer that question? (e.g., ad spend from Google Ads, sales data from your CRM).
- Then, and Only Then, Choose the Tool: Now you can pick the technology best suited to pull that data together and give you the answer.
Neglecting Team Adoption
You can build the most elegant, insightful dashboard in the world, but if nobody uses it, its value is exactly zero. This happens more often than you'd think. A perfect system gets rolled out with little to no input from the very people who are supposed to use it every day.
The team feels like this new thing is being forced on them, they don't get how it helps, and they quickly retreat to their old, comfortable spreadsheets.
Success isn't measured by deployment; it's measured by adoption. To make sure your team actually embraces the new system, you have to bring them along for the ride.
- Co-create the Solution: Ask your team about their biggest reporting frustrations. Involve them in the design process so the final dashboard answers their questions.
- Provide Hands-On Training: Don’t just email a link and hope for the best. Run interactive training sessions that show them exactly how the new reports will make their lives easier.
- Make it Part of the Culture: Weave the dashboards into your regular meetings. When leadership consistently uses the new system to make decisions, everyone else will follow.
Ignoring Data Quality
And finally, the old classic: "garbage in, garbage out." This is still one of the biggest project killers. Businesses get so excited about seeing a finished dashboard that they rush past the critical work of cleaning and validating their source data. The result is reports riddled with errors, inconsistencies, and duplicates.
The moment your team spots a few obvious mistakes, they lose trust in the entire system. And once that trust is gone, it's incredibly hard to win back. A little upfront effort on data quality saves a world of pain later. To learn more, check out our guide on how to improve data quality for some practical steps.
By sidestepping these common pitfalls, you can turn your data initiative from a risky bet into a strategic investment that pays off for years to come.
Seeing Strategic Data Management in Action
All the theory is great, but seeing the real-world impact of strategic data management is what really makes it click. When a business finally moves from data chaos to genuine clarity, the results aren't just small wins. They're fundamental shifts in how the company runs and competes.
To bring this home, let’s walk through a couple of real-world scenarios that show how these principles turn into tangible business outcomes for SMBs.
From Disconnected Channels to Profitable Growth
Scenario 1: The E-commerce Founder
We worked with an ambitious e-commerce brand that was growing fast, but its founder was essentially flying blind. Their most important data was stuck in different systems that couldn’t speak to each other:
- Shopify held all the sales and transaction data.
- Google Analytics had all the website behaviour and ad campaign metrics.
- A messy spreadsheet was the only thing tracking inventory and COGS.
The founder was burning hours every week manually glueing this information together. They could never get a clear, trustworthy picture. Critical questions like, "What's our real customer lifetime value?" or "Which ad campaigns are actually profitable?" were impossible to answer with any certainty.
By putting a real data strategy in place, we pulled these three sources into a single, automated Power BI dashboard. For the first time, the founder could see the entire customer journey in one view.
The Outcome: They almost immediately discovered that their highest lifetime value customers were coming from a specific ad channel they had been underfunding. By shifting their ad spend based on this one insight, they boosted overall profitability by 20% in a single quarter.
From Manual Reporting to Real-Time Decisions
Scenario 2: The Service-Based Operations Manager
An operations manager at a fast-growing consultancy was drowning in manual work. Every single month, she spent over 20 hours pulling data from employee timesheets and the company’s accounting software just to build project profitability reports.
The whole process was slow, riddled with potential errors, and the final report was always stale by the time it reached leadership. This meant they were making crucial staffing and project decisions based on old, unreliable information.
We built an automated pipeline that connected their timesheet software directly to their accounting platform. Now, the data flows into a live Power BI model that calculates project margins in real time.
The Outcome: Those 20 hours of manual work every month? Gone. More importantly, the leadership team now has instant visibility into which projects are making money and which are draining resources, letting them make immediate, data-backed staffing calls.
These stories show that the point of strategic data management isn't the technology itself—it's the transformation. It’s about saving time, boosting profits, and making smarter, faster decisions. This intense focus on operational efficiency is driving massive market growth; the industrial data management market, valued at USD 94.07 billion, is projected to shoot past USD 213.20 billion by 2030. You can dig deeper into this trend and its impact on industrial automation on MarketsandMarkets.com.
These kinds of transformations are powered by well-designed dashboards. For some inspiration, check out these powerful business intelligence dashboard examples that show how to turn raw numbers into winning strategy.
From Blueprint to Bottom Line: Your Next Step
We've covered a lot, but the takeaway is surprisingly simple. Strategic data management isn’t some abstract tech goal for the Fortune 500. It's the answer to the daily frustrations you're already facing.
It’s the roadmap that takes you from wrestling with messy spreadsheets to making confident decisions backed by solid numbers. This is about gaining clarity, control, and a genuine advantage over the competition.
Getting started is far more straightforward than you might think. You don't need to rip and replace everything at once. The framework we've laid out is a practical blueprint, designed to deliver immediate value without blowing up your budget or burning out your team.
It all starts by tackling one specific, nagging problem. You solve it, prove the ROI, and use that win to build momentum.
The goal is to create that elusive single source of truth that finally gets your finance and operations teams on the same page. This is how you shift from constantly putting out fires to looking ahead and shaping your strategy. It’s the only way to make insight-led decisions.
The next step isn't about buying another piece of software. It's about applying these ideas to your unique business challenges and building a roadmap that delivers quick wins while setting you up to scale.
If you’re ready to stop wasting hours on manual reports and start trusting the numbers you use to run your business, the path forward is clear. It begins with a simple conversation about where you are today and, more importantly, where you want to go.
Want to automate your reporting and finally trust your data? Let's connect the dots and build the automated reporting your business deserves.
Book Your Free BI Consultation
Frequently Asked Questions
When you start thinking seriously about strategic data management, a few practical questions always come up. Here are the honest answers to the questions we hear most often from founders and operators.
How Much Does This Actually Cost?
This is always the first question, and for good reason. The answer is, it's not some huge, scary, one-off project cost. We never approach it that way. Instead, we break it down into manageable phases, so you don't need a massive upfront budget just to get started.
Our first move is always to find a "quick win"—a single, high-impact problem we can solve that delivers an immediate and obvious return. Think about that one painful weekly report that takes hours to build, or the simple cash flow dashboard you’ve always wanted. We start there to prove the value, fast. The focus is on the value you get back, not just the initial spend.
Do I Need to Hire a Full-Time Data Analyst?
For most small and medium-sized businesses, the answer is a firm no. A good, experienced data analyst is a major investment, often costing £60,000+ a year before you even factor in benefits. Frankly, most businesses don't need someone for 40 hours a week, especially at the start.
Working with a consultancy like ours is a much smarter, more flexible way to go. You get access to a whole team of specialists—BI developers, financial modellers, data strategists—exactly when you need them, without the overhead of another full-time salary. It’s about getting the right expertise for the job, on demand.
How Long Until I See Results?
You won’t be waiting months to see a payoff. While a full, company-wide data system is a journey that grows with you, we are obsessed with speed-to-value.
Our goal in the first phase is to deliver an immediate win. Something tangible that takes a real pain point away and shows you what’s possible with a fully automated system.
Those initial, high-impact solutions, like an automated sales pipeline report or a dynamic cash flow dashboard in Power BI, can often be designed, built, and in your hands in just a few weeks. This way, you see a return on your investment right away, which builds the confidence and momentum to tackle the next challenge.
Ready to finally move past messy spreadsheets and build a reporting system you can actually trust? The team at Vizule can help you map out a practical plan that delivers results, quickly.


