


As a founder, every decision you make is a brick in your company's foundation. The question is, are those bricks made of solid data, or are they built on risky gut feelings?
Analytics in banking isn't about getting lost in a sea of numbers. It’s about taking the raw financial data from your everyday tools—like your bank statements, Xero, or Stripe—and turning it into a clear, actionable roadmap for growth. This guide will show you how to move from frustrating manual reports to an automated system that gives you the confidence to scale smart.
From Guesswork to Growth: Why Analytics Matters
In today's market, guesswork is a luxury you can't afford. When you're making critical financial decisions—like managing cash flow or figuring out which customers are actually profitable—relying on dusty spreadsheets or gut instinct is like driving blind. This is where a structured approach to analytics gives you an almost unfair advantage.
It's the difference between patching up last month's problems and proactively building next quarter's success. Imagine confidently forecasting your cash position, spotting potential fraud before it hits your bottom line, or pinpointing your most valuable customers with just a few clicks. That's the power analytics hands you.
For a founder, this isn't some complex, enterprise-level behemoth. It's your key to survival and smart scaling. It’s about creating a system that pulls trustworthy insights directly from your financial data, establishing a single source of truth that gets your whole team pulling in the same direction. Making the jump from manual reporting in Excel to automated intelligence is fundamental to building a resilient, data-driven business. You can dive deeper into this concept in our guide to data-driven decision-making.
The Shift to Insight-Led Operations
This move towards analytics isn't just a trend; it's a fundamental change in how modern businesses operate. The global market for data analytics in banking was pegged at $11.55 billion in 2024. Projections show it rocketing to an incredible $87.4 billion by 2035, growing at a clip of over 20% each year.
That explosive growth tells one simple story: companies that learn to master their financial data are the ones leaving everyone else behind. Read the full research about these market trends.
This guide is designed to show you exactly how to turn scattered financial data into your most powerful strategic asset. We'll walk through how you can make the kind of confident, insight-led decisions that fuel real, sustainable growth.
The Four Levels of Financial Insight
To get real value from your financial data, you have to ask the right questions in the right order. Think of it as a journey with four distinct stages. Most businesses get stuck at stage one, only ever looking at what has already happened.
The real growth, however, comes from moving through all four. It's the difference between guessing and knowing.
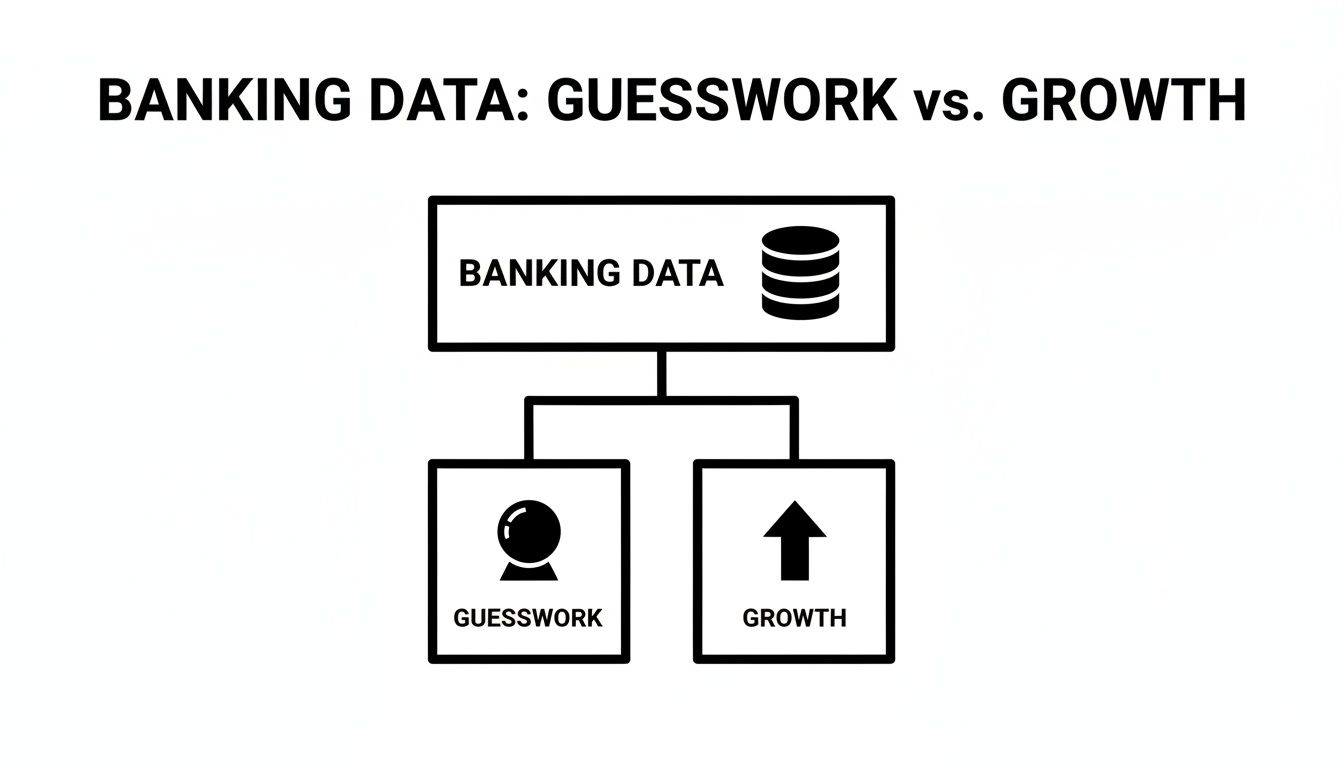
This visual nails a crucial point: the same raw data can either fuel reactive decisions (guesswork) or power strategic, forward-looking actions (growth). Having a system to unlock the right level of insight is what makes all the difference.
Level 1: Descriptive Analytics — What Happened
This is ground zero. Descriptive analytics sifts through your historical data to give you a clear summary of past events. It’s the first essential step away from gut-feel decisions toward having concrete numbers to back you up.
Your monthly P&L statement, a sales report from last quarter, or a KPI dashboard showing website traffic are all perfect examples. It answers the fundamental question: "What happened?"
Level 2: Diagnostic Analytics — Why It Happened
Once you know what happened, the next question is why. Diagnostic analytics helps you drill down into the data to find the root causes behind the numbers. This is where you connect the dots between your actions and their outcomes.
For example, if revenue dipped last month (that's descriptive), diagnostic analytics could show you that a major client paused their contract or that your latest marketing campaign tanked. It digs deeper, answering: "Why did it happen?"
Level 3: Predictive Analytics — What Will Happen
This is where analytics starts to feel like a superpower. Predictive analytics uses your historical data, statistical models, and machine learning to forecast what's likely to happen next. Instead of just reacting to the past, you can start preparing for the future.
A classic example is a cash flow forecasting model that projects your bank balance six months from now, based on current sales trends and expense rates. It answers the one question every founder is asking: "What is likely to happen next?"
Level 4: Prescriptive Analytics — What Should We Do
The final and most powerful level of insight goes beyond just making a prediction. Prescriptive analytics recommends specific actions you can take to achieve a desired outcome. It pulls together the "what," "why," and "what will happen" to show you the best path forward.
Imagine your predictive model forecasts a cash shortfall in three months. Prescriptive analytics could then run simulations and recommend the optimal move—like offering a 5% early-payment discount to specific clients to close the gap most efficiently. It answers: "What is the best course of action?"
To help clarify how these stages work together, here’s a quick breakdown of each type of analytics, the core question it answers, and what it looks like for a typical small business.
The Four Types of Financial Analytics for Your Business
| Analytics Type | Question It Answers | Practical SMB Example |
|---|---|---|
| Descriptive | "What happened?" | A dashboard showing $50,000 in total sales last month. |
| Diagnostic | "Why did it happen?" | Drilling down to see that 70% of sales came from a new product launch. |
| Predictive | "What will happen?" | Forecasting next month’s sales to be $55,000 based on current trends. |
| Prescriptive | "What should we do?" | Recommending a 10% ad spend increase on the new product to hit a $60,000 target. |
Understanding these stages is the first step toward building a truly intelligent operation. Each level builds on the last, transforming your data from a simple historical record into a strategic guide for future growth.
You can learn more about applying these concepts in our detailed breakdown of descriptive, predictive, and prescriptive analytics.
Practical Ways to Use Banking Analytics
Let's be honest, "analytics" can sound like a buzzword reserved for big players with massive IT departments. But for founders, it’s a hands-on tool that makes a real impact on the bottom line. The goal isn't just creating more reports; it's about turning core financial functions into strategic assets.
You can stop drowning in spreadsheets and finally solve painful, recurring problems like unreliable forecasts and endless manual data entry.
Imagine seeing everything you need on a single, unified Power BI dashboard—your one source of truth.
This isn’t a far-off fantasy. It's exactly what modern business intelligence makes possible for small and medium-sized businesses today. Let’s jump into the real-world applications where analytics truly delivers.
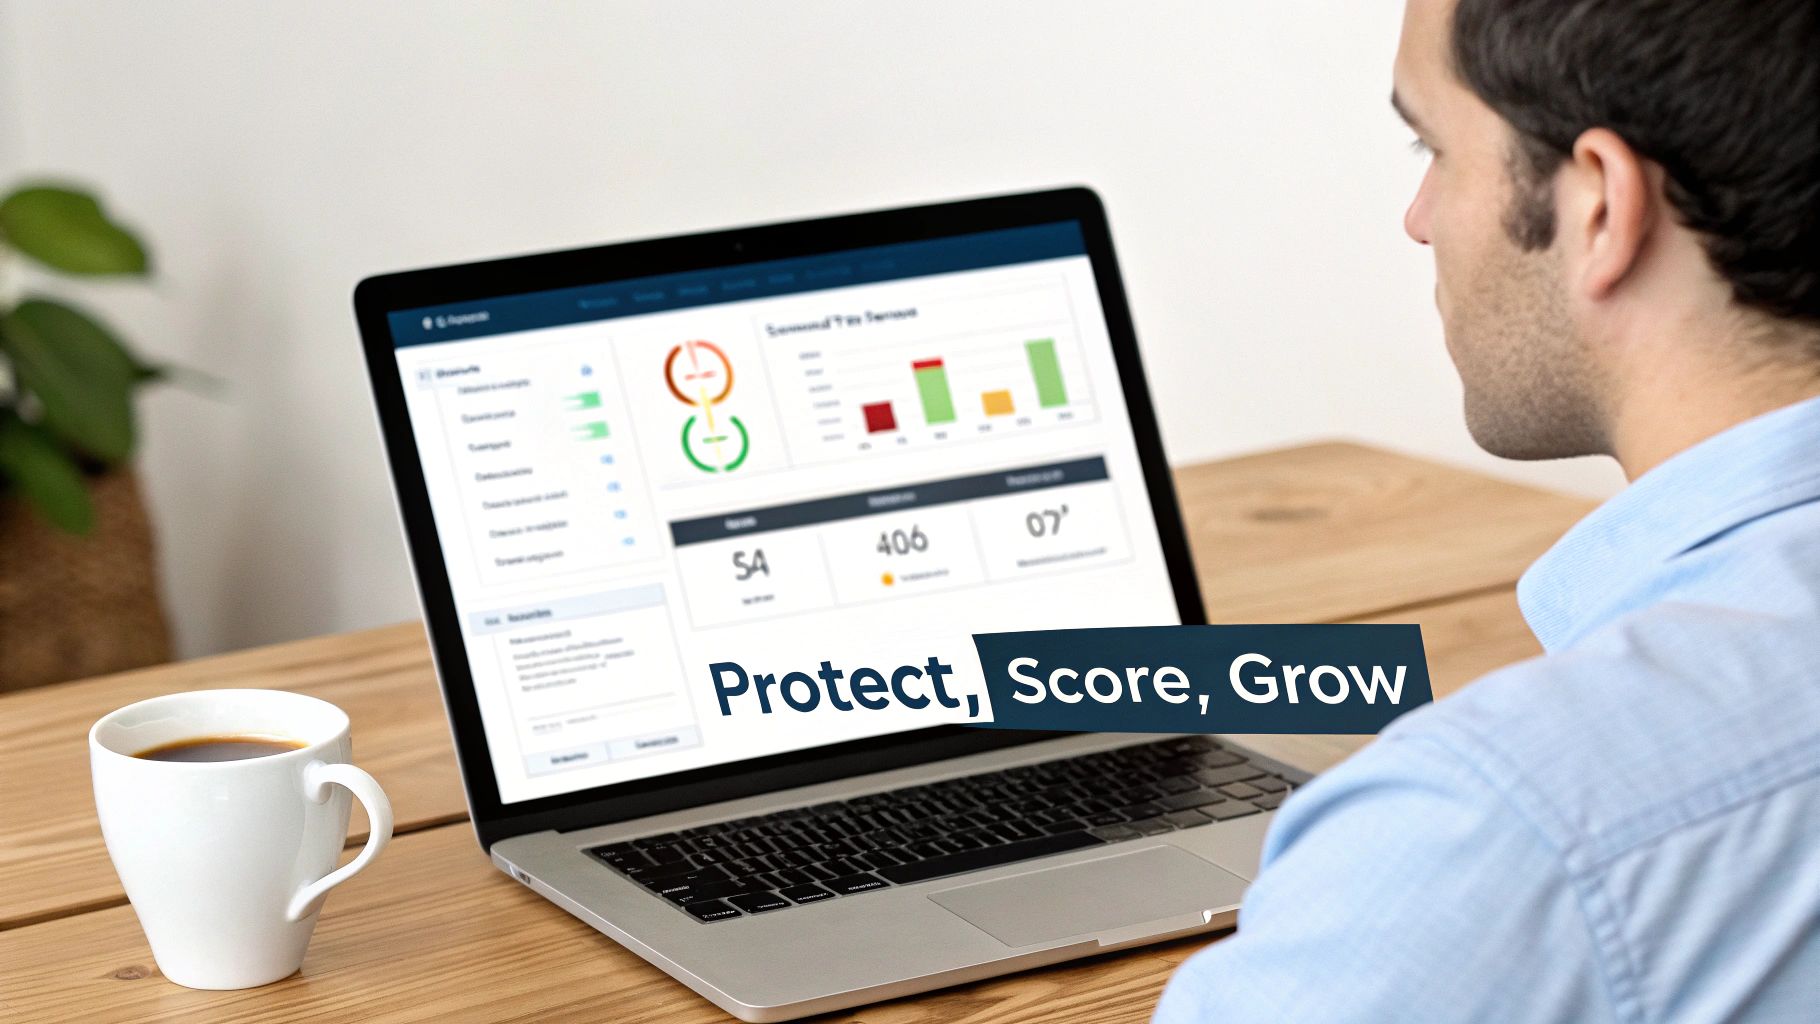
Smarter Fraud Detection
For any founder, a single major fraudulent transaction or a wave of chargebacks can be devastating. Traditional fraud reviews are reactive, catching the problem long after the money is gone.
This is where a proactive, analytics-driven approach changes the game.
Smart models can analyze transaction patterns in real-time, instantly flagging strange activity that even a seasoned professional might miss. A critical application here involves sophisticated methods like machine learning fraud detection to protect your assets and your customers. This means you can identify and stop suspicious payments before they clear, saving you from huge losses and operational chaos.
Better Credit Risk Scoring
Deciding whether to extend credit to a new customer can feel like a high-stakes guessing game. Go too easy, and you risk drowning in bad debt. Be too strict, and you choke off valuable growth.
Analytics takes the guesswork out of the equation. By analyzing historical payment data, customer profiles, and other key variables, you can build a dynamic credit scoring model that works for your business.
This allows you to:
- Quantify risk for every new customer with a simple, reliable score.
- Set smart credit limits that protect your cash flow while encouraging sales.
- Spot early warning signs of potential defaults, giving you time to act.
Deeper Customer Analytics
Do you really know who your most profitable customers are? It’s often not the ones with the biggest invoices. Customer analytics helps you dig deeper than surface-level revenue to understand true profitability. It does this by factoring in everything from customer acquisition costs to support tickets and lifetime value.
Armed with this clarity, you can focus your time and money where they will have the greatest impact. Maybe that means launching a targeted retention campaign for your high-value clients or tweaking your marketing to attract more customers just like them.
The big data analytics market is projected to jump from $307.54 billion in 2023 to $745.18 billion by 2030. This boom is fueled by five key applications: customer analytics, feedback management, fraud detection (which can slash losses by 40%), risk assessment, and predictive credit scoring that approves loans up to 30% faster. The takeaway is clear: businesses that integrate these technologies can boost their profitability by 15-20% and forge much stronger client relationships.
Dynamic Pricing and Profitability
If you're using a static, "set it and forget it" pricing model, you're leaving money on the table.
Analytics allows you to get much more dynamic. You can analyze how demand, seasonality, and different customer segments affect price sensitivity. You can even run "what-if" scenarios to see precisely how a small price adjustment might ripple through your entire profitability.
This data-driven approach keeps your pricing perfectly optimized for the market, helping you maximize margins without driving away your customer base.
Ultimately, these applications are all about swapping reactive, manual processes for proactive, automated systems. When you connect all your separate data sources into one cohesive view, you create a powerful engine for making smarter, faster decisions that fuel sustainable growth.
Building Your Analytics Engine and Data Stack
To get those powerful, actionable insights, you need a solid foundation. This is your "analytics engine"—the machinery working behind the scenes to turn messy, raw data into clear strategic direction. The concept might sound technical, but it’s actually straightforward.
Think of your raw data—from sources like Stripe, your bank, or QuickBooks—as crude oil. It’s valuable, but you can’t pump it straight into your car. First, it has to be collected, refined, and delivered in a usable form. Your data stack is the system that does exactly that.
The whole point is to move beyond just staring at historical numbers and start building a financial model that actually looks forward.
From Raw Data to Refined Fuel
The first piece of the puzzle is a data pipeline, which acts like an automated collection system. It pulls that crude oil (your data) from all its different sources, cleans it up, and gets it ready for use. This step is all about making your data consistent and reliable.
Next, that refined data needs a home. A data warehouse is the modern equivalent of a massive, organized storage tank. It’s a central hub where all your clean, processed data lives, ready for analysis. This is a huge step because it breaks down the dreaded data silos, creating a single source of truth for your entire business. No more conflicting spreadsheet reports!
Finally, you need a way to make sense of it all. This is where a business intelligence (BI) tool like Power BI comes in. It’s like the dashboard in your car—it takes the refined fuel from your data warehouse and displays it as clear, easy-to-read metrics. All of a sudden, you're not just looking at numbers; you're seeing your business's speed, fuel level, and engine health in real time.
Why a Driver-Based Model is a Game Changer
Once you have your data stack humming along, you can build something truly powerful: a driver-based financial model. Let’s be honest, traditional financial reports are rearview mirrors; they only tell you where you’ve been. A driver-based model, on the other hand, connects your day-to-day operational activities directly to your financial outcomes.
Instead of just seeing that revenue went up, a driver-based model shows you why. It directly links the number of sales demos your team did last month to the new subscription revenue you see on your P&L.
This simple shift turns your financial planning from a static chore into a dynamic, strategic weapon. You can finally start asking "what-if" questions and get reliable answers back.
- What if we increase our marketing spend by 15%? The model can project the likely impact on new leads, sales conversions, and ultimately, your bottom line.
- What if we hire two more salespeople? You can see how that affects payroll costs versus the projected boost in closed deals.
This lets you run different scenarios to make smarter, forward-looking decisions, tying your operational and financial planning together in a way that spreadsheets just can't handle. For a deeper dive, check out our guide on building a modern data stack that can support this level of modeling.
The Ultimate Goal: Automation and Trust
The entire purpose of building this analytics engine is to achieve automation. When you connect your bank feeds, CRM, and accounting software into one cohesive system, you create a real-time, trustworthy view of your business performance. This completely eliminates the soul-crushing, error-prone manual work of exporting CSVs and copy-pasting data into spreadsheets.
This isn't about adding more complexity. It’s about removing it. It frees you and your team from the grind of data entry so you can focus on what actually matters: interpreting the insights and making the strategic calls that will drive your business forward.
Key Performance Indicators Every Founder Should Track
If you can't measure it, you can't manage it. The trick is measuring the right things. Tracking vanity metrics—like social media likes or total app downloads—is a fast track to wasting your time. Real analytics in banking means zeroing in on the key performance indicators (KPIs) that tell the true story of your company's health.
This isn't about creating a monster dashboard with 50 different charts. It's about curating a select few metrics that give you a complete, 360-degree view of the business. Get this right, and you'll spot trends, snuff out problems before they grow, and communicate your progress with confidence to your team and investors.
KPIs for Financial Stability
These are the non-negotiables. They're the vital signs of your company's financial health, telling you whether you have the cash and capital structure to survive the tough times and pounce on opportunities.
- Cash Burn Rate: This is the speed at which you're spending your cash reserves. Knowing your monthly burn is everything; it tells you exactly how many months of runway you have left before you either hit profitability or need to raise another round.
- LTV to CAC Ratio (Lifetime Value to Customer Acquisition Cost): This is the golden ratio of business models. It pits the total value a customer brings over their lifetime against what it cost you to get them in the door. A healthy ratio, often cited as 3:1 or higher, is proof that your growth engine is sustainable.
- Debt-to-Equity Ratio: This KPI measures your company's financial leverage by comparing what you owe to what you own. It's a critical indicator of risk that lenders and investors scrutinize to see how you're funding your growth.
Getting these numbers onto a Power BI dashboard transforms them from abstract figures in a spreadsheet into an intuitive early-warning system. Seeing your burn rate creep up or your LTV:CAC dip gives you the chance to act before a problem becomes a crisis.
KPIs for Operational Health
While financial stability is about survival, operational health is about efficiency. These KPIs pull back the curtain on how well you're running the day-to-day engine of your business.
- Days Sales Outstanding (DSO): In simple terms, how fast are you getting paid? A high DSO means your cash is trapped in unpaid invoices, which can create a serious cash flow crunch even if you’re profitable on paper. Tracking this helps you stay on top of your collections.
- Inventory Turnover: For any business holding physical stock, this ratio shows how quickly you're selling and replacing your inventory. High turnover is a great sign of strong sales; low turnover might mean you're overstocked or demand is softening.
Monitoring these operational metrics helps you find the hidden bottlenecks that are quietly draining your resources. An interactive dashboard makes it easy to see the direct line connecting your daily operations to your financial performance.
KPIs for Risk Management
Every business faces risk, whether it’s a sudden market shift or an internal threat. Analytics gives you the toolkit to measure and get ahead of these dangers.
One of the most critical risk metrics is the Fraud Transaction Rate. This KPI calculates the percentage of your total transactions that turn out to be fraudulent. Even a tiny uptick can expose a vulnerability in your systems, leading to expensive chargebacks and, worse, a damaged reputation.
By keeping a close eye on this and other risk indicators, you shift from reactive damage control to proactive defense. A clear view of these numbers is essential. For some great ideas on how to bring these metrics to life, check out our gallery of executive dashboard examples.
To get you started, we've put together a table of some of the most critical KPIs for any business leader.
Essential Banking & Financial KPIs for Your SMB Dashboard
Here’s a quick-glance table breaking down the KPIs that truly matter. These aren't just numbers; they're the language of your business's health, telling a story that every founder needs to understand.
| KPI | What It Measures | Why It Matters for a Founder |
|---|---|---|
| Net Profit Margin | The percentage of revenue left after all expenses, including taxes, are paid. | This is the ultimate bottom line. It tells you how profitable your core business is, plain and simple. |
| Customer Acquisition Cost (CAC) | The total cost of sales and marketing to acquire a new customer over a specific period. | If this number is too high, your growth isn't sustainable. You need to know what it costs to win business. |
| Customer Lifetime Value (LTV) | The total revenue a business can expect from a single customer account throughout their relationship. | LTV shows the long-term value of your customers. A rising LTV means you're building loyalty and a solid recurring revenue base. |
| Cash Runway | The number of months your company can operate before running out of money, based on current burn rate. | This is your survival clock. It dictates your fundraising timeline and forces disciplined spending. |
| Monthly Recurring Revenue (MRR) | The predictable revenue a business can expect to receive every month. | For subscription businesses, MRR is the heartbeat. It shows stability and predictable growth, which investors love. |
Focusing on this curated set of metrics will give you a powerful, at-a-glance understanding of where your business stands and where it's headed, allowing you to make smarter, faster decisions.
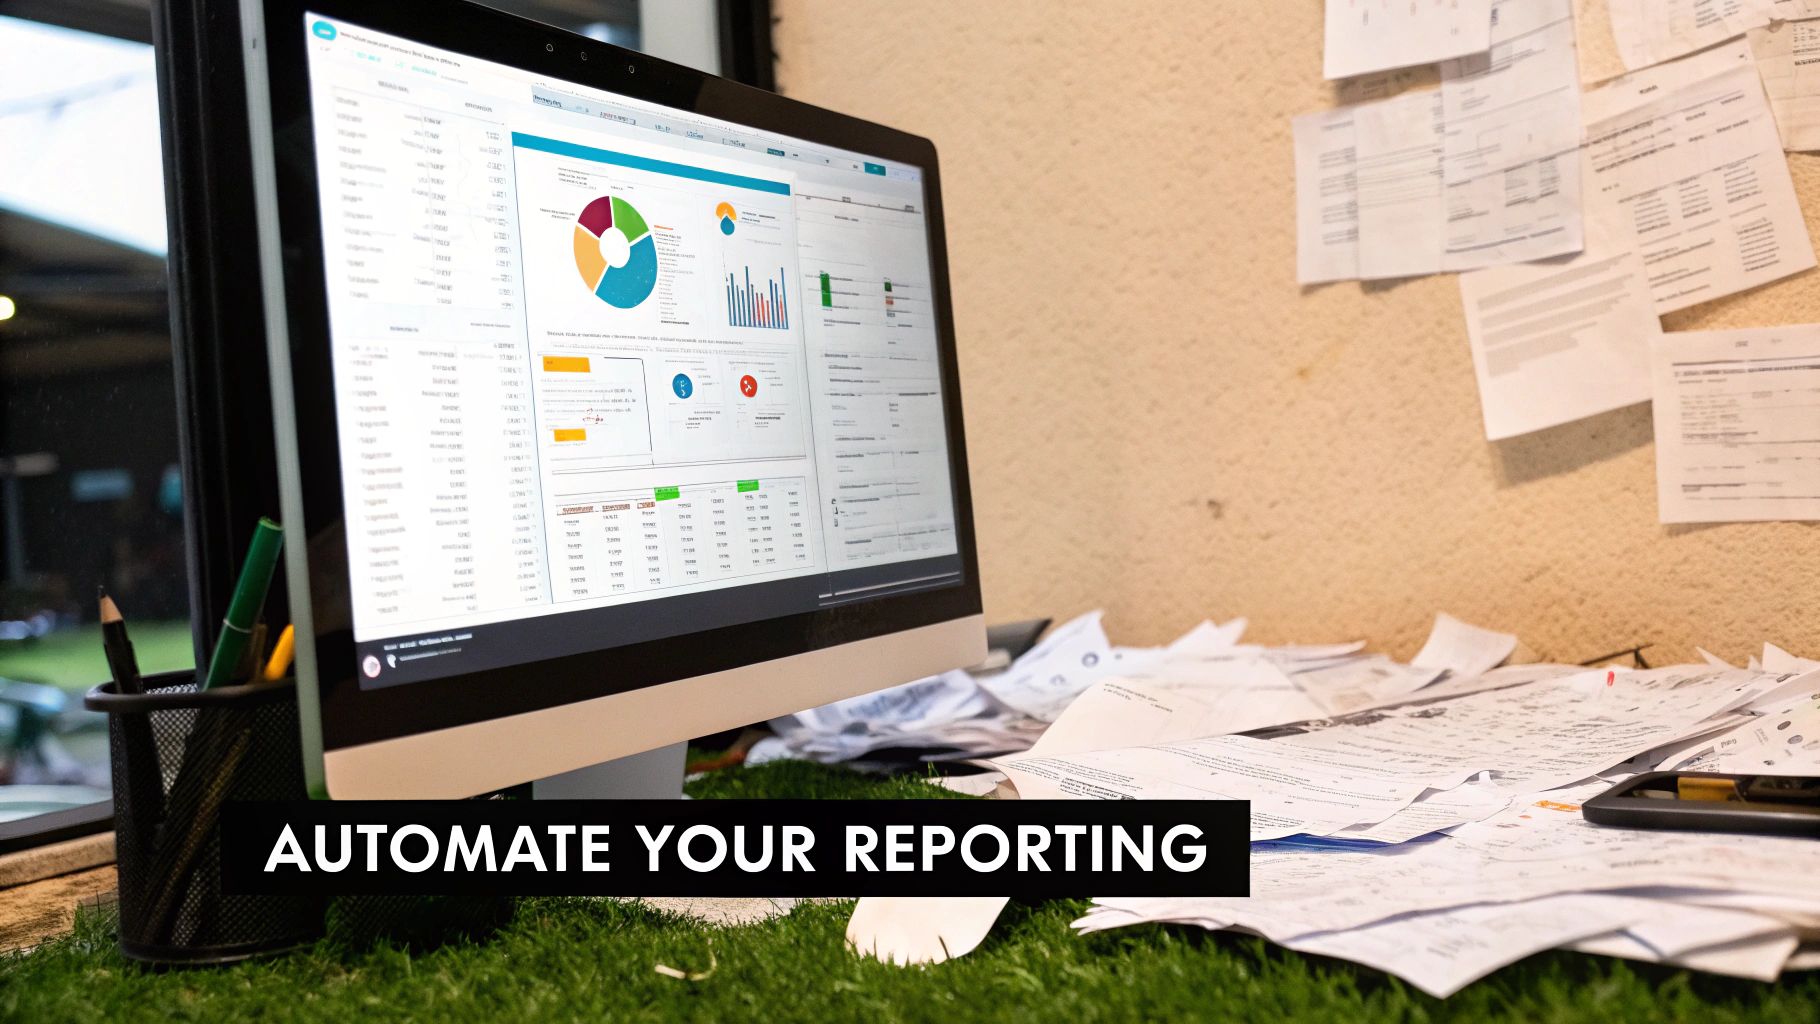
Your Roadmap from Excel Chaos to Automated Insight
Are you trapped in a maze of disconnected spreadsheets and manual reports? You're not alone. So many founders feel like they spend more time wrestling with data than actually using it to make decisions.
But here's the good news: making the leap from Excel chaos to a clear, automated analytics system is more achievable than you think. It just starts with a simple, focused plan.
This section lays out a practical, step-by-step roadmap to escape that grind and build an analytics engine that actually delivers real-time insight.
Step 1: Start with One Critical Question
The biggest mistake people make is trying to boil the ocean. Instead of aiming for a massive, all-encompassing dashboard right out of the gate, start by defining the one critical business question you need an answer to right now.
A focused starting point gets you a quick win and shows immediate value. Your question should be specific and impactful.
Good examples sound like this:
- "What is our true cash runway based on current sales and spending trends?"
- "Which of our products has the highest net profit margin after all costs?"
- "How is our customer acquisition cost (CAC) trending month-over-month?"
Choosing one clear question gives your entire analytics project a laser focus. It tells you exactly which data you need and what your first dashboard should look like.
Step 2: Identify and Consolidate Your Data Sources
With your question defined, the next step is to figure out where the answers live. Your data is likely scattered across a few key systems, and that's okay. Don't worry about connecting everything at once; just focus on the sources needed for your primary question.
For most businesses, this initial list is surprisingly short and manageable:
- Your Bank Feed: This is the raw truth for your cash flow.
- Your Accounting Software: Think Xero or QuickBooks, which holds your chart of accounts and P&L data.
- Your Payment Processor: Systems like Stripe contain detailed revenue and customer information.
The goal here is consolidation. We're not just exporting CSV files to manually stitch together. We're establishing automated connections to pull this data into a central spot, creating a single source of truth and killing off manual updates for good. For founders still deep in spreadsheets, solutions offering a direct Google Sheets integration can be a fantastic first step on this journey.
Step 3: Build Your First Interactive Dashboard
Now it’s time to bring your data to life. Using a tool like Power BI, you can build your first interactive dashboard—focused entirely on answering that one critical question. This isn't about fancy visuals; it's about clarity and action.
Your first dashboard should be simple, highlighting the key performance indicators (KPIs) that really matter. If your question was about cash flow, your dashboard would clearly display your cash burn rate, runway in months, and a forecast based on real-time data. This is the move from a static monthly report to a dynamic, daily decision-making tool.
A well-defined implementation strategy is essential. While banking analytics is driving record profits—global banks hit $1.2 trillion in net income in 2024—the path to ROI has its challenges. One analysis found only 4 out of 50 banks fully realized the return from their AI and analytics investments, highlighting the need for a clear roadmap to avoid common pitfalls. You can explore more insights about these global banking trends on mckinsey.com.
Step 4: Create a Rhythm of Review
This final step is the most important one: make this dashboard a core part of your operational rhythm. An insight that isn't acted upon is worthless.
Schedule a recurring time—daily, weekly, whatever makes sense—to review the dashboard with your team. This simple habit transforms analytics from a one-off project into an embedded business process. It fosters a culture of accountability and ensures that your decisions are consistently guided by data, not guesswork.
This entire process forms the core of a successful data strategy. You can get more details by exploring our guide to building a data strategy roadmap.
Want to automate your reporting and finally trust your data? Book a free call with our BI consultants today.
Your Questions About Banking Analytics, Answered
Jumping into data analytics can feel overwhelming, especially when you're focused on the day-to-day of running your business. Let's tackle some of the most common questions we hear from founders and operators about getting started with analytics in banking and finance.
How Much Does It Cost to Set Up an Analytics System?
This is way more affordable than most people think. You do not need a massive enterprise budget to get off the ground. The modern way to do this is to start small and get an immediate win.
A typical starter project looks something like this:
- A low-cost software subscription, like Power BI Pro.
- Some focused consulting time to connect 2-3 crucial data sources (think bank feeds and accounting software).
- Building out one core dashboard that answers your most urgent business question.
The initial investment is almost always paid back just in the hours you save by killing off manual reporting. More importantly, the cost of making a single bad call based on gut feel or a messy spreadsheet is almost always higher than the cost of a solid analytics setup.
Do I Need a Technical Team to Manage This?
No, and that’s the beauty of today's business intelligence tools. You'll want an expert to handle the initial setup—getting the data model right and making sure the connections are solid is critical. But after that, the system is designed for you, the business user.
A good implementation partner takes care of all the complex plumbing behind the scenes. Their job is to hand you a self-serve analytics tool that lets you explore your data and find answers without ever writing a line of code or needing to know what a database is. The whole point is to free you up to think about strategy.
How Long Does It Take to See Results?
You can get your hands on something tangible much faster than you might imagine. A tightly defined, focused project can deliver your first critical dashboard—like a real-time cash flow forecast—in as little as 4-6 weeks.
That first dashboard immediately gives you more clarity and confidence than you could ever get from a dozen disconnected spreadsheets. The truly game-changing results, like sustained boosts in profitability and smoother operations, build over the first 3-6 months as data-driven decisions become a natural part of your daily and weekly rhythm.
Is My Business Data Secure in the Cloud?
Absolutely. Major cloud platforms like Microsoft Power BI and Google Cloud have enterprise-grade security that is often far more robust than what a small or medium-sized business could manage in-house.
Here’s how your data is protected:
- End-to-end encryption, both while your data is moving and while it's stored.
- Rigorous compliance with global standards like GDPR and SOC 2.
- Granular user access controls, so your team members only see the data they're supposed to.
When you work with a reputable consultant, they'll make sure security and data governance best practices are baked in from day one, giving you peace of mind.
Ready to stop wrestling with spreadsheets and start making decisions with confidence? The team at Vizule can help you map out a clear path from data chaos to automated insight.
Book your free BI consultation and let's design the financial dashboard in Power BI that your business deserves.


