


Descriptive, predictive, and prescriptive analytics are the three core stages of data analysis. For a business owner, they’re a roadmap for turning messy data into strategic action. They answer the essential questions every founder asks: what happened (descriptive), what could happen next (predictive), and what should we do about it (prescriptive). Understanding this progression is the first step toward insight-led decision-making.
Moving Beyond Spreadsheets to Strategic Insight
If you're like most founders, you're probably swimming in spreadsheets. You've got financial data from QuickBooks, lead data from your CRM, and sales reports from Stripe—it's all there. You have a gut feeling the answers you need are buried in those numbers, but wrestling with manual reports is time-consuming and frustrating. This is where the analytics journey really begins. It's not about complex algorithms; it's about getting clarity.
This journey unfolds across three distinct stages, with each one building on the last. Getting your head around this progression is the first step to turning your data from a source of chaos into your most valuable strategic asset.
The infographic below lays this out perfectly, showing how each type of analytics creates a solid foundation for the next.
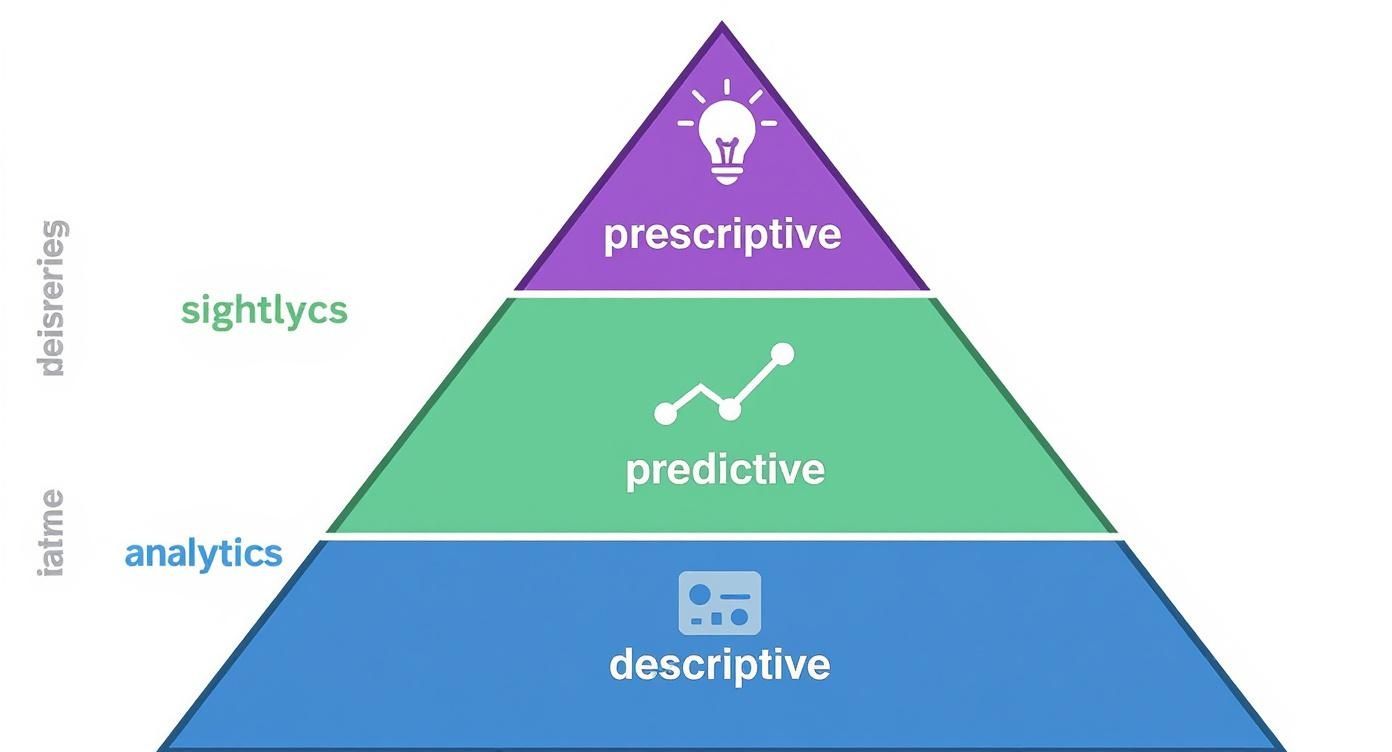
As you can see, descriptive analytics is the bedrock. It supports the forecasting power of predictive analytics, which in turn leads to the actionable recommendations you get from prescriptive analytics at the very top.
The 3 Stages of Data Analytics at a Glance
To make this crystal clear, let's break down how these three stages of analytics answer different business questions and deliver unique value. Each one plays a critical role in developing a mature data strategy.
| Analytics Type | Business Question It Answers | Primary Value | Example for an SMB |
|---|---|---|---|
| Descriptive | "What happened last quarter?" | Provides a clear, historical view of business performance. | Sales dashboard in Power BI showing revenue by product |
| Predictive | "Which customers are likely to churn?" | Helps you anticipate future trends and outcomes. | A forecasting model predicting next month's cash flow |
| Prescriptive | "What's the best action to retain these customers?" | Recommends specific actions to achieve desired goals. | Suggesting a targeted discount for high-risk customers |
This progression from looking in the rearview mirror to looking through the windshield—and then actually steering—is the essence of data-driven decision-making.
The Foundation of Business Intelligence
Descriptive analytics is where it all starts. It’s the foundational layer, giving you crucial insights into what’s happened in the past and what’s happening right now. It's no surprise that this area is seeing massive growth globally as more companies embrace data visualization tools and real-time reporting dashboards.
This journey isn't just for huge corporations. It’s a practical path for any SMB that’s ready to stop reacting and start making strategic moves backed by data. The right business intelligence strategy for your small business can weave your disconnected data points into a clear, compelling story about your company.
At its core, analytics is about answering questions with data. It starts with a simple "What were our sales last month?" and evolves into a strategic "Which actions will maximize our profitability next quarter?" This is the path from reporting to genuine insight.
To truly get ahead of the competition, you need to embrace tools that can deliver deep insights. As explored in this guide to AI for Financial Analysis, modern analytics platforms make this more accessible than ever. In this guide, we'll demystify all three stages and show you exactly how to put them to work.
Building Your Business Dashboard with Descriptive Analytics
Think of descriptive analytics as the dashboard in your car. It won’t predict a traffic jam or suggest a faster route, but it gives you the mission-critical information you need in real time: your speed, fuel level, and engine temperature. Without it, you’re driving blind.
For your business, this is the moment you finally pull all those scattered data points from your accounting software, CRM, and website into a single, automated dashboard. This is the first, most crucial step in the data analytics journey. It’s where you stop guessing and start knowing.
Instead of burning hours—or even days—manually wrestling with monthly reports in Excel, you get a live, accurate view of your entire operation. At a glance, you can see sales performance, website traffic, and key financial health metrics, all in one place.
From Raw Data to a Single Source of Truth
The main goal here is to establish a single source of truth. When your finance, sales, and marketing data all live in separate silos, you end up with conflicting numbers and endless debates over which spreadsheet is correct. Descriptive analytics, visualized through a well-designed dashboard, puts an end to that chaos.
This initial stage is all about answering one fundamental question: "What happened?"
- Sales Performance: Which products were our bestsellers last quarter?
- Customer Behavior: Where did our most valuable customers come from?
- Financial Health: What was our month-over-month revenue growth?
- Operational Efficiency: How long does it take, on average, to close a sales deal?
By visualizing this historical data, you create a reliable baseline. This isn't just a nice-to-have; it's the foundation upon which all future growth, forecasting, and strategic decisions are built. For the first time, you can see exactly what's working and what isn't.
This isn't just about making prettier reports; it's about building a data-driven culture. When everyone in the company is looking at the same numbers, alignment happens naturally. Conversations shift from arguing about the data to deciding on the next best action.
Laying the Groundwork for Deeper Insights
Getting this first step right is non-negotiable. The quality of any predictive or prescriptive work you do later depends entirely on the accuracy and clarity of your descriptive data. It’s why following dashboard design best practices is so important—you need reports that are not just informative but genuinely actionable for your team.
Once this foundation is solid, you have a powerful tool to monitor the health of your business in real-time. You’ve finally escaped spreadsheet chaos and are ready to look ahead, using this clear picture of your past to start forecasting the future.
Forecasting What Comes Next with Predictive Analytics
Once you've got a clear picture of your past performance with descriptive dashboards, the natural next step is to look ahead. This is where predictive analytics comes into play. Think of it less like a rearview mirror and more like a GPS that estimates your arrival time by analysing traffic patterns up ahead. It uses all that rich historical data you’ve gathered to forecast what’s likely around the corner.

For a growing business, this shift from being reactive to proactive is a game-changer. It’s no longer about simply reviewing last quarter's numbers; it’s about anticipating next quarter’s challenges and opportunities. This isn’t gazing into a crystal ball. It’s about using the clean, consolidated data you already have to make smarter, more confident decisions.
From Hindsight to Foresight
Predictive analytics moves beyond asking "What happened?" to tackle the all-important question: "What is likely to happen next?" By applying statistical models and machine learning algorithms to your historical data, you can start uncovering patterns that point to future outcomes. This is a massive leap in data maturity.
Here are a few ways this works in the real world for a small or medium-sized business:
- Financial Forecasting: Project your cash flow with much greater accuracy for the next six months, which helps you manage resources and investments without just guessing.
- Customer Churn: Pinpoint which customers are showing behaviours that suggest they might leave. This gives you a crucial window to step in and try to keep their business.
- Sales Prioritization: Predict which sales leads are most likely to convert, helping your team focus their energy where it will have the biggest impact.
- Inventory Management: Forecast demand for your products to avoid frustrating stockouts or costly overstocking, especially for seasonal items.
The widespread adoption of these techniques is exactly why predictive analytics has become such a dominant force. Fuelled by breakthroughs in machine learning, the global market was valued at around USD 18.89 billion and is projected to shoot past USD 85 billion by 2030. This rapid growth speaks volumes about its critical role in driving real business value.
How It Works in Practice
Modern business intelligence tools like Power BI have made these advanced capabilities accessible, even if you don't have a team of data scientists on standby. The key is to start with the clean, reliable data you established in the descriptive phase. Our guide on predictive modeling techniques digs deeper into how different models can be applied to common business challenges.
Predictive analytics transforms your data from a record of the past into a roadmap for the future. It gives you the foresight to steer your business toward desired outcomes, rather than just reacting to what has already occurred.
Ultimately, this stage empowers you with the knowledge to prepare for what's coming, allocate resources far more effectively, and build a truly resilient financial strategy. It’s the second crucial step in your journey from data chaos to strategic clarity.
Optimizing Your Decisions with Prescriptive Analytics
This is the final frontier of your data journey, the point where analytics stops being a passive observer and becomes an active co-pilot for your business. Think of it this way: if predictive analytics is the GPS estimating your arrival time, prescriptive analytics is the self-driving car that automatically reroutes you around a sudden traffic jam to guarantee the fastest trip.
It doesn’t just tell you what’s likely to happen; it recommends the exact actions you need to take to get the outcome you want.

This level of insight moves past simply forecasting the future and steps firmly into the realm of optimization. It’s built to answer the most powerful question any business can ask: "What should we do about it?"
For your business, this means getting direct, actionable advice that cuts through the noise and removes the guesswork. You’re empowered to make consistently better decisions, slash human error, and build a serious competitive edge through sheer efficiency and smart automation.
From Recommendation to Action
So, how does it work? Prescriptive analytics takes your historical data and future predictions and layers them with your specific business rules, goals, and constraints. The result is a clear set of recommendations designed to hit your targets. This is where your data finally starts working for you, not the other way around.
Here are a few ways this could play out for a small or medium-sized business:
- Marketing ROI: The system could pinpoint the optimal marketing spend across all your channels—social, search, email—to squeeze the maximum return out of every dollar.
- Dynamic Pricing: It could suggest real-time price adjustments for your products based on current demand, inventory levels, and what your competitors are doing, all to boost profit margins.
- Inventory Automation: It can automatically trigger inventory reorders based on sophisticated demand forecasts, making sure you always have the right products on hand at the right time.
This advanced capability is exactly why the global prescriptive analytics market is exploding. Valued at roughly USD 9.56 billion, experts project it will skyrocket to USD 82.31 billion by 2034. The demand for truly actionable, decision-driving insights is massive.
Simulating the Future
One of the most powerful tools in the prescriptive analytics toolkit is simulation. Advanced techniques like the Monte Carlo simulation for finance allow you to run thousands of "what-if" scenarios, testing out the potential impact of a decision before you commit to it.
This is like stress-testing your strategy against all kinds of different market conditions, giving you real confidence in the path you choose to take.
Prescriptive analytics closes the loop between insight and action. It's the final step that turns your data from a passive asset into an active engine for growth, guiding your business toward its best possible future.
By bringing descriptive, predictive, and prescriptive analytics together, you create a complete intelligence system. You can finally see where you’ve been, understand where you're going, and know the best route to get there.
Your Roadmap to an Analytics Strategy That Actually Works
Knowing the difference between descriptive, predictive, and prescriptive analytics is one thing. Putting them to work in your business is another entirely. For most business owners, the idea of "data analytics" sounds complicated and expensive, but it doesn't have to be.
It’s not about taking a giant, costly leap into the unknown. It’s a step-by-step process you can start today, using powerful tools you might already be familiar with.

This roadmap is all about building momentum and creating real value at each stage. You don't need a team of data scientists or a massive budget to get started.
Phase 1: Master the Present with Descriptive Analytics
Your first move—and the most important one—is to get a crystal-clear picture of what’s happening in your business right now. This is the foundation for everything else.
The goal here is to connect all those separate data sources you’re juggling. Think QuickBooks for your financials, HubSpot for sales, and Stripe for payments. Instead of living in different spreadsheets, you can use a tool like Power BI to pull them into a single, unified data model.
This simple step automates the process and creates a reliable single source of truth. You can finally stop spending hours manually building reports and end the arguments over which spreadsheet has the "right" numbers.
- Action: Centralize your core financial and operational data into an automated reporting stack.
- Outcome: A live, automated dashboard showing you exactly what’s going on in your business at a glance.
Phase 2: Forecast the Future with Predictive Analytics
Once you have clean, centralized data you can trust, you're ready to start looking ahead. This is where predictive analytics comes into play.
Modern BI tools have made this surprisingly easy. Power BI, for instance, has forecasting functions built right in. You can feed it your historical sales data, and it will project future trends for you. The same logic applies to building a dynamic cash flow forecasting model, giving you a much clearer sense of your financial runway.
This isn't about pulling numbers out of thin air; it's about using your own history to get an educated glimpse into the future. To see how this fits into a bigger picture, check out our guide on building a complete data analytics strategy.
- Action: Use forecasting tools on your historical data.
- Outcome: Proactive insights into future sales, customer trends, or cash flow.
Phase 3: Shape Your Outcomes with Prescriptive Analytics
With a solid grasp of your present and a forecast for the future, you can start exploring prescriptive analytics. This stage often feels the most natural for business owners because it taps directly into your commercial instincts.
Using your unified data model, you can run powerful "what-if" scenarios. What happens to our bottom line if we raise prices by 5%? What’s the probable ROI on that new marketing campaign we’re considering?
By simulating different decisions, you can test their potential impact before you commit a single dollar. You're effectively getting data-driven recommendations on the best path forward.
Climbing the analytics ladder is an iterative process. You start by creating a clear view of your business, use that clarity to forecast what's next, and then simulate different actions to choose the best one.
This practical, three-phase approach takes the mystery out of advanced analytics. It shows that making smarter, data-backed decisions is well within reach for any founder ready to move beyond spreadsheets and unlock the value hiding in their business data.
Turn Your Data into Your Greatest Asset
The journey from descriptive to predictive, and finally to prescriptive analytics, is really about changing the way your business thinks and acts. It's about moving from reacting to what's already happened to proactively shaping what comes next. This is how you go from data chaos to genuine clarity, turning raw numbers into your most powerful strategic asset.
At Vizule, we specialize in guiding SMBs like yours through every single stage. We're here to connect the dots in your data, get your reporting on autopilot, and build the financial models that give you the confidence to scale.
Of course, making this happen requires the right talent. To effectively transform raw data, the expertise of data analysts is crucial. If you're curious about what it takes to fill that role, checking out typical interview questions for data analysts can give you a great deal of insight.
But you don’t have to figure this all out on your own. Our entire purpose is to make sophisticated analytics accessible, helping you make smarter, faster decisions without the steep learning curve.
This progression isn’t just about new tools or software; it’s a fundamental shift in mindset. It’s about moving from asking, "What happened?" to confidently answering, "What is our best next move?"
Want to automate your reporting and finally trust your data? Book a free discovery call with our BI consultants today. Let's build your roadmap to clarity together.
Your Questions, Answered
If you're an SMB owner or founder thinking about a proper data analytics strategy, a few common questions usually pop up. Let's tackle them head-on.
Do I Really Need to Hire a Data Scientist?
For most SMBs, the short answer is no. Gone are the days when you needed a PhD in statistics to get good forecasts.
Modern business intelligence platforms like Power BI have made predictive features surprisingly accessible. You can build powerful forecasting models without the hefty salary of a full-time data scientist. A good BI consultant can get you set up and show your team the ropes in a fraction of the time.
My Business Is Small. Isn't This Overkill?
Not at all. In fact, it's the opposite—the perfect time to start is while you're still nimble and growing.
Think of it like this: setting up simple descriptive analytics now, like a clean sales dashboard, is like pouring a solid foundation for a house. It builds the structure you absolutely need for smart, sustainable scaling later on. Having your data clean and in one place is a massive competitive advantage, no matter your size.
A lot of founders wait to get organised until their data is a complete mess. Honestly, getting your data house in order early is one of the highest-impact things you can do. It builds a culture of clarity from day one, and that pays dividends for years as you grow.
What’s the Best First Step to Get Started?
Start with your single biggest headache. Don't try to solve everything at once, or you'll get nowhere.
What's the one question that keeps you up at night?
- Is it unpredictable cash flow?
- Are you losing too many good customers (churn)?
- Is your sales team's performance all over the map?
Nailing down that one critical question gives you focus. It tells you exactly what data you need to find an answer. This small, targeted start is the secret to building momentum and seeing a quick win. It proves the value of data-driven decisions and makes it much easier to justify tackling the next challenge.
Ready to stop guessing and start knowing? The team at Vizule specialises in building the data foundations that help SMBs automate reporting and unlock decisions led by real insight. Book your free BI consultation and let's see how we can connect the dots in your data.


