


If you’re a founder or SMB operator, you're probably living in spreadsheets. Financial reporting is a manual slog, your forecast feels like a guessing game, and getting a clear, up-to-the-minute picture of your cash flow is a daily battle. This isn't just inefficient—it's dangerous when your biggest decisions hinge on outdated, siloed data.
But what if you could trade that chaos for confidence? What if your financial data became your most powerful strategic asset instead of your biggest headache?
Moving Beyond Spreadsheet Chaos
For too many growing businesses, the finance function is reactive, pieced together with a fragile web of Excel files. This manual approach creates serious friction. Your team loses priceless hours just copying, pasting, and trying to make the numbers match up, instead of actually analyzing them.
This means critical decisions about hiring, inventory, or expansion are made with half the story. It's a recipe for hidden risks and stalled growth. This guide is your way out.
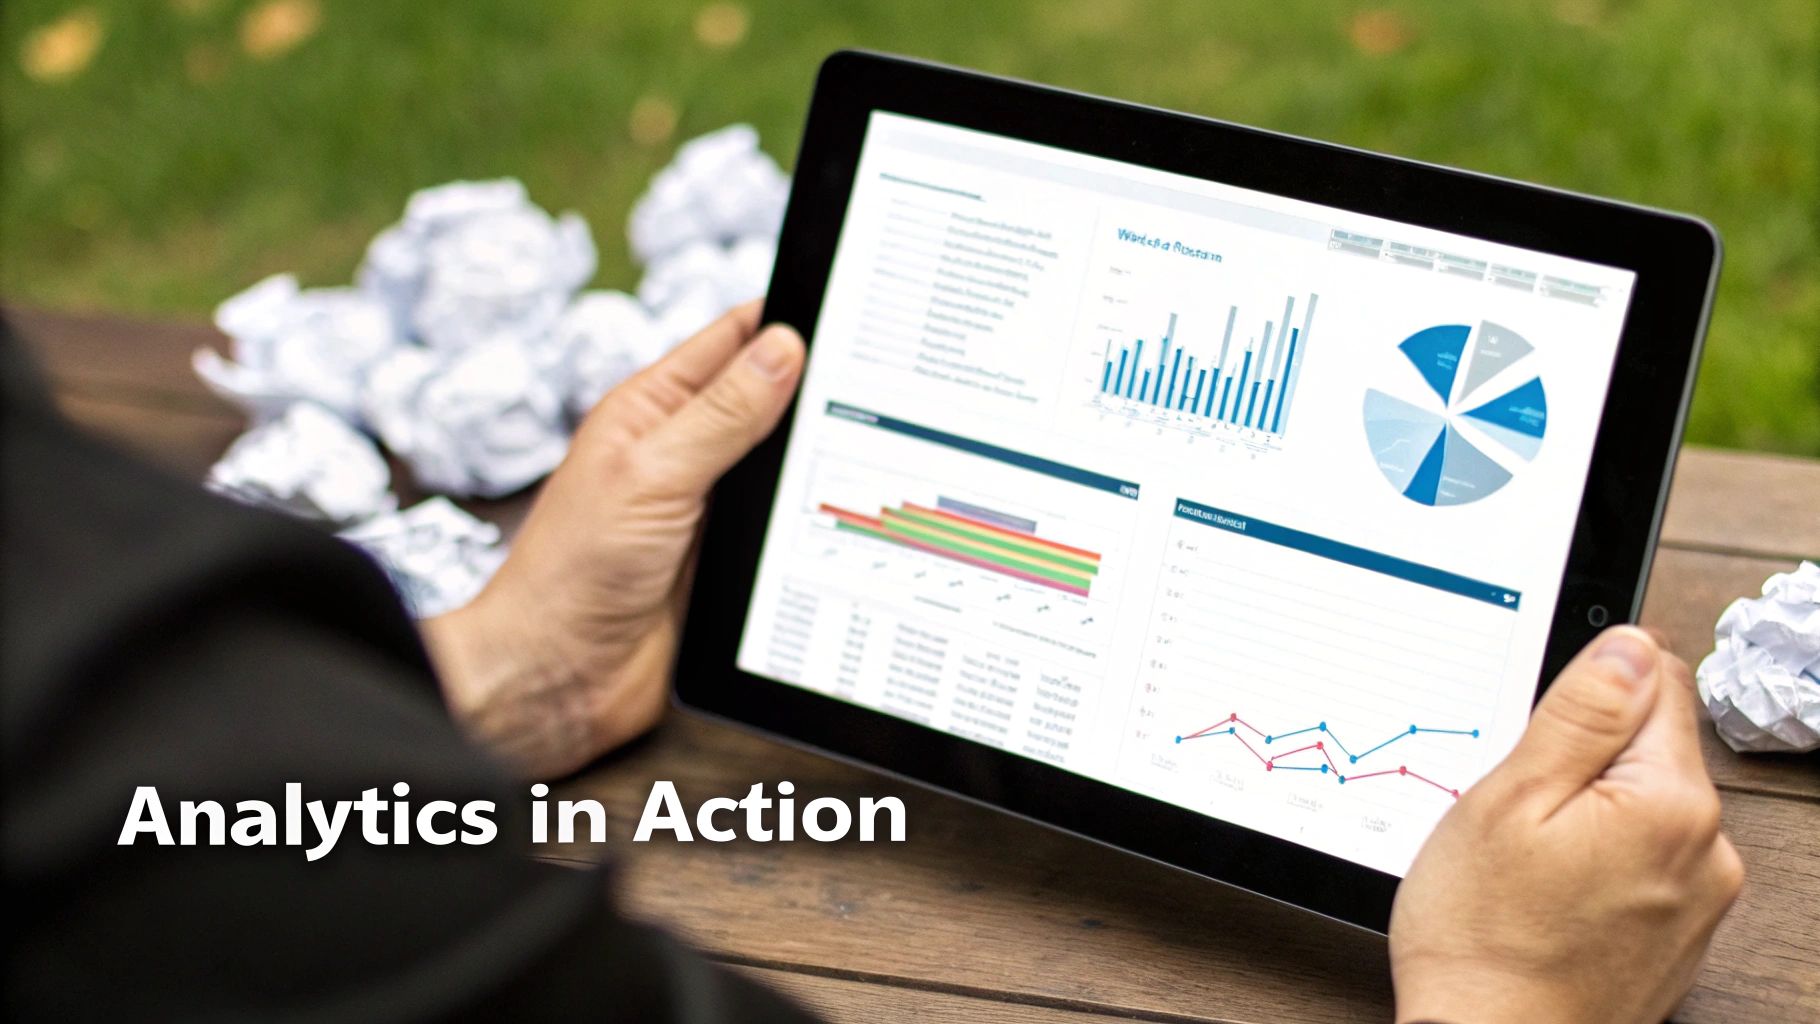
We’re going to pull back the curtain on analytics in finance, showing you exactly how to shift from reactive data entry to proactive, insight-driven leadership. You'll get a practical framework to automate reporting, finally trust your numbers, and gain the visibility you need to scale with confidence. This is a core part of the digital transformation in finance that helps modern businesses leave their competitors behind. It’s time to turn your financial data from a burden into your biggest advantage.
The Shift to Data-Driven Finance
This move toward analytics isn't just a trend; it's a fundamental change in how successful companies are run. The global financial analytics market is set to explode, projected to hit nearly $27.51 billion by 2034. That growth is being driven by businesses like yours adopting smarter tech to make sense of huge amounts of data, fast.
At its core, financial analytics is about using your historical and real-time data to understand performance, predict future outcomes, and make smarter, faster decisions. It transforms finance from a backward-looking reporting function into a forward-looking strategic partner.
By embracing this shift, you can:
- Automate manual tasks and free up your team for high-value strategic work.
- Gain a single source of truth for all your financial and operational data.
- Improve forecasting accuracy and manage your cash flow with much more confidence.
- Identify the true drivers of profitability and growth in your business.
The Four Levels of Financial Insight
The word "analytics" gets thrown around a lot, but what does it actually mean for your business finances? Think of it as a journey, moving from looking in the rearview mirror to seeing the road ahead—and even having a GPS to suggest the best route.
This journey happens across four distinct levels. Each one builds on the last, answering a more sophisticated question and delivering deeper strategic value.
Most businesses start with basic reporting. That’s a good first step. But true analytics in finance goes way beyond just knowing what happened. It's about understanding why, predicting what comes next, and most importantly, deciding what to do about it. This is how you escape spreadsheet chaos and start making genuinely data-driven decisions.
This workflow is all about moving from messy, manual processes to organized, actionable intelligence.
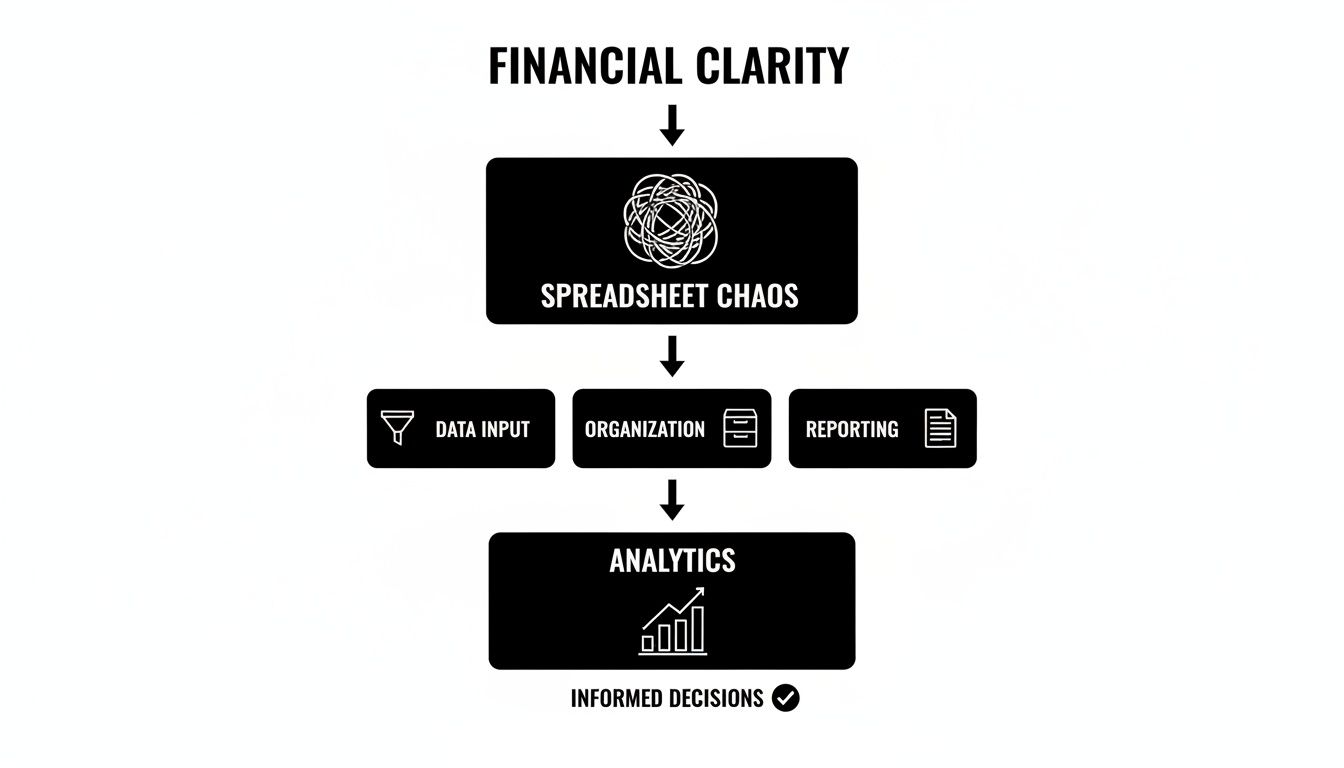
As you can see, organizing your data and automating reports lays the foundation for real analytics, which ultimately leads to smarter, faster decisions.
To make this crystal clear, let's break down the four types of analytics, what question they answer, and what they look like in a real-world small business setting.
The Four Levels of Financial Analytics for SMBs
| Analytics Type | Business Question | SMB Example |
|---|---|---|
| Descriptive | What happened? | Your monthly P&L statement shows you made a profit of $50,000. |
| Diagnostic | Why did it happen? | Your gross margin dropped because a key supplier raised prices by 15%. |
| Predictive | What will happen next? | Forecasting that sales will likely dip by 10% in Q3 due to seasonality. |
| Prescriptive | What should we do? | Modeling shows that hiring a new salesperson will yield a higher ROI than a new marketing campaign. |
This table maps out the progression from simple historical reporting to advanced strategic guidance. Now, let's dive a little deeper into each level.
Level 1: Descriptive Analytics (What Happened?)
This is your starting point and the most familiar type of analytics. It’s all about answering that one simple question: "What happened?"
Descriptive analytics boils down historical data into reports you can actually understand. For a small or mid-sized business, this is your monthly Profit & Loss statement, a sales dashboard breaking down revenue by region, or an accounts receivable aging report. It’s the essential first step—organizing your data to get a clear picture of past performance.
Level 2: Diagnostic Analytics (Why Did It Happen?)
Once you know what happened, the natural next question is why. This is where diagnostic analytics comes in, letting you drill down into your data to find the root causes behind the numbers.
Let's say your descriptive report shows your gross profit margin dropped by 5% last quarter. Diagnostic analytics helps you investigate. You might uncover that the drop was driven by a single supplier's price hike or a shift in your product mix toward lower-margin items. You’re moving from just observing to truly understanding.
This is where the magic happens when you connect financial data (from your accounting software) with operational data (from your CRM or inventory system). It’s how a unified platform like Power BI starts delivering powerful insights that Excel just can't match.
Level 3: Predictive Analytics (What Will Happen?)
Here's where things get exciting. You're no longer just looking backward; you're starting to look forward. Predictive analytics uses your historical data, statistical models, and machine learning to forecast what's likely to happen next.
As a founder, this is how you build a reliable cash flow forecast that accounts for seasonality or project future sales with much greater accuracy. Want to learn more about how these levels work together? Check out our detailed guide on descriptive, predictive, and prescriptive analytics.
Level 4: Prescriptive Analytics (What Should We Do?)
This is the peak of financial analytics. Prescriptive analytics doesn't just tell you what's coming; it recommends specific actions you should take. It directly answers the ultimate strategic question: "What should we do about it?"
This involves running sophisticated "what-if" scenarios. For example, you could model the precise financial impact of hiring two new salespeople versus investing that same budget into a new marketing channel. To reach these insights, firms are increasingly using advanced data analytics and machine learning in venture capital and other financial fields. By simulating different outcomes, prescriptive analytics guides you toward the best possible decision to hit your goals.
High-Impact Financial Analytics Use Cases
Knowing the theory behind the four levels of analytics is one thing, but seeing how they solve your actual business problems? That’s where it all clicks. For founders and SMB owners, financial analytics isn't some abstract concept—it’s about getting real, high-impact results that save precious time, cut down on risk, and genuinely fuel growth.
Let's move past the definitions and dive into the concrete ways analytics can transform your finance function from a manual, backward-looking cost center into a strategic engine for your business.
From Manual Reports to Automated Insight
The first and most immediate win for any growing business is killing the manual financial reporting beast. If your team still spends the first week of every month exporting data and wrestling with spreadsheets to build P&Ls, balance sheets, and cash flow statements, you’re trapped in a reactive cycle.
Before Analytics: The "monthly close" is a frantic, multi-day fire drill. By the time the final report lands in your inbox, it’s a static snapshot that’s already stale. If you want to know why a number looks off, it kicks off another round of digging through spreadsheets.
After Analytics: This is where live, interactive dashboards in a tool like Power BI change the game. Your P&L and cash flow statements update on their own, pulling data directly from your accounting software and other systems. You can drill down from a top-line revenue figure to an individual transaction with a single click, getting answers in seconds, not days. This is a fundamental shift in modern business intelligence for finance.
Building Forecasts You Can Actually Trust
Let's be honest: a simple "take last year's sales and add 10%" projection isn't a forecast. It's a guess. Real financial forecasting uses historical data and statistical models to create a much more reliable picture of the future, helping you manage resources and set targets you can actually hit.
This has become absolutely critical. The pressure for real-time financial monitoring and stricter compliance is pushing businesses everywhere to find better solutions. In fact, North America leads this charge with over 34% market share, largely driven by heavy investment in tech that enables smarter decisions and risk management.
This global trend highlights why we need to move beyond simplistic models. With a proper analytics setup, you can build a dynamic forecasting model that factors in complex variables like seasonality, market shifts, and your own sales pipeline data, giving you a much clearer view of the road ahead.
Master Your Future with Scenario Planning
What happens if your biggest customer churns? What's the bottom-line impact of hiring a new salesperson versus doubling down on a marketing campaign? Answering these "what-if" questions is the heart of scenario planning, and it's something spreadsheets are notoriously bad at.
With a driver-based financial model in Power BI, you can tweak key assumptions—like a 5% hike in material costs or a 15% jump in new leads—and instantly see the ripple effect on your cash flow and profitability over the next 12 months.
This is what it feels like to go from being a passenger to the pilot of your business. Instead of just reacting to disruptions, you can proactively model different futures and sharpen your strategy before committing a single dollar. It turns your finance function into a strategic sandbox.
Uncovering Your True Business Drivers
Finally, one of the most powerful things analytics in finance can do is pinpoint the handful of metrics that have an outsized impact on your performance. Is your profitability more sensitive to customer acquisition cost (CAC), customer lifetime value (LTV), or your average order value?
Most founders think they know the answer, but analytics proves it with cold, hard data. By connecting your financial data with operational data from your CRM and marketing platforms, you can build models that reveal these make-or-break levers.
- Example 1: A SaaS company might discover that a 10% reduction in customer churn has 3x the impact on long-term profitability as a 10% increase in new sign-ups.
- Example 2: An ecommerce business could learn that increasing their average order value by just $5 is more valuable than slashing ad spend by 20%.
Focusing your team's energy on the metrics that actually matter is how you scale efficiently and build a business that can withstand anything.
Your Roadmap to Implementing Financial Analytics
Diving into the world of analytics in finance can feel like a huge undertaking, but you don't need a massive IT department or a blank cheque to get started. For founders and SMB operators, the journey from spreadsheet chaos to data clarity is all about following a practical, step-by-step roadmap. It’s about building momentum, proving value quickly, and creating a new way of working.
Forget the idea of a multi-year, high-risk project. This is a series of deliberate steps designed to deliver real insights and automate painful manual work, fast.

Step 1: Build a Solid Data Foundation
Your analytics are only as good as the data they’re built on. The very first step is to break down the walls between your most critical systems—think accounting software, CRM, and operational platforms. The whole point is to create a single source of truth.
This process breaks down into a few key actions:
- Connecting Data Sources: We build automated pipelines that pull data from systems like QuickBooks, Xero, HubSpot, or Salesforce.
- Cleaning and Transforming: This is where we standardize messy data (like all the different ways a customer's name is spelled) and get it properly structured for analysis.
- Centralizing Information: We create a unified data model where your financial and operational numbers can finally be looked at together.
This foundational work is the most important step. It’s what allows you to finally trust your numbers and stop spending hours trying to make different spreadsheets match up—which they never do.
For businesses ready to formalize this, having a clear plan is key. You can explore our expert guidance on creating a data strategy roadmap to give your approach the structure it needs.
Step 2: Choose the Right Tools
Once your data is connected and clean, you need the right tool to bring it to life. While there are a ton of options out there, a platform like Microsoft Power BI often hits the sweet spot for SMBs.
It strikes the perfect balance between power and accessibility. It allows you to create the kind of dynamic, drill-down dashboards that, not too long ago, were only available to massive enterprises. It plugs directly into the data foundation you've built, turning raw numbers into clear, interactive visuals.
Step 3: Focus on Quick Wins
Momentum is everything. Instead of trying to boil the ocean by building a dozen reports at once, we focus on a single, high-impact "quick win" that solves a real pain point—all within the first 30 days. This proves the ROI of analytics right away and gets your team excited about what's next.
A 30-Day Quick Win Plan typically looks like this:
- Week 1 (Map): We pinpoint your most painful manual report—usually the weekly cash flow summary or the monthly P&L. Then, we map out all the data sources and key metrics needed to automate it.
- Week 2 (Model): We connect those sources and build the foundational data model in Power BI, setting up the automated data refresh process. No more manual updates.
- Week 3 (Mobilise): We design and build the first version of your interactive dashboard, focusing on making it clean, clear, and easy to use.
- Week 4 (Adopt): We train you and your team on how to use the dashboard, ask questions of the data, and make it a part of your daily workflow.
This approach delivers immediate value, turning a process that used to eat up 10-20 hours a month into something that’s instant. This isn't just a local trend; embedding advanced tech into finance is happening globally. A major driver is the rise of cloud-first systems and AI/ML tools, which lower costs and boost analytics power. The Asia-Pacific region, for example, is projected to see a 12.5% CAGR in this market through 2030, all thanks to digitization and a growing demand for modern financial services.
Step 4: Cultivate a Culture of Adoption
At the end of the day, the best dashboard in the world is useless if nobody uses it. The final, and arguably most important, step is to actively build a data-driven culture. This is about empowering your team to shift from gut-feel decisions to insight-led actions. For a broader look at where this is all headed, check out this vision for AI in financial services.
This means making data a central part of your regular meetings. It means celebrating the wins that came from insights you pulled directly from your new dashboards. When your team sees for themselves how data makes their jobs easier and their strategies more effective, adoption stops being a chore and starts becoming natural.
It's a huge cultural shift that can start with just a single, successful dashboard.
Tracking the Financial KPIs That Actually Matter
Any analytics system is only as good as the decisions it helps you make. It’s easy to get lost tracking every metric under the sun, but the real magic happens when you zero in on the Key Performance Indicators (KPIs) that are true signals of business health. Forget the vanity metrics; what you need is a focused financial command center.
Think of it as building a Power BI dashboard that gives you an at-a-glance health check of your entire business. Instead of drowning in data, you get a clean, crisp view of the numbers that matter. This clarity lets you spot trends, get ahead of risks, and jump on opportunities without getting bogged down in spreadsheet chaos.
Let's break down the three core areas that deliver this kind of clarity.
Profitability KPIs
Profitability is the bottom line—it’s the ultimate measure of whether your business model actually works. These KPIs don't just tell you if you're making money; they tell you how efficiently you're making it. They are the absolute bedrock of any financial dashboard.
- Gross Profit Margin: This is your revenue minus the cost of goods sold (COGS), shown as a percentage. It’s a direct reflection of your pricing strategy and production efficiency. Charting this as a trend line in Power BI can instantly show you if rising supplier costs or heavy discounting is eating into your profits.
- EBITDA: Standing for Earnings Before Interest, Taxes, Depreciation, and Amortization, EBITDA gives you a pure look at your core operational profitability by stripping out all the noise from financing and accounting decisions. For many businesses, it’s the best proxy for cash flow and a great way to benchmark your performance against others in your industry.
Liquidity and Cash Flow KPIs
Profit on a spreadsheet is one thing; cash in the bank is what keeps the lights on. Liquidity KPIs are non-negotiable, measuring your ability to cover short-term bills and manage the day-to-day financial grind.
A business can be wildly profitable and still go under from poor cash management. Your dashboard has to make your cash position impossible to ignore, turning it from a monthly report surprise into a daily pulse check.
Here are two metrics you absolutely have to watch:
- Current Ratio: It's a simple formula (Current Assets / Current Liabilities) that gives you a quick snapshot of your ability to cover your debts. If that ratio dips below 1.0, it can be an early warning sign of cash flow trouble, making it a must-have gauge on your main dashboard.
- Cash Conversion Cycle (CCC): The CCC tells you how long it takes to turn your investments (like inventory) back into cash in your pocket. A shorter cycle means a more efficient, cash-healthy business. Tracking this helps you fine-tune everything from inventory management to how you handle payables and receivables.
Efficiency and Growth KPIs
Finally, this is where your financials connect to your operations. These KPIs answer the big question: "Is our growth actually sustainable?" For startups and scaling companies, they are mission-critical, because every dollar of investment has to pull its weight.
Here are two of the most important metrics to track:
- Customer Acquisition Cost (CAC): This is your total sales and marketing spend divided by the number of new customers you brought in. Knowing your CAC is the first step to building a growth engine that doesn't just burn cash.
- Lifetime Value (LTV): LTV is the total revenue you can reasonably expect from a single customer over their entire relationship with you. The real insight comes when you compare it to CAC. An LTV-to-CAC ratio of 3:1 or higher is widely seen as the gold standard for a healthy, scalable business model.
When you bring these KPIs to life in Power BI, they stop being abstract numbers on a page and become a strategic guide. You can draw a direct line from operational tweaks to profitability, or see exactly how that marketing campaign translated into long-term value. It connects your daily actions directly to your bottom line.
Ready to build a financial command center that focuses on the metrics that drive real growth? Book your free BI consultation with a Vizule expert today.
Ready to Automate Your Financial Reporting?
You've seen how financial analytics can transform your business from a reactive, spreadsheet-driven operation into a proactive, insight-led organization. Making the journey from data chaos to strategic clarity is what separates the businesses that scale successfully from the ones that get stuck.
It's time to stop the endless cycle of manual work and start using your data to actually drive the business forward. No more late nights wrestling with outdated reports or making gut-feel decisions based on numbers you can’t fully trust.
Unlock Your Strategic Insights
If you're tired of time-consuming reporting cycles and ready to finally see what your data is trying to tell you, then it’s time for a conversation. We can show you how a properly set up Power BI solution becomes the single source of truth you need to lead with confidence. By implementing automated financial reporting software, you can connect all the dots and see the full picture.
This isn’t just about saving time—it's about freeing you up to focus on strategy, growth, and the big moves that will push your business forward. Let us handle the messy parts of data integration and visualization so you can focus on making an impact.
The goal is simple: make your financial data work for you, not the other way around. With the right system, you gain the ability to answer critical business questions in minutes, not days, and navigate the future with a clear, data-backed plan.
Don’t let outdated processes hold you back any longer. Book your free BI consultation and let's build the financial reporting engine your business deserves.
Still Have Questions? Let's Clear a Few Things Up.
Taking the leap into financial analytics brings up some very real, practical questions for founders and operators. It's a big step. We get it. Here are the most common things we hear from businesses ready to graduate from spreadsheet chaos and finally get a clear picture of what’s going on.
Is Something Like Power BI Overkill for a Small Business?
Not at all. While Power BI is an incredibly powerful platform, its entry-level versions are designed to be both accessible and affordable. For a small team, the cost is a fraction of the 10-20 hours you’ll save each month on manual reporting alone.
At Vizule, we specialise in building lean, focused Power BI solutions for SMBs. We don't bog you down with every bell and whistle. Instead, we zero in on the specific features and dashboards that will make a real difference to you, right now. Our team handles all the technical heavy lifting, so you get the power of enterprise-grade analytics without the headaches.
Our Data Is a Complete Mess. Do We Need to Fix It First?
Absolutely not. Waiting for "perfect" data is one of the biggest traps we see. It’s a recipe for stalling progress for months, or even years.
A huge part of what we do is data transformation. We start by connecting to your most critical data sources—think QuickBooks and your CRM—and then we build the automated pipelines to clean, unify, and structure that data right inside Power BI.
The honest truth? No company’s data is perfect. Our process is designed to deliver value from your most important metrics in about 30 days. From there, we can progressively pull in and clean up other data sources over time.
This way, you see a return on your investment almost immediately, instead of getting stuck in a data cleanup project that never seems to end.
How Long Does It Really Take to See a Return on Investment?
The first ROI you'll feel is in time saved, and it happens fast. Many of our clients are shocked when they reclaim a huge chunk of their month—previously lost to manual report-building—within the first 60 days. That's your first win. It frees up your team to focus on work that actually grows the business.
The strategic ROI—the kind that comes from making smarter calls on pricing, hiring, or cash management—builds over the next few quarters as you start using the insights to steer the ship.
- Immediate ROI (First 30-60 Days): A massive reduction in time wasted on manual reporting and stitching data together.
- Strategic ROI (3-6 Months): Better forecasting accuracy, tighter cash flow management, and making confident, data-backed decisions on your next big move.
We aim to get you a quick win, like an automated daily cash flow dashboard, within the first 30 days. It’s the best way to immediately show the power of having live, trustworthy analytics in finance at your fingertips.
Ready to stop wrestling with spreadsheets and start using your data to grow? At Vizule, we connect the dots in your financial and operational data, giving you the clarity to scale with confidence. Book your free BI consultation with us today and see how we can put your reporting on autopilot.


