


Is your team drowning in spreadsheets? Are you tired of sitting in meetings where everyone has a different version of the "truth"? For many founders and SMB operators, this is a daily reality. You're trying to make critical decisions about finance, sales, and operations, but you're constantly fighting conflicting reports and data you just can't trust. The problem isn't your team; it's the lack of a solid data foundation.
This is where data modeling for a data warehouse comes in. It’s not just a technical task; it's the strategic blueprint for organizing all your business data into a single, reliable source. Think of it as creating an architectural plan before building a house. It ensures that data from your CRM, accounting software, and operational tools all connect logically, creating a foundation for powerful and trustworthy reporting in tools like Power BI.
Moving From Manual Reporting Nightmares to Strategic Clarity
If you're running a growing business, you know the pain. You’re staring at conflicting sales, finance, and marketing reports, all cobbled together from different spreadsheets. It’s a frustrating, time-consuming cycle that erodes trust in your numbers and stalls important decisions.
This constant fire-drill is a classic symptom of siloed data. Every department works from its own island of information, creating multiple versions of reality and leading to endless debates over whose numbers are "correct." The solution isn't a fancier spreadsheet template—it's building a proper data warehouse with a smart architectural plan.
Why a Data Warehouse Blueprint is a Game-Changer
This is exactly where data modeling for a data warehouse becomes your most valuable asset. Imagine trying to find a specific tool in a messy, overflowing garage versus a perfectly organized workshop where everything has its place. That's the difference a good data model makes for your business information.
A structured data model helps you achieve several critical goals:
- Create a Single Source of Truth: It integrates raw data from all your essential apps—your CRM, accounting software, and marketing tools—into one unified, reliable source. No more conflicting reports.
- Unlock Powerful, Automated Reporting: A well-designed model is the bedrock for building insightful dashboards in Power BI, finally allowing you to connect the dots between your financial planning and operational performance.
- Build Unshakeable Trust in Your Data: When everyone is working from the same playbook, you can stop questioning the numbers and start acting on the insights.
This shift from manual chaos to automated clarity isn't just a nice-to-have; it's becoming essential. The data warehousing market is on track to grow by a massive $32.3 billion between 2024 and 2029. Why? Because businesses are realizing that a proper data structure can make information retrieval up to 100 times faster than with old-school databases.
Getting past the manual grind and truly tapping into what your data is telling you often requires specialist expertise. Engaging with data engineering consulting services can help you build the solid foundation your business needs to scale. Our own guide to business intelligence for small business offers more context on making this strategic leap.
This guide will walk you through how to turn your data from a frustrating liability into your most valuable strategic asset.
What Exactly Is Data Modeling for a Data Warehouse?
Let's cut through the jargon. Imagine you’re building a custom house. You wouldn't just show up and start laying bricks; you’d hire an architect to draw up a detailed blueprint first.
That blueprint is everything. It ensures the electrical, plumbing, and structural components all fit together perfectly, saving you from a nightmare of costly rework down the line. A data model is the exact same thing, but for your company's data.
It’s the strategic design that maps out how information from all your different systems—your CRM, accounting software, operational apps—will be structured and connected in a way that makes business sense. Without this plan, you end up with that messy digital garage we talked about earlier: a chaotic pile of data where it's impossible to find anything useful.
The Core Building Blocks: Facts and Dimensions
At its heart, data warehouse modeling boils down to two simple but powerful concepts. Think of them as the fundamental ingredients for all your business reporting.
- Facts: These are your numbers—the quantifiable metrics you track to measure business performance. We’re talking about things like sales revenue, units sold, marketing spend, or gross profit. They are the measurable events that happen in your business.
- Dimensions: This is the business context that gives your facts meaning. Dimensions answer the critical "who, what, where, when, and why" behind the numbers. A dimension could be the customer who made a purchase, the product they bought, the sales region, or the date the transaction occurred.
Without dimensions, a fact like "$10,000 in sales" is just a number floating in space. But when you add the context, you get a real story: "$10,000 in sales, from the new marketing campaign, to customers in London, for our premium product line, in the first week of March."
This combination of facts and dimensions is what turns raw, disconnected data into actionable business intelligence. It’s the difference between just seeing numbers and understanding the story they tell about your company's performance.
From Blueprint to Business Insight
Getting this foundational step right is non-negotiable if you want trustworthy reports and a team that’s aligned and working from the same playbook. When data from your financial system and your sales CRM are modeled correctly, you can finally build a cash flow report that connects a specific marketing campaign directly to revenue and profit margins—all in one clear view.
This logical structure is what allows a tool like Power BI to work its magic, letting you slice and dice data to spot trends, build a forecasting model, and answer complex questions on the fly. One of the most effective ways to organize these facts and dimensions is the star schema. We take a closer look at this popular method in our guide to understanding star schema data modeling for anyone wanting to go a level deeper.
Ultimately, a well-built data model isn't just a technical exercise. It's a strategic business asset that brings clarity and confidence to your decision-making.
Choosing The Right Blueprint For Your Business Data
Just like an architect wouldn't use the same blueprint for a skyscraper and a family home, you can't use a one-size-fits-all approach for your data warehouse. Picking the right design—or "model"—comes down to a simple question: what do you need your data to do for you?
Let's walk through the most common data modeling techniques, without the confusing jargon.
This diagram shows the basic idea perfectly. At the center, you have your core numbers, or 'Facts' (like sales revenue). These are given meaning by the business context, or 'Dimensions' (like dates, products, and customers), that surround them.
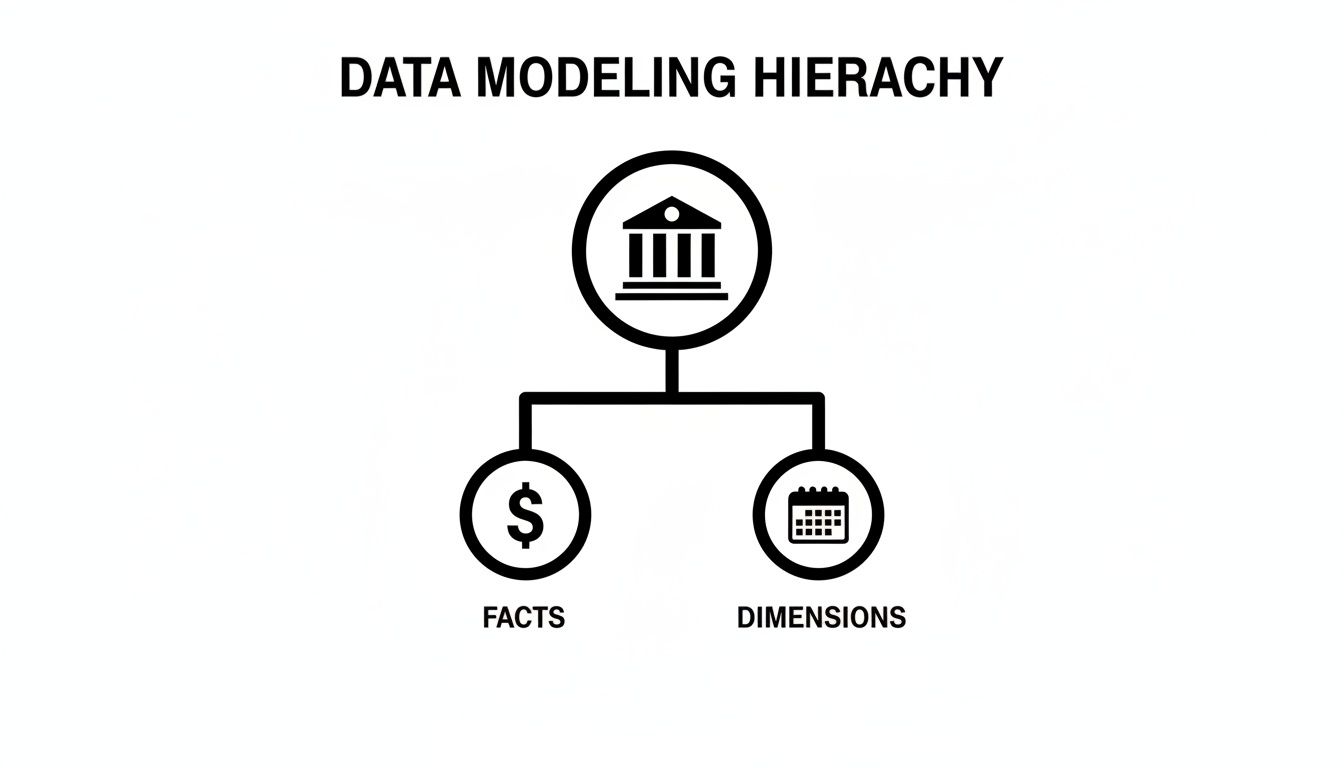
Ultimately, great business reporting is all about connecting those core performance metrics (the Facts) to the real-world context (the Dimensions) that tells the full story.
Dimensional Modeling (The Star Schema)
Think of Dimensional Modeling—often called the star schema—as the open-plan layout of the data world. It's designed with one thing in mind: fast, easy-to-understand analysis and reporting. For the vast majority of small and medium-sized businesses, this is the gold standard.
Its structure is beautifully simple. A central "fact" table holds your key business metrics (think sales revenue, units sold, or customer count). This table is directly linked out to several "dimension" tables that provide all the descriptive context—who, what, where, and when.
The result looks like a star, and the main benefit is speed. When your finance team asks to see "sales by region for last quarter," the system can pull that answer almost instantly. It's intuitive and built for business users, not just data engineers.
To get a better sense of the philosophies behind these structures, you can check out our deep dive on the Inmon vs. Kimball methodologies, which are the foundational ideas shaping these warehouse designs.
The Normalized Approach (3NF)
If the star schema is an open-plan home, the Normalized Form (or 3NF) is more like a traditional house with lots of separate, specialised rooms. Its primary goal is to stamp out data redundancy. Here, information is broken down into many smaller, interconnected tables to ensure every piece of data is stored only once.
For example, instead of one big customer dimension table, a normalized model might have separate tables for customer names, another for their addresses, and a third for their contact info, all linked by IDs.
This is a fantastic approach for the databases that run your daily operations (your CRM or accounting software), as it keeps the data clean and consistent. But for reporting? It can be a real headache. Answering a simple business question might mean joining 10 or more tables, which makes analysis slow and overly complex for your dashboards.
The Data Vault Model
Finally, there's the Data Vault, which you can think of as a futuristic, modular home. It’s engineered for maximum flexibility and scale, perfect for massive, complex companies where new data sources and business rules are changing all the time.
This model cleverly separates your core business identifiers (like a CustomerID), the relationships between them, and all their descriptive details into three different types of tables. This makes the entire system incredibly resilient to change. You can add a new data source without having to tear down and rebuild the existing structure.
For most SMBs, though, the Data Vault is overkill. It's a powerhouse solution for huge enterprises juggling dozens of evolving systems, but its complexity far outweighs the benefits for a business focused on clear, straightforward reporting. Adhering to the best practices in data warehousing is key to making sure your chosen model is both robust and efficient for your needs.
Comparing Data Modeling Techniques For Your Business
Choosing the right data model is a foundational decision for your analytics strategy. This table breaks down the three main approaches to help you see which one aligns with your business goals.
| Technique | Best For | Analogy | Key Benefit | Complexity |
|---|---|---|---|---|
| Dimensional (Star Schema) | Business intelligence and fast reporting for SMBs. | Open-Plan Home | Speed and Simplicity. Queries are fast and the structure is easy for business users to understand. | Low |
| Normalized (3NF) | Operational systems (e.g., CRM, ERP) and data integrity. | Traditional House | Reduces Data Duplication. Ensures each piece of information is stored only once. | Medium |
| Data Vault | Complex, large-scale environments with changing data. | Modular Home | Flexibility and Scalability. Easily adapts to new data sources and business rules. | High |
For founders and operators who need to move fast and get clear answers from their data, the choice is pretty clear. The Dimensional Model is almost always the right starting point. It's built to deliver the kind of insights that actually drive growth, without getting you tangled up in technical complexity you just don't need.
Executing the Plan with Our Map, Model, Mobilise Framework

Knowing you need a better data system is one thing; actually building it is another. For a busy founder, the thought of a complex technical project can be a real roadblock. Where do you even begin?
That exact uncertainty led us to develop our Map, Model, Mobilise framework. This is our proven, three-step process designed to take SMBs from a state of data confusion to strategic clarity—fast. We take the guesswork out of the equation so you can get right to the results.
Step 1: Map The Territory
Every successful project starts with a deep discovery phase. We call this the Map stage, because that’s exactly what we’re doing: charting the entire landscape of your business data. This isn't just a technical audit; it's a strategic conversation.
We sit down with you and your team to really get to the bottom of things:
- Your Key Business Questions: What are the critical unknowns keeping you up at night? Are you wrestling with customer lifetime value, figuring out profit margins by product, or trying to pin down sales pipeline velocity?
- Your Existing Data Sources: We dig in to find where your crucial information actually lives—whether it’s locked in your CRM, accounting software, random spreadsheets, or other apps.
- Your Desired Outcomes: What would having instant, trustworthy answers actually mean for your business? How would it change your weekly meetings or quarterly planning?
This first step is all about making sure the data model we build is firmly grounded in your real-world business needs, not just abstract technical theory.
Step 2: Model The Blueprint
Once we've mapped the terrain, we move on to the Model stage. This is where the architectural blueprint for your data warehouse truly comes to life. Our expertise in data modeling for a data warehouse allows us to translate your business logic into a structure that’s powerful, reliable, and built to scale.
This is the most critical phase. A well-designed model ensures your reports are fast, accurate, and make sense. A poor model just creates the same chaos you were trying to escape, but now it’s in a more expensive system.
We design the fact and dimension tables that will become your single source of truth. This is the part where data from all those different systems can finally talk to each other, allowing you to align your finance and ops data seamlessly. Think of this as the engine that will power all your future reporting and analysis. For a deeper dive into the technical plumbing, our guide on how to build a data pipeline explains how information flows into this central model.
Step 3: Mobilise The Insights
The final—and most exciting—step is to Mobilise. Your powerful new data model is complete, but it’s useless if you can't get the insights out of it. In this stage, we connect your data warehouse to Power BI, turning all those raw numbers into clear, interactive KPI dashboards.
We build the specific reports you told us you needed back in the Map phase, from high-level financial summaries to granular sales performance trackers. More importantly, we equip your team with the skills and confidence to actually use these tools, ask new questions of your data, and make decisions backed by solid insights.
This kind of strategic approach is quickly becoming essential. The global data warehousing market was valued at $13 billion in 2018 and is on track to hit $30 billion by 2025, a surge driven by the need to manage massive data volumes. As you can discover in more detail from this industry analysis, companies that adopt these methods can slash data-related costs by up to 30% simply through better efficiency.
If our structured, business-first framework sounds like the clear direction your company needs, let's have a conversation.
Ready to turn your data into a clear roadmap for growth? Book your free discovery call with a Vizule consultant today.
Common Data Modeling Mistakes That Stall Growth
Many business intelligence projects are doomed long before anyone writes a single line of code. The culprit isn’t usually the technology; it’s the avoidable strategic mistakes that burn through time, budget, and trust.
At Vizule, we’ve seen a few common pitfalls that consistently trip up growing businesses. Spotting them early is the key to building a data asset that actually delivers value.
Trying to Model Everything at Once
One of the most frequent errors is the temptation to pull in every single data point from every app right from the start. Founders, driven by the desire for a perfect, all-encompassing view, essentially try to boil the ocean.
This approach almost always backfires. It creates an impossibly complex data model that becomes a never-ending project, collapsing under its own weight before a single useful report ever sees the light of day. The key is to start with a laser focus on your most critical business questions—like improving your cash flow reporting—and build out from there.
Ignoring Crucial Business Context
Another classic misstep is building a model without a deep understanding of the business context. This is what happens when a data project is treated as a purely technical exercise, disconnected from how the company actually measures success.
The result? A set of dashboards that might look technically impressive but are practically useless. They don't reflect the key performance indicators (KPIs) that leadership actually uses to run the business. The model fails to answer the questions that matter, leading to low adoption and the feeling that the entire investment was a waste.
A data model should be a direct reflection of your business logic. If the people building it don't understand your sales cycle, your financial reporting needs, or your operational drivers, the project is destined to miss the mark.
Using the Wrong Tools for the Job
Finally, a massive mistake we see is forcing tools to do jobs they were never designed for. The most common offender is trying to make Excel function as a data warehouse. While it’s a fantastic tool for quick, ad-hoc analysis, it completely crumbles when used as a central database for reporting.
Using Excel as a database is a breeding ground for manual errors, version control nightmares, and a total lack of trust in the numbers. It’s the very definition of "Excel chaos" that a proper data warehouse is designed to solve.
On a similar note, poor data quality can sabotage even the best-designed model. If you'd like to learn more, we have a complete guide on how to improve data quality that can help you build a more reliable foundation.
To avoid these costly missteps, your approach to data modeling for a data warehouse has to be both strategic and pragmatic.
- Start Small and Iterate: Begin by modeling a single, high-impact area like sales or finance. Prove the value quickly, build momentum, and then expand.
- Prioritize Business Logic: Make sure the modeling process is led by business questions, not by what’s technically possible.
- Invest in the Right Stack: Use a proper data warehouse and a BI tool like Power BI to build a scalable, automated, and trustworthy reporting system.
Avoiding these common mistakes isn't just about better tech—it's about ensuring your investment in data drives real, measurable growth.
Are you ready to build a data model that answers your most important business questions? Book a free consultation with our BI experts to get started.
Why Modern Cloud Data Warehouses Are a Game-Changer for SMBs

Not too long ago, building a data warehouse felt like a project reserved for massive corporations with deep pockets and sprawling IT departments. It meant buying racks of expensive servers, navigating complex software licenses, and hiring a whole team just to keep the lights on. For most small or medium-sized businesses, it was simply out of reach.
Today, the cloud has completely changed the game.
The New Era of Accessible Analytics
Modern cloud platforms, often called Data Warehouse as a Service (DWaaS), have put enterprise-grade analytics within reach of every business owner. Instead of a huge upfront investment, you get access to incredibly powerful technology on a flexible, pay-as-you-go basis.
This isn't just a technical upgrade; it’s a fundamental shift that levels the playing field. It gives ambitious SMBs the firepower to compete with larger rivals by making smarter, faster, and more data-driven decisions. And the market is responding.
The global DWaaS market is exploding from $8.11 billion in 2024 to a projected $39.58 billion by 2032. This rapid adoption shows how businesses are eagerly ditching rigid, old-school systems for flexible cloud solutions that can grow with them. You can read the full research about this market shift to see the momentum.
Key Benefits for Your Business
So, what does this actually mean for you as a business owner? It boils down to a few game-changing advantages that directly impact your bottom line and your ability to scale.
- Pay Only for What You Use: With platforms like Snowflake, Google BigQuery, or Azure Synapse, you’re billed for the computing power and storage you actually consume. During a slow month, your costs go down. As you grow, the system scales with you.
- Scale Instantly: Land a huge new client or launch a major marketing campaign? A cloud data warehouse can handle sudden spikes in data volume without breaking a sweat. There's no need to order and install new hardware; the system just adapts.
- Eliminate Infrastructure Headaches: You no longer need to worry about managing, patching, or upgrading physical servers. All of that is handled by the cloud provider. This frees you and your team up to focus on what actually matters—using data to grow the business.
With a solid data modeling for a data warehouse strategy built on a modern cloud platform, even a small team can manage massive amounts of information. You can automate complex financial and operational reporting, connecting data from across your entire business to unlock insights that were once impossible to find.
This is your chance to move beyond guesswork and start operating with the kind of clarity and confidence that drives real, sustainable growth.
Want to see how a modern data stack could transform your reporting? Book a free BI consultation with Vizule to explore your options.
Data Modeling Questions We Hear All The Time
When founders and operators are considering building a proper data warehouse, a few common questions always come up. Here are our straight-shooting answers from a trusted advisor, not a software vendor.
How Long Does This Actually Take To Build?
Forget the multi-year sagas of the past. Using modern cloud tools and a focused approach like our Map, Model, Mobilise framework, we can deliver an initial, high-impact data warehouse for a core area like sales or finance in a matter of weeks, not months or years.
The key is to avoid boiling the ocean. We start by laser-focusing on your most painful reporting bottleneck, prove the value fast, and then build on that success iteratively. It’s an agile approach that gets you results quickly and builds real momentum.
Is a Data Warehouse Even Affordable for a Small Business?
Absolutely. The old world of massive upfront hardware costs and eye-watering license fees is dead. Cloud-based platforms have completely changed the economics.
With today’s 'pay-as-you-go' models, it's incredibly affordable and scales right alongside your business. Honestly, when you add up the hidden costs of not having one—wasted team hours on manual reporting and bad decisions made on gut feel—a modern data warehouse delivers a seriously fast and significant return on investment.
Do I Need to Hire a Full-Time Data Engineer for This?
Definitely not. For most small and medium-sized businesses, partnering with a specialist consultancy like Vizule is far more cost-effective than bringing on a full-time, in-house data engineer.
We handle all the technical heavy lifting—the design, build, and ongoing maintenance. This frees up your team to do what they do best: use the insights to run and grow the business. Our whole goal is to deliver a rock-solid solution your team can easily use through tools they already know, like Power BI, without needing a dedicated tech guru on payroll.
Should I Wait Until All My Data Is Clean Before I Start?
This is probably the biggest myth we see, and it’s a classic recipe for analysis paralysis. If you wait for "perfect" data, you will simply never start. The reality is, the process of building a data modeling for a data warehouse is the best way to systematically get your data clean and organized.
We work with you to pinpoint the most critical data sources first. From there, we build in the business rules to standardize and transform that information as it flows into the warehouse. You don't need pristine data to begin; you just need a smart plan to get there.
Ready to automate your reporting and finally trust your data? The team at Vizule specialises in building powerful, yet practical, data solutions that connect the dots for growing businesses.
Book your free BI consultation and see how Vizule can help automate your reporting stack.


