


Month to date meaning refers to measuring performance from the 1st of the current month up to the most recent business day with available data. Month-To-Date (MTD) metrics give you a live, intramonth snapshot so you can act before month-end—cutting through Excel chaos, siloed data, and late-night formula fixes.
Within these opening lines, we’ve answered the question “what is month to date meaning” by defining the period and emphasising why it matters for SMB operators seeking real-time clarity.
Understanding Month To Date Meaning
For teams buried in manual spreadsheets, MTD zeroes in on a partial-month window to bring instant clarity. It boils down to one question: How are we doing so far this month?
Because MTD updates daily, it’s far more actionable than waiting on a full-month report. That real-time visibility helps you pivot the moment you spot shifts in the data.
- Spot early trends in sales, expenses, cash flow reporting or KPI dashboards
- Compare mid-month performance against monthly targets
- Pinpoint issues before the books close
“MTD lets you spot emerging issues before month-end and keeps reports actionable in real time.”
Summary Of Month To Date Definition
| Aspect | Description |
|---|---|
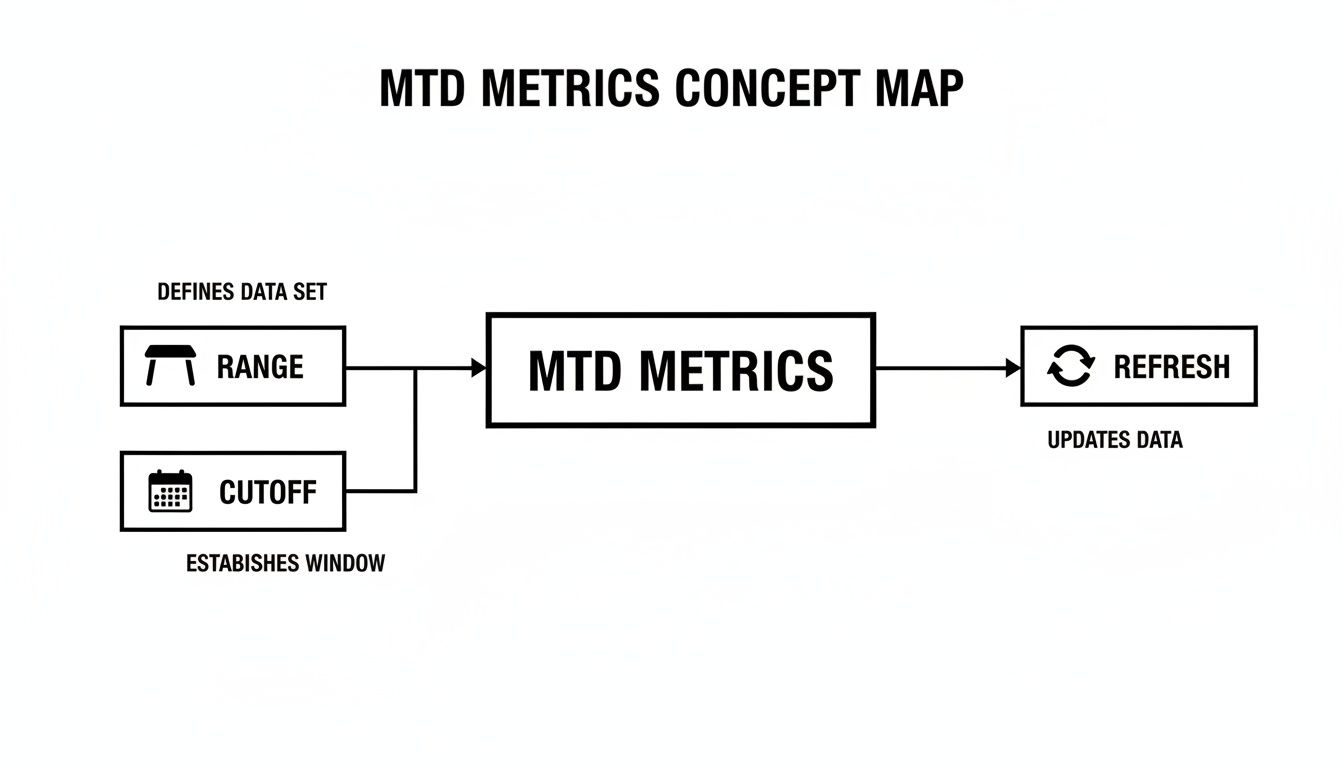
| Metric Range | 1st of Month to Latest Business Day |
| Cutoff Date | Most Recent Data Entry Date |
| Calculation Logic | Cumulative Sum or Average over the period |
Keeping these points in mind ensures your MTD calculations stay clear and consistent.
For a deeper dive into how MTD slots into your broader reporting framework, check out our guide on management reporting.

Apply MTD metrics in your dashboards to accelerate decision-making and cut down on manual errors.
See results with automated BI—book your free BI consultation.
Understanding Key Concepts Of Month To Date

Month-to-date is like a runner glancing at her split times halfway through a race. You see exactly where you stand—and decide if it’s time to accelerate or adjust your pace.
In business, MTD captures performance from the 1st of the month up to the most recent business day with data available. It acts as a live dashboard, offering real-time clues about how your month is unfolding.
Instead of waiting for month-end totals, MTD provides an intramonth snapshot. That early visibility helps teams course-correct long before the final numbers close out.
Key Differences To Full Month Reporting
A mid-month view highlights shifts while there’s still time to respond. Key distinctions include:
- Range Focus: Tracks from the 1st of Month through the Most Recent Business Day.
- Timing Impact: Full-month reports compile all data after close, losing mid-cycle context.
- Actionability: MTD fuels immediate interventions; end-of-month summaries inform broader reviews.
MTD becomes a tactical compass rather than a static report.
Defining your cutoff clearly—“MTD through [Specific Date]”—is essential for apples-to-apples comparisons. Without it, you risk mismatched timeframes and stakeholder confusion.
Calendars, holidays, and data lags all influence your MTD window. Omitting cutoff details can lead teams to compare uneven slices of time.
How Terminology Shapes Team Discussions
Consistent language—MTD, YTD, rolling period—ensures everyone, technical or not, follows along during performance reviews.
“Month-to-date” simply covers Day 1 through the latest business day. That’s why analysts track cumulative returns for indices like the S&P 500 and MSCI EAFE over that span: to reveal momentum and seasonal patterns.
Learn more about MTD snapshots in economic calendars on TradingEconomics economic calendar.
You might find our guide on performing trend analysis useful for putting MTD into a broader context.
Adopting MTD reporting turns mid-month figures into actionable insights. Next, we’ll explore step-by-step calculations in Excel, Power BI, and modern data-pipeline workflows.
Armed with these concepts, you’ll steer monthly goals with clarity.
Calculating Month-To-Date Metrics
To get a live snapshot of your performance, you need clear date boundaries—from the 1st of the month through your most recent data point. That way, you’re not waiting for a full-month close to spot trends or issues.
In Excel, dynamic date cutoffs keep your MTD figures current. As you add new rows, your formulas adjust themselves.
- Define a named range like MTD_Date that points to your date column
- Use Table[Metric] structured references for tidy, self-expanding formulas
- Combine EOMONTH and TODAY() to lock in the start and end of your period
If your table only lists business days, weekends and holidays vanish from your sums automatically—no extra filters required.
Step By Step MTD Calculation In Excel
Begin by turning your raw data into an Excel Table—let’s call it SalesTable—so your formulas grow with your rows. Then paste this into a cell to total MTD sales:
=SUMIFS(
  SalesTable[Amount],
  SalesTable[Date], ">=" & EOMONTH(TODAY(), -1) + 1,
  SalesTable[Date], "<=" & TODAY()
)
That picks up every transaction from the 1st of the month through today, skipping any dates you haven’t recorded (like weekends).
- Wrap it with IFERROR to show 0 instead of errors
- Display your cutoff as TEXT(TODAY(), “MMM D, YYYY”) for clarity
- Use named ranges if your dates and amounts live on separate sheets
You might need to merge sales and date tables first. For a step-by-step on table joins and clean workflows, see our guide on joining tables in SQL.
Automating MTD With Power BI DAX
For Power BI users, DAX makes MTD effortless. A typical measure uses DATESMTD:
Sales MTD = CALCULATE(
  [Total Sales],
  DATESMTD('Date'[Date])
)
Add a holiday or calendar table to handle non-business days. After a daily refresh, your MTD numbers update automatically—no manual tweaks needed.
| Measure | DAX Expression |
|---|---|
| Sales MTD | CALCULATE([Total Sales], DATESMTD('Date'[Date])) |
| Cost MTD | CALCULATE([Total Cost], DATESMTD('Date'[Date])) |
Investment research teams often share MTD percentage changes to capture short-term market swings. For example, 81% of S&P 500 companies beat earnings expectations in a recent month-to-date window. Since those figures exclude future trading days, always call out your cutoff date to keep everyone on the same page. Discover more on the J.P. Morgan AM site (https://am.jpmorgan.com/gb/en/asset-management/per/insights/market-insights/market-updates/monthly-market-review/).
Always display your cutoff date prominently so stakeholders trust and understand your MTD snapshots.
MTD Best Practices
- Label every chart or table with exact cutoff dates and data sources
- Schedule a daily data refresh early each morning
- Review your MTD logic monthly to catch any date misalignments
Ready to automate your reporting and finally trust your numbers? Book a free BI consultation with Vizule and take control of your Month-To-Date metrics.
Comparing MTD With YTD And Rolling Periods
Picking the right time frame—MTD, YTD, WTD or a rolling window—can be the difference between a clear insight and a misleading report. YTD (Year-To-Date) runs from January 1 through today, giving you a big-picture view. WTD (Week-To-Date) captures the week’s ebb and flow, while a rolling period (for example, the last 30 days) irons out day-to-day noise.
Below is a quick reference table to help you decide which metric fits your needs.
Comparison Of Common Time Range Metrics
| Metric | Definition | When To Use | Calculation Period |
|---|---|---|---|
| MTD | Tracks performance from the 1st up to the latest business day | Spot intramonth trends and catch issues early | Partial month: Day 1 through today |
| YTD | Cumulative from January 1 to the latest business day | Assess full-year progress against targets | Year start through today |
| WTD | From the start of the week through today | Monitor weekly campaigns or operational shifts | Week start through today |
| Rolling | Total or average over a fixed span (e.g., last 30 days) | Smooth out volatility and observe moving trends | Continuous window of the previous N days |
Choosing The Right Window
- Use MTD when you need early warnings on monthly targets.
- Turn to YTD for strategic, year-over-year comparisons.
- Lean on WTD to track short-term campaigns or site performance.
- Apply a rolling window to smooth out daily spikes and dips.
Comparing multiple ranges side by side helps reveal momentum and timing effects.
A retail manager might measure MTD sales against monthly goals, while a CFO checks YTD cash flow to validate budget assumptions. A marketing lead watches WTD web traffic for campaign impact, and product teams rely on a 30-day rolling average to prioritize backlogs.
Best Practices To Avoid Pitfalls
- Label Cutoff Dates clearly on every chart.
- Automate Refreshes so MTD, YTD, WTD and rolling figures update daily.
- Align Data Sources to keep definitions consistent across reports.
- Document Calculation Logic in a shared governance dashboard.
You might be interested in learning more about rolling forecasts. Check out our guide on what is rolling forecast for deeper insights.
Applying MTD In SMB Reporting Scenarios

Running a small or midsize business means making decisions one day at a time. MTD metrics slice a month into digestible chunks, so you can spot issues before they become surprises.
Seasoned operators lean on partial‐month data to steer staffing, promotions and cash planning in real time. Below are three concrete scenarios where an early read on the month sparks smarter choices.
“MTD transforms a month into bite‐sized, manageable segments, letting teams adjust pace in real time.”
Retail Sales Tracking
Imagine a boutique retailer comparing daily sales against a monthly revenue goal. An MTD gauge on a Power BI dashboard immediately flags any shortfall.
| KPI | MTD Formula |
|---|---|
| Sales MTD | =SUMIFS(Sales, Date>=Start, Date<=TODAY()) |
| Goal % | Sales MTD ÷ MonthlyGoal |
By day 10, the manager spots a 12% dip and calls in extra weekend staff.
- Highlight Sales MTD vs Target in red/green
- Refresh the report every morning
- Factor in weekend or holiday adjustments
This simple setup cut overtime costs by 15% last quarter.
Marketing Team Analysis
A lean marketing squad tracks intramonth web traffic and campaign ROI with MTD formulas. Daily updates let them pull the plug on underperforming ads before burning the budget.
- Page Views MTD =SUM(PageViews[Date]>=MonthStart, PageViews[Date]<=Today())
- Conversion MTD =DIVIDE(MTDConversions, MTDVisitors, 0)
When a dashboard widget showed a 35% drop in conversions by mid-month, the team pivoted strategy on the spot. Overlaying campaign start dates on the MTD chart provided instant context.
- Label each campaign metric clearly
- Add trendlines to highlight daily velocity
Turning raw numbers into a clear narrative drove smarter budget reallocations.
Service Provider Cash Planning
For a small consultancy, timing payroll and vendor payments hinges on watching cash inflows through the month.
- Cash In MTD =SUMIFS(Inflows, Date>=FirstOfMonth, Date<=TODAY())
- Cash Burn Rate =MTDOutflows ÷ NumberOfDaysElapsed
By day 8, the CFO spotted a $15K gap and shifted billing cycles to bolster liquidity.
- Define a cash reserve threshold
- Compare MTD inflow to average monthly inflow
- Document your cutoff date in each report
Automated alerts notify finance when cash dips below your safety net. One firm prevented a $50K shortfall by pro-rating invoices based on those early‐month patterns. They even saw a 22% lift in click-through rates after fine-tuning mid-month communications.
Implementation Tips
Apply these scenarios whether you’re in Excel with dynamic named ranges or migrating from Excel to Power BI using DAX functions like DATESMTD. This approach scales from simple KPI dashboards to a robust data warehouse or forecasting model.
Setting Up MTD Calculations In Excel, Power BI And Data Pipelines
Getting month-to-date (MTD) numbers right is like checking your car’s dashboard before you drive—it gives you real-time visibility into how your month is shaping up. Whether you’re tracking sales, cash flow, or any rolling metric, setting up MTD correctly means you can trust the figures you share every morning.
Below is a snapshot of how Power BI Desktop applies MTD logic using its Query Editor on a dedicated date table.
On the left, you can see the Date table loaded. On the right, the DATESMTD function is poised to build cumulative monthly totals each time you refresh.
Excel Named Range Setup
If you’re in Excel every day, start by turning your raw sales or cash figures into an Excel Table named SalesTable. Then create two named ranges:
- StartOfMonth:
=EOMONTH(TODAY(), -1) + 1 - EndOfMonth:
=TODAY()
With those in place, a simple SUMIFS will roll up your MTD totals:
=SUMIFS(
  SalesTable[Amount],
  SalesTable[Date], ">=" & StartOfMonth,
  SalesTable[Date], "<=" & EndOfMonth
)
To skip weekends and holidays, wrap your dates in NETWORKDAYS:
- Count business days:
NETWORKDAYS(StartOfMonth, EndOfMonth, HolidaysRange) - Combine with
SUMPRODUCTwhen you need to ignore non-working dates.
Add a helper column to flag current-month entries:
=--(AND(Table[Date] >= StartOfMonth, Table[Date] <= EndOfMonth))
This turns on-the-fly filters into a breeze. Apply conditional formatting to highlight any low MTD figures, and label your sheet header with:
“MTD through ” & TEXT(EndOfMonth, “MMM D”)
That way, stakeholders never question if they’re looking at yesterday’s data or today’s.
Power BI DAX Measures
In Power BI, DAX does the heavy lifting. Here’s a quick comparison table for your core MTD metrics:
| Measure Name | DAX Expression |
|---|---|
| Sales MTD | CALCULATE([Total Sales], DATESMTD('Date'[Date]), NOT(ISBLANK('Date'[Date]))) |
| Cost MTD | CALCULATE([Total Cost], DATESMTD('Date'[Date]), USERELATIONSHIP(...)) |
Pro tip: Always use a holiday or business calendar table to filter out weekends and public holidays automatically.
Never forget to mark your date table as the official calendar in Power BI Desktop. That little step stops mysterious MTD mismatches.
DAX best practices:
- Don’t apply filters directly on raw date columns.
- Generate a full date range with
CALENDARorCALENDARAUTO. - Keep your measures clean and reusable.
Finally, set up a daily scheduled refresh so your dashboard is updated before the morning briefing.
Automating With Data Pipelines
When your data volume grows, manual updates won’t cut it. That’s where an automated pipeline steps in—running overnight to deliver fresh MTD snapshots.
Follow these core steps:
- Extract: Pull raw tables from ERP or CRM systems.
- Transform: Standardise date columns, then calculate
StartOfMonthandEndOfMonth. - Load: Aggregate MTD figures into your warehouse’s MTD fact schema.
Key pipeline best practices:
- Partition tables by month to boost query performance.
- Implement incremental loads so you only process new or changed records.
- Set up data test alerts to catch failures before they reach your dashboard.
Keep raw and transformed data in separate schemas. That separation gives you clear lineage and makes rollbacks painless. And don’t forget to record each transformation in your data catalog—future-you will thank you.
Once a month, archive older MTD snapshots into a slower storage tier. It slashes storage costs and keeps your reporting layer nimble.
Automate these updates, and you’ll reclaim hours of manual effort each week. Ready to see it in action? Check out our Guide on Building Data Pipelines for a step-by-step walkthrough.
This setup means you walk into the office every morning with confidence in your MTD numbers—no more spreadsheet acrobatics.
Ready to trade manual formula wrangling for reliable, automated MTD reporting? Book your free BI consultation today with Vizule and spend your time on insights, not calculations.
Frequently Asked Questions
Small business operators often wonder: “What exactly is MTD, and how does it influence day-to-day decisions?” Let’s dive in and clear up the confusion.
What Period Does MTD Cover And Why Specify The Cutoff Date?
By definition, Month-To-Date (MTD) begins on the 1st calendar day of the month and runs through your latest business day. Think of it as a snapshot of activity from the start of the month up to today’s close.
When you label a report “MTD Through April 15,” there’s no room for misunderstandings. Everyone sees the same slice of data. Key benefits include:
- Consistency: Teams work from a single, agreed-upon snapshot.
- Cutoff Context: Prevents apples-to-oranges comparisons across reports.
- Stakeholder Confidence: Clear date ranges build trust in the numbers.
- Mid-Month Checkpoint: Offers a real-time health check before month’s end.
Weekend And Holiday Handling
Accounting for non-working days can be tricky, but it doesn’t have to throw off your MTD totals.
In Excel, leverage NETWORKDAYS (alongside a holiday list) to automatically exclude weekends and public holidays. That way, you avoid zeros dragging down your sums.
In Power BI, the secret is a well-built calendar table. Flag weekends and holidays, then call on DATESMTD in DAX.
Best practices:
- Create a HolidaysRange named range in Excel.
- Wrap your SUMIFS inside NETWORKDAYS for accurate day counts.
- In DAX, mark weekend and holiday rows in your ‘Date’ table.
- Use:
CALCULATE([Total], DATESMTD('Date'[Date]))
Excluding non-business days keeps your MTD figures realistic and reliable.
These steps ensure your reports reflect true business-day performance.
When Is MTD More Useful Than YTD Or Rolling Averages?
Imagine you’re a retail manager on day 12 of the month. Rather than waiting weeks to spot a trend, MTD reveals a 10% sales dip almost in real time—so you can adjust staffing or promotions on the fly.
Compare that with other ranges:
- YTD is perfect for annual budgeting but glosses over intramonth shifts.
- Rolling Averages smooth out daily noise yet can delay alerts on sudden changes.
A SaaS founder, for instance, might track MTD sign-ups to catch early churn spikes instead of reacting after the fact.
Common Pitfalls To Avoid
When you present MTD metrics, steer clear of these traps:
- Failing to label cutoff dates clearly leads to misleading conclusions.
- Mixing Excel and Power BI sources without unified date logic skews results.
- Forgetting to refresh data daily means you’re looking at stale numbers.
- Showing only percentages hides the scale of performance.
- Using inconsistent fiscal calendars misaligns your snapshots.
Keep these pitfalls in mind, and your MTD reporting will stay accurate and actionable.


